Three Weeks Of Tight Closes Can Give New Entry Point
INVESTOR'S BUSINESS DAILY
Posted 7/1/2004
When you've found a great stock, the way to make a huge profit in it is to build your position on the way up.
Suppose a stock rises 200% from its breakout point. That gain is less meaningful if you also own 19 or 20 other stocks and all of these occupy the same size in your portfolio.
In a normal bull market, only a few stocks among thousands reap that kind of a gain. That's why it's smart to take advantage of the stock's power as much as you can.
As long as you know and practice sound sell rules, you can build that stake into a large one, then lock in those profits when it's time to sell.
Fund managers have rules governing the maximum size of one position in a portfolio. To reduce risk, they must diversify to some extent.
Individual investors, however, have more flexibility. If the stock has a high average daily volume, an individual can sell his or her entire position with ease, even if that single stock makes up half of the total portfolio or even more.
This column has discussed mild pullbacks to the 50-day moving average and breakouts from new bases as good places to add a smaller amount of shares. Another chart pattern, dubbed "three weeks tight" by IBD founder William O'Neil, gives another entry point.
The pattern usually appears after a stock has broken out of a base and is climbing higher. On a weekly chart, look for three weeks of price action in which the stock closes at virtually the same price.
In one week or two, the stock may swing from its peak and close lower. Or it might sell off early but rally strongly Thursday and Friday. Such swings are acceptable, as long as they are not excessive. Make sure to add a smaller amount of shares than your first position to keep your overall cost low. Cut losses at 7%-8%.
 View larger image |
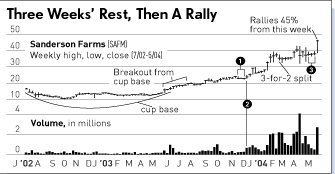
The time to add shares is when the stock rallies the next week on spirited volume. That was the case for Sanderson Farms following its breakout from a cup-with-high-handle base. In the weeks ended Nov. 21, 28 and Dec. 5, the poultry producer closed at 22.95, 23.01 and 22.83 (before a 3-for-2 split) on subdued trade 1 . At the time, it rested on its 50-day moving average (please see a weekly chart).
The next week, Sanderson boosted ahead 4.9% on the heaviest trade in months 2 . The stock also traded three weeks tightly in May 3 before exploding ahead