
Forums
(http://www.elitetrader.com/vb/index.php)
-
Journals (http://www.elitetrader.com/vb/forumdisplay.php?forumid=29)
-- AHG
- Profitable Strategy for Struggling Traders
(http://www.elitetrader.com/vb/showthread.php?threadid=99283)
AHG - Profitable Strategy for Struggling Traders
The intention of this post is to help struggling traders turn their trading
around. It's my way of paying it forward and contributing to a board that
consistently complaints about the lack of useful trading information.
The strategy works in most trending markets but with your help we can make a
great thing even better. It is by no means complete but very much functional and
consistently profitable once some of the trader's skills are polished.
It's simply a collection of ideas, personal experience, trial and errors,
backtesting and things I put together that changed my trading around over the
years.
I'm open to suggestions and ideas on how to improve what I consider a very good
system for daytrading the market. Particularly, the e-minis.
Let's try to keep it civil and friendly as my priority here is simply to help
and improve the system. It's long overdo that I do some contributions and well,
tonight is the night.
Hope it helps and since I designed it I will indulge myself by calling it, for
now...
Anek's Holy Grail v 1.0 ![]() or AHG
for short. As we improve it we can increase the version number. Rest assure,
it's a good working strategy for trading and has been my bread and butter for
quite some time. I see no reason for this changing.
or AHG
for short. As we improve it we can increase the version number. Rest assure,
it's a good working strategy for trading and has been my bread and butter for
quite some time. I see no reason for this changing.
Help me help you and feel free to help us help more by chipping in with ideas.
I shall begin by placing the first stone......
STEP 1 THE TREND
- Determine if there is a MEANINGFUL TREND present
There are two types.
The meaningful ones:
Downtrend = lower highs, lower lows
Uptrend = higher highs, higher lows
The ones you should ignore (for now) because they require greater
skill to consistently profit from or
simply, the sideway ones:
Congestion/Indecision = higher lows, lower highs (Symmetric Triangle
formations)
Consolidation = horizontal lows/highs
As you get more experienced you can profit off consolidation by fading
support/resistance but for now, stick only to
the meaningful trends.
Again, as you get more experienced you can profit off symmetric
triangles (HL LH) because they tend to give birth
to POWERFUL new trends but for now I would rather you stick to the
meaningful trends.
STEP 2 ONCE A TREND HAS BEEN DETERMINED HOW DO WE PLAY IT
- If a MEANINGFUL TREND has been found we need a logical entry.
Let's start with the UPTREND.
We BUY a pullback and we are nimble with our target.
Where exactly ? Well, it can be a 50% Fib retracement from the recent
High to Low swing, or stochastics crossing, whatever you feel
comfortable with. We take advantage of minor WEAKNESS in a STRONG
TREND to get a good fill.
What's your target ? It can be a few ticks below previous resistance,
it can be an upper bollinger band. This is entirely up to you
and only in time you will master this. You could trail the stop to
ride those breakouts, all very discretionary.
Stop ? Whatever would make it a lower low aka a CHANGE of trend.
Now, lets talk about the evil twin, the DOWNTREND.
We SHORT a pop up and again, we are nimble with our target.
Where exactly ? Well, it can be a 50% Fib retracement from High to
Low, Stochastics Crossing, whatever you feel
comfortable with. We take advantage of STRENGTH in a WEAK TREND to
get a good fill.
What's your target ? It can be a few ticks above previous support, it
can be a lower bollinger band. This is entirely up to you
and only in time you will master this. You could trail the stop to
ride those breakdowns, all very discretionary.
Stop ? Whatever would make it a higher high aka a CHANGE of trend.
Important, we never go against the trend. When the trend is strong we
buy a pullback. When the trend is weak we short a pop up.
No exceptions, don't play hero or Nostradamus. There is not a soul on
earth who can predict the market consistently and what we want is consistency,
so be smart about this.
If STOPPED OUT, meaning, a CHANGE of a trend, we stay ON THE SIDELINES
until a NEW MEANINGFUL TREND is defined and we take our stop
like responsible traders. If we get faked out, so be it, plan your
trade and trade your plan. Losses are inevitable and quite
alright as long as we limit them to small numbers.
Who is our enemy ? You got it, REVERSALS. REVERSALS stop us out.
Lucky for us, they are not very common which is exactly why this
strategy works. Some days will be filled with them and sadly I don't
know how to overcome this. On days like this, I lose money.
Surprisingly so, people call reversals all the time then you wonder
why 90% of traders lose money ? We never call a top, we never
call a bottom, we never say "Oh it's too high" or "It's too low", the
market has no boundaries. Yes, you heard that right, NO BOUNDARIES.
There are so many variables in the market it is IMPOSSIBLE to predict
accurately on a consistently basis therefore the best I can do is
examine what is happening NOW and try to profit from some possible
volatility and situate myself in a strategic place, with patience
and conviction.
STEP 3 INDICATORS
I'm not a big fan of technical indicators, mostly because I have no
interest in using something that tells me what happened 10 years ago.
Price action is all I need and when using tick/share charts I don't
need to use a volume indicator.
However, there are some I use for strength/weakness references,
entries and exits.
For example:
BOLLINGER BANDS with 2.5 Standard Deviation. (I feel 2.0 gets hit far
too often and distracts me with noise)
When price is continuously hitting a band, pay attention. It's trying
to tell you which side is stronger. If you are having difficulty
identifying the current trend or suspect a reversal, the constant
hitting of a particular band can provide great info as to where
momentum is headed.
TRENDLINES, as many as you need to determine the current trend.
STOCHASTICS, a cross can be a powerful tool when you are looking for
an entry in a strong trend. I like 5,3,3 but use whatever you feel
comfortable with.
FIBONACCI RETRACEMENT LINES, my favorite. 50% from last swing
low/high and you got an excellent entry point. Problem is sometimes the
trend is so strong it won't even give you your wish and you miss the fill.
STEP 4 MONEY MANAGEMENT
As you get more experienced, I highly recommend you use an average up
approach. More on this later, until then, use the same car size
on every play and for God's sake DO NOT AVERAGE DOWN unless you are
just trying to get fills for your intended car size, never
surpassing it. I previously stated and those that known me for a
while know I advocate averaging up. I feel this is an advanced money
management technique and for now I am not disccusing it to avoid
confusion/mistakes.
STEP 5 DISCIPLINE
I'll be blunt. Trading is not for the irresponsible. Break the rules
and you will eventually lose big, period. Trading will forgive
you if you were wrong on a play even several ones, it won't forgive or tolerate
idiocy and stupidity. All I need to say on this and you have been
warned.
STEP 6 CHART TYPES
Longbars are evil, therefore I highly recommend tick/share charts so
you can split that data and examine it with care. For the YM
I recommend 75 or 89 tick charts. This differs greatly from one
instrument to the other, the more volume/activity it has the greater
the ticks size you will need. Use what you feel comfortable with.
Bye for now,
Anek
A nice start. Good wishes for the thread.
__________________
------------------------
The things people believe in are usually just
what they instinctively feel is right; the justifications and arguments are the
least important part of the belief.
That's why you can win the argument, prove them wrong, and still they believe
what they did in the first place. You've attacked the wrong thing.
So what do you do? Agree to disagree. Or fight. - C. Zakalwe.
Re: AHG - Profitable Strategy for Struggling Traders
Quote from Anekdoten:
It's simply a collection of ideas, personal experience, trial and errors, backtesting and things I put together that changed my trading around over the years.
I'm open to suggestions and ideas on how to improve what I consider a very good system for daytrading the market. Particularly, the e-minis.

Quote from kiwi_trader:
A nice start. Good wishes for the thread.
Good luck with this, bro.
Market Profile?
I'm encouraged by your post, because it confirms that a successful trading
system can really be that simple.
Since you said you were looking to enhance the system, have you ever considered
the following as filters:
1. Market Profile - Used to identify when the market is seeking new value
(trending) vs. when it is within a value area (congestion). You can also look at
the TPO's to find S/R areas. I'm trying to learn MP right now myself, with the
intention of trying to identify higher probability trend environments.
2. Normal S/R swing lows/highs (higher timeframe, maybe a 400 tick chart) -
Avoid taking signals if you're approaching a major S/R line (where reversals or
stalls are likely).
3. Divergence on a higher timeframe momentum scillator to filter out lower
probablity entries? I have a hard seeing/trusting these divergences myself, but
I know that other people use them successfully.
Please note that the above suggestions are not based on extensive experience...
I've been studing futures trading for about three years now and they are simply
based on what I've learned and my observations. The first two I am trying to
incorporate in my simulated trading.
Re: Market Profile?
Quote from mikehbeck808:
I'm encouraged by your post, because it confirms that a successful trading system can really be that simple.
Since you said you were looking to enhance the system, have you ever considered the following as filters:
1. Market Profile - Used to identify when the market is seeking new value (trending) vs. when it is within a value area (congestion). You can also look at the TPO's to find S/R areas. I'm trying to learn MP right now myself, with the intention of trying to identify higher probability trend environments.
2. Normal S/R swing lows/highs (higher timeframe, maybe a 400 tick chart) - Avoid taking signals if you're approaching a major S/R line (where reversals or stalls are likely).
3. Divergence on a higher timeframe momentum scillator to filter out lower probablity entries? I have a hard seeing/trusting these divergences myself, but I know that other people use them successfully.
Please note that the above suggestions are not based on extensive experience... I've been studing futures trading for about three years now and they are simply based on what I've learned and my observations. The first two I am trying to incorporate in my simulated trading.
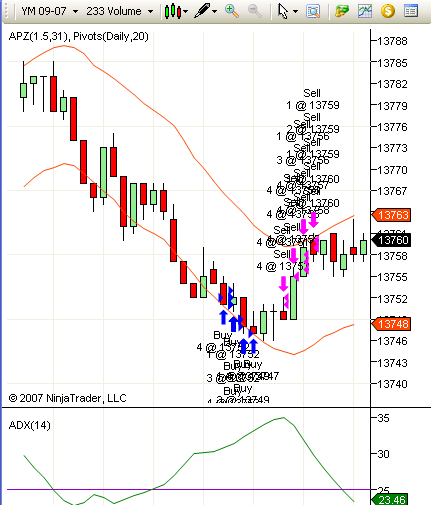
Today's scalps....
Green vertical denotes a long signal.
Red vertical denotes a short signal.
One of the longs was a loser, little trend change hesitation there, the rest got
their targets.
At this time of the day I usually close the platform. 3:21PM EST now.
Quote from Anekdoten:
Today's scalps....
Green vertical denotes a long signal.
Red vertical denotes a short signal.
One of the longs was a loser, little trend change hesitation there, the rest got their targets.
At this time of the day I usually close the platform. 3:21PM EST now.
Quote from mikehbeck808:
Can you comment on the 4th short signal... looks like the market made a higher low, but you sold short again.
Also the 2nd long signal came after a minor lower high and lower low.
I'm not trying to be critical, I'm wondering if maybe you require a certain number of bars to pass or maybe a trendline break before you consider a HH/HL to be a valid change of direction when the market was previously trending down.
Re: Market Profile?
Quote from mikehbeck808:
I'm encouraged by your post, because it confirms that a successful trading system can really be that simple.
Since you said you were looking to enhance the system, have you ever considered the following as filters:
1. Market Profile - Used to identify when the market is seeking new value (trending) vs. when it is within a value area (congestion). You can also look at the TPO's to find S/R areas. I'm trying to learn MP right now myself, with the intention of trying to identify higher probability trend environments.
2. Normal S/R swing lows/highs (higher timeframe, maybe a 400 tick chart) - Avoid taking signals if you're approaching a major S/R line (where reversals or stalls are likely).
3. Divergence on a higher timeframe momentum scillator to filter out lower probablity entries? I have a hard seeing/trusting these divergences myself, but I know that other people use them successfully.
Please note that the above suggestions are not based on extensive experience... I've been studing futures trading for about three years now and they are simply based on what I've learned and my observations. The first two I am trying to incorporate in my simulated trading.
Re: Re: Market Profile?
Quote from dandxg:
I just started working with MP. Today, from my limited exp. with it, was just balance YM. I just scalped around a bit, although not really my favorite. No trend to be had.
I am hopeful that MP can help my filter my entry signals. So far so good.
Quote from Anekdoten:
Do you think in the screenshots I should stick ONLY to the basic plays to avoid confusion ?
I could use your opinions here.
I was just speaking to a fellow trader and he suggested that the more things get added the more complicated the system can get. He is absolutely right, so I got to make sure that any enhancement is worth the trouble to avoid technical complexities. As it is now, it's very simple and relaxing. The earth the stars and the moon must not be aligned for now and that's exactly what I want to avoid, yet I can't say no to any improvement as long as things stay moderately simple.
Mike,
Sometimes it's hard to get a good fill because logical trading is no secret to
experienced traders. What I do to overcome this is I try to anticipate where
price might be if a 50% retracement occurs or a stoch cross and situate myself
with a limit order in the race not only to get a good position in the queue but
to get filled on those quick whipsaws that are brutally fast yet golden.
This is all scalping so every tick counts.
For what is worth, all my entries are limits, all my targets are limits and all
my stops are market.
Anek
It would be more encouraging if you didn't ignore people's requests for
your personal background. Hook. N Sinker asked some very good questions, and you
ignored him. You presented your methods as profitable, successful and what we
should do.
Without this, all these things you are posting is gibberish, unproven and
useless until proven otherwise.
Then to mikeh, you respond about what you think reliable or successful. So why
are you the judge of what is profitable? You are a relative unknown here, so
there is no evidence you know more than anyone else.
If you are looking to moderate a fruitful thread, you need not to be the expert
.
Attached please find one of the main reasons as to why my signals switched
from shorts to longs today.
The trendline also marks the three tops I spoke about.
Quote from rcanfiel:
It would be more encouraging if you didn't ignore people's requests for your personal background. Hook. N Sinker asked some very good questions, and you ignored him. You presented your methods as profitable, successful and what we should do.
Without this, all these things you are posting is gibberish, unproven and useless until proven otherwise.
Then to mikeh, you respond about what you think reliable or successful. So why are you the judge of what is profitable? You are a relative unknown here, so there is no evidence you know more than anyone else.
If you are looking to moderate a fruitful thread, you need not to be the expert .
Quote from jimmygold:
Anyway, Anek I really appreciate this new thread and look forward to learn and contribute on an ongoing basis !!
Quote from mikehbeck808:
Yikes, that's some serious negativity. I wasn't trying to moderate, just participate. The original post openely invited questions and observations (isn't that what makes a successful thread?), so I decided to stop lurking for a moment and contribute. I didn't realize I had to prove I was an expert before posting... if that were a requirement elitetrader would be a ghost town.
I openly disclosed that my opinions are not based on real-market experience (just observation and simulated trading), which I dare say is more honest than most of the jokers on this site, so I never claimed to be the judge of anything. I just got very excited by a generous post from someone who is disclosing a logical trading methodology which happens to be extremely similar to a method I've been refining and practicing for several months now. To me that's exciting and encouraging. I don't need someone to show me their bank statement to believe a market approach works, especially if it confirms what I've already noted about market behavior.
Until the OP begins asking for money for his insights, he doesn't have to prove anything to us. It's very easy to try out new methods without risking real $$ on a market simulator. I view threads like this and others that have been started by other generous people to be exactly what they are: a rare gift. Take it or leave it.
Quote from Anekdoten:
Attached please find one of the main reasons as to why my signals switched from shorts to longs today.
The trendline also marks the three tops I spoke about.
Quote from abaker:
Hi Anek,
On your chart you pointed to a possible trend change.
What caused you to see that. Was it the two higher lows and one higher high(between 13:16 and 13:20), together with the strong upcandle that broke the 50% level of the last down swing?
Great day today, nothing but lower highs and lower lows. No reversal yet but the YM approaching the 900 support area so congestion to be expected. The morning however, has been nothing but paradise for the system. In fact, today so far is optimal for my style. Due to OEX and 900 support area I might skip the afternoon and keep the profits. Charts to come....
Its surprising that more people dont have the patience to wait for days like this and load up when they come along. A couple of good down days a month is all you need and there almost always is. The problem is that most people cannot be the frog. Whew. This is getting bloody.
Quote from Bearbelly:
Its surprising that more people dont have the patience to wait for days like this and load up when they come along. A couple of good down days a month is all you need and there almost always is. The problem is that most people cannot be the frog. Whew. This is getting bloody.
Chart for 07.20.07
Vertical green line is long.
Vertical red line is short.
There is no magic in here, just the system.
Weekend is here !
PS: Note to self stop taking those lame ass MACD crosses even if the stop is
minuscule, that thing lags more than your grandma. Use strictly for trend visual
reference, mountain colors or get rid of it.
Well make up your mind.. you sound like our grandma
Quote from Anekdoten:
PS: Note to self stop taking those lame ass MACD crosses even if the stop is minuscule, that thing lags more than your grandma. Use strictly for trend visual reference, mountain colors or get rid of it.
Quote from bigbadbaz:
Well make up your mind.. you sound like our grandma
Ahhh the ole zero line conundrum.. it's all interpretation Holmes.. indicators are a good servant but a poor master
Quote from Anekdoten:
As a visual indicator it is helpful when things get hectic but the zero line cross distracts so need some discipline there. There is always room for improvement.
Quote from bigbadbaz:
Ahhh the ole zero line conundrum.. it's all interpretation Holmes.. indicators are a good servant but a poor master
If an indicator is taking trades away from you then you are letting it influence you instead of working it to unveil the price action your brain unconsciously recognizes
I got several requests via PM to post my workspace therefore I'm attaching a
screenshot to this post.
If you got questions, just use the the journal, if it's something personal then
sure PM me but i got 3 PMs that had the exact same question.
I only use one monitor when trading, big one though, and as far as the main
chart I adjust tick chart on the fly depending on volume for the day or
whichever reference I need. Usually I change from 75 to 89 to 150 200 250,
depending on price action but only one point of view and my big anchor chart
which is the 2000 tick for big S/R.
Hope it helps.
Several months ago someone in the forums posted this chart for reference and
I kept it in my archives. I'm sorry I can't remember who did but he/she deserves
the credit.
This is what it's all about, price action, all else is secondary.
Quote from rcanfiel:
You weren't the subject. But it was disappointing when someone else ("Hook) brought up valid points, and the OP blows through them. Readers have the right to ask questions like those, before newbie traders who read this start risking their capital on it.
If someone (OP) present a thread based on his methods as if they are profitable and as the solid basis, not even answering someone who asks valid questions is a poor sign.
And it remains so, to this point.
A person with some 30-40 posts saying he is profitable is a suspicious thing to ET netizens. Next thing you know, AHG will become a website, where followers are encouraged to subscribe.
I'm not sure you said fuck enough.. a real professional trader would have used it every second word not just every third or fourth
Quote from Daxtrader:
man shut the fuck up and get the fuck out of this thread. fucking assholes, always looking for complete handouts. OP, continue please.
Quote from Anekdoten:
Several months ago someone in the forums posted this chart for reference and I kept it in my archives. I'm sorry I can't remember who did but he/she deserves the credit.
This is what it's all about, price action, all else is secondary.
Quote from epiktetos:
Thats from ghkramer I think.
Good luck Anekdoten.
As a weekend exercise I continue to backtest/study fixed volume bars as I
slowly begin a transition to them. It has been almost 5 months since I began the
transition but still very much a work in progress. As they say don't fix what is
not broken but if we don't experiment or take new risks we risk never improving
our current methods.
Good friend of mine is always making fun of my ever evolving charts and well,
that is probably the reason why, I'm always experimenting.
Trades for 07.23.07
All winners except the first long.
Green lines long
Red lines short
Thick white line, change of a trend.
100% system following no deviation.
Morning > Afternoon imho
Skipping lunch helps.
Calling it a day.
I made some of the same trades today. Are you setting a target for exit? I need to start using a program that automatically enters a stop. I sometimes enter a limit order by mistake which kills the trade. Keep posting, much appreciated.
Quote from bmwhendrix:
I made some of the same trades today. Are you setting a target for exit? I need to start using a program that automatically enters a stop. I sometimes enter a limit order by mistake which kills the trade. Keep posting, much appreciated.
Tomorrow I take my volume bars chart transition live. After studying them for
5 months I think I will be able to read price action better this way.
Also asked a friend savvy in EL to help me code some slope/colors into the
stochs.
I've also said my official farewell to the old dog MACD, cant' say I will miss
you. In fact, the screen real estate is more than welcome. Since I only used
MACD as a quick trend reference I decided to add a 34 Hull Moving Average on
screen instead. Why 34 ? Because it's a fib # and it makes me a "cool trader".
Do I actually believe in this voodoo shit ? Only on fib 50% retracement
![]()
New chart attached.
Countertrending Trades, definitely not part of the system.
However some are just too pretty.
I did not trade the afternoon but after analyzing it here is one I could have
not said no to.
Of course, "Support" gave it away.
..also notice how price rebounded off the previous "major" support on the
previous up-wave. Now, don't use this info to countertrade just yet but as extra
info for your stops/targets/trails etc.
It also alerts you. For example, "hmm major support is coming, perhaps the trend
will develop into congestion or maybe even a reversal, not the right time to
trail...." Cover, wait and analyze the rebound.
Market hours were about to close in NY but how price reacts to support is very
important. For instance, if the bounce, and there is usually always a bounce at
major support, was anemic, then perhaps the bearish trend is even more powerful
than expected and you could be more greedy with your shorts, etc.; after getting
rid of your longs of course.
The market speaks but it's imperative that you listen.
I'm not saying it is but sometimes trading can really be this easy.
Hope it helps.
Quick tip.
Remember that a lower low without a lower high is not the same as a lower low
and a lower high :0 .... at the same time a higher low without a higher high is
not an uptrend. Patience is required, wait for those patterns to develop, wait
for an opportunity, look around you (s/r) aim (think of entry/stop/targets) then
fire (execute).
Ok bedtime now !
How do you get the ma line to change color? Looks nice! Appears to change
color based on the slope of the line, up or down. Nice visual of trend.
Never mind! I just added the indicator and I see the color thing is built in.
![]()
Quote from Jaxon:
How do you get the ma line to change color? Looks nice! Appears to change color based on the slope of the line, up or down. Nice visual of trend.
Never mind! I just added the indicator and I see the color thing is built in.
so we have a low this morning of 13892
the question is, do you play this from here as an uptrend or a downtrend?
We are congested at this point.
Clear and useful thread,thanks..except I don't quite get how you determine
your targets..are they equal to your risk that you take on every call? I use
similar method/system/ but seems like too often I "overstay market's
welcome''...keep it up![]()
Quote from Anekdoten:
We are congested at this point.
Trades for 07-24-07
Daily target reached fairly quickly based on last short so decided to call it a
day.
The long on the chart reached it's target but did not get the fill, moved the
stop to break even and finally broke down.
The rest did well, second short nothing spectacular, barely a positive trade.
Last short definitely did it.
Staying loyal to the morning > afternoon I'm taking off.
Quote from vinc:
Clear and useful thread,thanks..except I don't quite get how you determine your targets..are they equal to your risk that you take on every call? I use similar method/system/ but seems like too often I "overstay market's welcome''...keep it up
Quote from Jaxon:
cough cough!

agree
Looks like a trending afternoon, wish I saw it coming. Oh well tomorrow the
market also opens, no harm done.
What an afternoon, after I saw the avalanche coming there was no doubt in my
mind, and prob in yours, that the trend was nowhere but down.
I managed to take a few but by the time I returned to trading it was almost
over. The sad part is that it would had been a tremendous show for the journal.
Nothing but lower lows and lower highs that could had been shorted to hell on
every pop up.
However, there will be a day it happens again, hopefully soon and I will be all
over its ass. In fact, that's where my system excels at.
Have a nice night.
Little late night reading.
Advantage of scalping with the trend. Not only do you get more opportunities but
well, the chart speaks for itself and it has annotations.
If you suffer from over-trading, this chart is for you
![]()
Trend is your friend !
Thanks for the nice charts and good analyses. Here is a similar way of
looking at countertrend supports-but it is absolutely true, why fight the
trend-it is just nice to know you could. We all could be
heros sometimes - you don't need special powers - Hiro Nakamura
![]()

Quote from tmarket:
We all could be heros sometimes - you don't need special powers - Hiro Nakamura
You got to love the way they run this up and down, but take the scalp trade
when you can. The ADX was peaking and other volume indicators showing buying in
this trade, no way of knowing how far a run up (it was easily another 20 points,
but it was still countertrend. Sorry to clutter up your neat journal.
![]()
T,
Ya I see what you mean by ADX. Haven't studied it yet, need to see if the signal
is > 50% then I can consider it.
Yep, loving the morning so far, many many trades
![]()
still having a tough time. I did finally (hah!) identify the trend as down this morning, but still had trouble finding good entries... hard to believe in hindsight.
Quote from Jaxon:
still having a tough time. I did finally (hah!) identify the trend as down this morning, but still had trouble finding good entries... hard to believe in hindsight.
Trades for 07-25-07
Note1:
When a trendline is broken and the last high is a lower high it's safe to take a
short on a pop up. Unfortunately, the pop up never occurred and I could not get
my fill, but I was shooting for a good target there. Worked like a charm except
I could not capitalize from it due to no pop up. The least you want to do when
that happens is chase it.
Note2:
Change of a trend. At this point you should see why. I took a short there, lost
and took a full stop.
Note3:
At the top see those higher high tops ? Well as priced tanked I took a long when
price stabilized and worked well. Not sure if it was the most optimal play (high
stochs and all) but took my quick profits little bit below resistance and said
to myself take your break, your day is over.
As always, vertical red lines shorts, vertical green lines long, with the trend,
on the pullbacks/pop ups. Third short got stopped out. Fifth short BE trade.
Rest did well. Longs did well.
Not so hard, just need to polish those skills of constantly examining the LL HH
LH HL.
Last but not least maximum discipline at all times
Real nice market today.
Anek
PS: Morning > Afternoon but there are exceptions like yesterday (sob!)
![]()
Could not say no to this one....
Once again, trendline break on lower highs.
Trailing this baby, let us see how it goes.
Great charts. It looks like you enter your trades when the price crossed the middle of the bollinger band rather than off of the sto. Is this correct?
Not taking profits until a higher high is made.
Little lesson in letting the winners run. Hope it goes well for the
illustration.
Quote from bmwhendrix:
Great charts. It looks like you enter your trades when the price crossed the middle of the bollinger band rather than off of the sto. Is this correct?
....and the conclusion. The higher lows hinted it and the higher high confirmed it. Optimal cover point possibly the higher low formation but as you eat lunch and take the rest of the day off it's ok to say once in a while, WTF let's see if it can make a new HH, and well it did.
Quote from bmwhendrix:
rather than off of the sto. Is this correct?
How do you get those nice red and blue lines at the highs/lows? Custom t/s indicator?
Quote from bigbadbaz:
I'm not sure you said fuck enough.. a real professional trader would have used it every second word not just every third or fourth
__________________
-You're seriously damaging my calm.
Quote from Jaxon:
How do you get those nice red and blue lines at the highs/lows? Custom t/s indicator?
Thanks, I will use the HA bars. I couldn't get your linked file to work, but I found the paintbar on the Tradestation support forum. What I can't find is how you make those blue lines to mark the highs and red lines (dots) to mark the lows on your charts. Might be labeled "SHME Dynamic SR" on your chart.
following along..
thanks for the great thread!
![]()
Quote from BigBubba:
following along..
thanks for the great thread!
Quote from Jaxon:
"SHME Dynamic SR" on your chart.
Quote from TheRumpledOne:Wow... SHME PushHiLo AutoX is an old indicator... It became my Pip Scalper indicator. It shows dynamic support/resistance.
I posted it on www.kreslik.com
How are the dynamic S/R lines determined? (ie what's the code for that?)
Thanks for the thread, it's fun to follow along.
Couple of common questions sent via PM.
NEWS
I don't follow the news except when I bump into them after trading.
I used to pay attention to the time of important news releases but I don't
anymore.
If the trade goes against me I will get stopped out and if it goes in my favor I
will hit my target(s) simple. A canadian friend taught me that, you know who you
are.
The news itself is absolutely worthless to me for trading. How the market reacts
cannot be illustrated better or faster than in a clean chart.
The one exception is FOMC. I trade that differently, more like personal fun
trades with minimal car size but the point is I do pay attention for the day and
time of that particular announcement because the news can be very drastic and
basically kill all patterns within sight.
SWING TRADING
Usually I don't as I'm mostly a scalper. It's got nothing to do about holding
overnight, I just prefer the higher size small stop approach.
Ok that's about it.
Quote from tmarket:
http://www.elitetrader.com/vb/showt...=6&pagenumber=5
Quote from Bogwaluth:
How are the dynamic S/R lines determined? (ie what's the code for that?)
Thanks for the thread, it's fun to follow along.
Hi Anek
Thanks for the journal
When do you feel a bottom is a bottom. My question is easier to see on the chart
07.26.07
Bearish trending day, "we've been expecting you!"
Vertical green longs
(2nd didnt work due to reversal)
Vertical red shorts
(5th didnt work due to reversal)
Morning trades attached, afternoon will follow on next post.
The trend is your friend baby!
07.26.07 Afternoon
Highly more difficult session. In many cases due to reversals and congestion i
got chopped to death but still was able to fight through the storm to score some
good plays. Morning was by far more optimal for the system.
Shorts
First and second worked well
Third did too, took little heat but after sticking to the plan it worked well.
Fourth, a beauty.
Fifth stopped me out, hint of reversal.
Sixth worked, took little heat but worked well.
Seventh took a full stop, hint of reversal.
Longs
First, full stop, hint of reversal.
Second, worked with massive heat, price got 2 tick from the stop then KABOOM and
Ca$shing.
Third, was a beauty.
Fourth, another beauty.
Fifth, biggie stop, got killed here.
Sixth, another stop.
Morning score: 2 losers and 9 winners.
Afternoon score: 5 losers and 8 winners (yes overtraded a bit but emotions got
to me, was a crazy day!)
Total score: 7 losers 17 winners
And called it a day, overall, extremely profitable day with a more dangerous and
complicated afternoon. Morning was just kindergarden stuff for the system.
Tip of the day, trade what you see, with the trend, whether is up or down, no
bias. Stick to your method and in and out, in and out. Believe in your method
and your method will believe in you.
Hope it helps, what a day!
Quote from abaker:
Hi Anek
Thanks for the journal
When do you feel a bottom is a bottom. My question is easier to see on the chart
Hi,
Love the thread, thanks.
1) Does anyone have an esig Heiken bar .efs ? (I went to the esignal forum and
found one but it overlays on regular bars and you have to paint the regular bars
background colour not to see them.....problem is if you stick a bollinger or
whatever on there it calculates based on regular price bars....)
2) I noticed you used 200 sb chart yesterday but used a 250 sb today ? Is there
any indication when to use which one ?
3) On a regular session (not like today obviously) what point values is the
usual target and stop ? ie: 10 point stops with 10 point gains, 15 point stops
with 15 point gains....etc
4) Can you go over briefly how you indentify congestion ?
5) I don't see what purpose the stoch serves or bollinger bands serve.....to me
it just looks like you see trend up so buy when the first or second bar turns
green, or if trend down short when first or second bar turns red (after a series
of atleast a few bars agains't the trend obviously first....ie: reasonable
retrace).....then you enter on bar colour change back in the direction of trend
set stop of X amount of points and set target of X amount of points....
6) Have you tried this on ES (just wondering because slippage will become an
issue on YM on real size whereas ES can take 200 - 300 cars with maybe .25
slippage max.....lol, I am only doing 1 car but just curious for someone that is
consistently profitable and wants to continue to increase their gains like
yourself.
Cheers ![]()
Quote from Razor:
Hi,
Love the thread, thanks.
1) Does anyone have an esig Heiken bar .efs ? (I went to the esignal forum and found one but it overlays on regular bars and you have to paint the regular bars background colour not to see them.....problem is if you stick a bollinger or whatever on there it calculates based on regular price bars....)
2) I noticed you used 200 sb chart yesterday but used a 250 sb today ? Is there any indication when to use which one ?
3) On a regular session (not like today obviously) what point values is the usual target and stop ? ie: 10 point stops with 10 point gains, 15 point stops with 15 point gains....etc
4) Can you go over briefly how you indentify congestion ?
5) I don't see what purpose the stoch serves or bollinger bands serve.....to me it just looks like you see trend up so buy when the first or second bar turns green, or if trend down short when first or second bar turns red (after a series of atleast a few bars agains't the trend obviously first....ie: reasonable retrace).....then you enter on bar colour change back in the direction of trend set stop of X amount of points and set target of X amount of points....
6) Have you tried this on ES (just wondering because slippage will become an issue on YM on real size whereas ES can take 200 - 300 cars with maybe .25 slippage max.....lol, I am only doing 1 car but just curious for someone that is consistently profitable and wants to continue to increase their gains like yourself.
Cheers
Cheers ![]()
Quote from Anekdoten:
1) I'm sure Esignal has HA bars. I mostly use their colors for quick reference.
2) I adjust tick/share volume depending on how I feel the current day is developing. If low volume day, might even go down to 150, 100. etc. Just looking for the right glasses you know.
3) I suggest to trade with a 1:1 risk vs reward ratio then as you get better you can increase the reward; as you get more optimal entry areas and a feel for when things are running your way. HA bars help for the runners, so do the dots I use on the bottom, HHs if you are long, LLs if you are short, etc. I believe this area is very personal but I definitely dont suggest a crazy 20 point stop and 10 point target, that's just plain bad risk management. You need to turn the odds in your favor or you won't win. Remember, the best trades always tend to work from the start causing very little heat. If your examination is correct, no need to use volatility as insurance. Big stops in contrast to targets are for the insecure.
Amateurs want to be right, professionals just want to make money, therefore, I believe a 1:1 risk vs reward is a good starting point to FORCE yourself to trade well. 1.3 risk vs 1.0 reward MAYBE for starters but never above that. As you get more experienced it is your duty, yes your duty, to start expanding that reward area, and only then is that you reach constant profitability. If you *have* to use a bigger stop then you simply need to polish your entry skills or else look for other risk management methods like adjusting stops on the fly, of course, always tightening NEVER widening. The idea is to REDUCE risk not increase it.
4) Congestion is when you see a HH and LL or HL and LH. ie Consolidation, Symmetric Triangles, etc. Uncertainty if you will.
5) I use it as guidance, indicators for me are simply confirmations, references. Price > all. If you feel better without them, by all means, get rid of them, more real estate for price ! However, I still find 5,3,3 crosses with the trend useful, I try to anticipate them all the time. Bollingers, again, another reference, when price is hugging a band, another quick reference of current momentum.
6) Absolutely, that is the plan for the future. Could not agree more.
Hope it helps.
Long live trading - Greed is good !
![]()
Another fairly easy day with strong trending moves, just how I like them.
Pretty good hit rate today, very pleased with the market.
Friday afternoon and as expected, some choppyness so heading out to relax.
Charts will come soon for sure ![]()
07-27-07
6 Winners 3 Losers, no shame in that, just filling the cup with drops, but
filling it ![]()
Yep, i deserve the loss on the last short, bad call.
Second short was a home run, 49 points.
Market was a good boy but I could have read it better so not sure why i said
earlier I was pleased with the market. Perhaps I am, and just not pleased with
myself. Oh well, the idea is to end up in the green with discipline and
patience, and that I did.
Went back to TICK charts for comparative reasons and cleaned some aspects of the
chart. Using Pivot High/Low indicator from Tradestation to compare with S/R
dots, so far I like my cleaner charts. (Sorry TRO)
Played with new stoch settings, but prefer 5,3,3 for now.
This marks the end of a full trading week. Not a single down day and without
special magic.
Same as always, system trend following, in and out without deviating from the
rules.
Anek
Akhnoten, you gotta know you got a problem when you're tweaking the indicators.
Quote from trader225:
Akhnoten, you gotta know you got a problem when you're tweaking the indicators.
Quote from Anekdoten:
I like to experiment and evolve always looking for better results. Don't see a problem with that.
Quote from trader225:
The problem is that by the time you've tweaked your indicators, the market may have changed.
Here is my chart from this morning. Looks like I made a few of the same
trades. I do not find the sto very helpful and deleted it.
I am using a long term macd as a reminder that a trend may be ending when I see
a divergence, just take it more slowly then.
Andec, thanks again for sharing
My first attempt at posting a chart.
Quote from bmwhendrix:
Here is my chart from this morning. Looks like I made a few of the same trades. I do not find the sto very helpful and deleted it.
I am using a long term macd as a reminder that a trend may be ending when I see a divergence, just take it more slowly then.
Andec, thanks again for sharing
My first attempt at posting a chart.
Anek I have a couple of questions. Do you not trade certain hours of the day
and do you use any special considerations on non-trending range days to stay out
of trades?
Thanks,
Don
Quote from bmwhendrix:
Anek I have a couple of questions. Do you not trade certain hours of the day and do you use any special considerations on non-trending range days to stay out of trades?
Thanks,
Don
07-30-07
Trades for today.
7 longs
5 winners
2 losers
1 short
1 loser
(the short. ALMOST worked, but hit my stopped then my target, evil !)
Total:
3 losers 5 winners
Most of the winners were trailed for a splendid day. Noticed I took way less
trades with the 14,3,3 stochs and eventhough my broker is not pleased, I am.
Hope it helps.
Anek
Well at this point it should be fairly easy to notice that I'm mostly doing
trend following with the stochs in its most basic form.
I do additional scalps and look for symmetric triangle formations, like one that
formed today in the afternoon below the HOD that was simply a beauty, but I
don't post that because it's a bit more advanced trading and not pertinent to
this journal.
I'm down to two indicators, stochs and heikin ashi bars and it looks like I'm
going to keep it that way, simple is better.
I'm waiting for a massively congested day to demonstrate how those can be tough
to trade with this system but all in all I feel I have covered most areas in my
charts.
Anek
Here is the symmetric triangle I mentioned earlier.
Lower Highs
Higher Lows
Price gets trapped, when it finds a direction and escapes, you got a breakout.
Especially when close to LOD or HOD areas. In this case, it was below HOD and
made a new one.
Am I getting through with this ? ![]()
Possibly the most aggressive play I did today.
Anek
Anek,
Just wanted to say a big thanks for this thread and your charts with trades. I
am finding this information very helpful and I would appreciate if you could
continue for a few more weeks so you can show us how you handle some lower
volidity days and chop days.
Thanks again ![]()
Razor,
Glad you like it. Sure, I don't feel I have covered all trading scenarios yet
but we are getting close.
Practice the skill of recognizing trends, particularly where those HH, HL, LL
and LHs are formed and in the long run you will develop a sixth sense for that
kind of action.
When price is ready to act it has a peculiar characteristic, sort of like fire
in it ass. Learn to read its behavior. Polish the skills. If you can, record
live trading days with Fraps or Camtasia, if you got Esignal then you got the
play by tick feature built in, study live action once the day is over. Every bit
helps. Study and practice, study and practice.
Those that quit before the end of the road end up losing. Perseverance and
patience is the key.
I can't remember the last time I had a losing month trading this method.
If I can do it, you can do it. It just took time to develop the skills
Anek
Anek,
I'm enjoying your thread very much; keep up the good work. Two questions:
1) Can you talk about your money/trade management? ie. setting initial stop
losses, scaling out of trades after certain profit targets are hit, and trailing
stops. Do you have hard and fast rules on managing the trade or is every trade
discretionary?
2) Do you use limit or market orders?
Thanks,
Tyler
Quote from tv92670:
Anek,
I'm enjoying your thread very much; keep up the good work. Two questions:
1) Can you talk about your money/trade management? ie. setting initial stop losses, scaling out of trades after certain profit targets are hit, and trailing stops. Do you have hard and fast rules on managing the trade or is every trade discretionary?
2) Do you use limit or market orders?
Thanks,
Tyler
Quote from Anekdoten:
Razor,
Glad you like it. Sure, I don't feel I have covered all trading scenarios yet but we are getting close.
Practice the skill of recognizing trends, particularly where those HH, HL, LL and LHs are formed and in the long run you will develop a sixth sense for that kind of action.
When price is ready to act it has a peculiar characteristic, sort of like fire in it ass. Learn to read its behavior. Polish the skills. If you can, record live trading days with Fraps or Camtasia, if you got Esignal then you got the play by tick feature built in, study live action once the day is over. Every bit helps. Study and practice, study and practice.
Those that quit before the end of the road end up losing. Perseverance and patience is the key.
I can't remember the last time I had a losing month trading this method.
If I can do it, you can do it. It just took time to develop the skills
Anek
Quote from Razor:
Cheers
PS: As a note I am trading this with the NQ right now because the dollar stops are smaller than YM.
Net -$76 Fri, Net -$28 today....almost breakeven if ya don't factor commish so not a bad start IMHO
Quote from Anekdoten:
If you post your charts perhaps I can spot the flaws if any.
Anek
Razor,
Magnifying glass is on !
I'll be watching ![]()
BTW.....
You can enhance your trading by making an effort to recognize the three most
powerful patterns in trading.
1) Symmetric Triangles
2) Double Bottoms
3) Double Tops
Anek
took one trade this morning - it was nearly a perfect setup, I was seeing lower highs, lower lows, but i shorted too close to the bottom of the bar and got stopped out almost instantly.... by a higher high! The market then continued its downtrend. I know I can't let stuff like that bother me and must keep trading and taking the signals, but this threw me off. It looks like you took a long trade at almost the same time. Is that right? 10:34 eastern time. Anyway, thanks for this thread and your advice. It is extremely helpful and is very compatible with my trading style.
Quote from Jaxon:
took one trade this morning - it was nearly a perfect setup, I was seeing lower highs, lower lows, but i shorted too close to the bottom of the bar and got stopped out almost instantly.... by a higher high! The market then continued its downtrend. I know I can't let stuff like that bother me and must keep trading and taking the signals, but this threw me off. It looks like you took a long trade at almost the same time. Is that right? 10:34 eastern time. Anyway, thanks for this thread and your advice. It is extremely helpful and is very compatible with my trading style.
Quote from Anekdoten:
Razor,
Magnifying glass is on !
I'll be watching
Triangle action NQ (11:17 est)
My two trades so far today.
#1) got in on what looked like a change in trend upwards (due to such a strong
upward move before the pullback- figured the down trend was over)....guessed
right...
#2) Took a pullback to a trendline after the trendline break....guessed right
again
Negatives, stops were 3 - 3.5 points on these trades and they only went for
+1.25 and +2.75 so stops were set bigger than actual gains....need to improve on
this.
Here they are:
http://i15.tinypic.com/4zoc4js.png
http://i14.tinypic.com/4vgmi6v
Cheers ![]()
Trades 07-31-07
Today it's a lesson on why it's important to stay neutral and trade only what
you see. It's imperative to ride those winners when possible. HA Bars are very
helpful in this area.
Again, its not about being right, it's about making money. Not the case today
but if I lose 5 times and win 3 and at the end of the day I'm green, job well
done.
4 Longs
1st Home Run ridden with HA bars
2nd Stopped out for minor gain
3rd Stopped out
4th Stopped out
4 Shorts
1st Based on double top, monstrous gain like most double tops should be played
2nd Target barely reached as a double bottom formed
3rd Home Run ridden with HA bars
4th Home Run ridden with HA bars
Notice how the doubletop/doublebottom area led to chop suey. That's my signal to
stay on the sidelines.
Total
5 Winners
1 Break even
2 Losses
Extremely profitable day and very pleased with my discipline and trading. Off to
a break then I will come to the pending posts.
Anek
Razor,
It's interesting that you chose the worst possible area to trade. Precisely the
one I stood on the sidelines, massive congestion.
I circled evidence of confusion and marked all the short opportunities with the
arrow that you had.
Hope it helps.
Quote from Anekdoten:
Razor,
It's interesting that you chose the worst possible area to trade. Precisely the one I stood on the sidelines, massive congestion.
I circled evidence of confusion and marked all the short opportunities with the arrow that you had.
Hope it helps.
Razor,
Remember that after MASSIVE moves, uncertainty usually unfolds.
It's actually a powerful tip ![]()
Hope it helps.
Anek
Anec, Here is my chart for the day. First 4 trades stopped out. Afternood was ok though. What would have kept you from the first 2 trades? The 3rd and 4th were just trying to re-enter using a tight stop. The stop I used on 20 tick charts is just too tight on the 75 tick (= to your 200). Any comments appreciated.
here is file, I hope.
Sorry, Chart not attaching!
chart?
Different file type. Try again
Anek,
I'm very new to futures trading; however, I've traded stocks and options for
years. In another post, someone mentioned you traded in the "puretick" room. Is
that where you learned to trade? Would it be worth my time to get an education
in one of the paid rooms? If so, which one would you recommend?
Thanks,
Tyler
B,
Not a bad job. This requires certain practice skill so definitely a good start.
Remember to use HA bars to let the winners run, this allows you to keep accuracy
below 50% with comfort.
Attached some opportunities I see in your chart.
Quote from tv92670:
Anek,
I'm very new to futures trading; however, I've traded stocks and options for years. In another post, someone mentioned you traded in the "puretick" room. Is that where you learned to trade? Would it be worth my time to get an education in one of the paid rooms? If so, which one would you recommend?
Thanks,
Tyler
The Titanic called, it just saw the YM underneath the sea. Man, they are
selling it hard. (Around 200 in AH)
Too bad I suck at swing trading ![]()
Anek
Quote from Razor:
Seems like I am having a mental block in believing that everytime I am about to get on the trend the trend is about to end so I am always looking to get right in on the start of the next trend....not sure how to over come this....will keep plodding ahead I guess...
Thanks for the feedback !
My two afternoon trades:
So 3 wins today and 1 loss but I don't think I did the system much justice.
Anek, if you get a chance please provide input on these two afternoon trades.
Red line short entry, green line cover exit on both.
Cheers ![]()
http://i11.tinypic.com/53sk37b.png
http://i10.tinypic.com/4l95xms.png
Razor,
On your first screenshot the short is simply a stop out, no escape there, it
reversed and you take your loss. However, since you didn't short the ones that
did work, you end up losing money for not being on top of the trend. Sooner or
later they all reverse, unless it's one of those massive trending days.
On your second screenshot, I'm not sure why you took that one. Can't see the
reason.
I marked congestion with a circle.
Double Bottoms/Tops with horizontals.
Arrows indicate other good places to enter.
Anek
And the second file....
anek, what broker do you suggest for futures simulation? thanks
Quote from dazed101:
anek, what broker do you suggest for futures simulation? thanks
Quote from dazed101:
anek, what broker do you suggest for futures simulation? thanks
Supposedly AHG had $17bln in borrowings, so the question is who is left holding that paper that likely is now worthless.
__________________
"Dip buying has been consistently rewarded lately and it doesn't much matter
what caused the dip."
Quote from makloda:
Supposedly AHG had $17bln in borrowings, so the question is who is left holding that paper that likely is now worthless.
Quote from Anekdoten:
Notice how the doubletop/doublebottom area led to chop suey. That's my signal to stay on the sidelines.
Anek [/B]
Quote from hulkgogan:
Hi FYI, the chop suey in your chart was actually forming a wolfwave. Given the approriate context, quite a reliable pattern.
Oops, sorry wrong symbol
Quote from Anekdoten:
Think you got the wrong thread Mak
Anek
__________________
"Dip buying has been consistently rewarded lately and it doesn't much matter
what caused the dip."
Calling it a day. Good morning for me.
Quote from pkts:
If you want to simulate during live trading you can get Interactive Brokers and use something like Bracket Trader or Ninja Trader. But you really just need the data.
If you want to trade after the market you need to buy the data from Esignal or Ensign etc.
Good luck.
For sim,I use unarmed book trader,just don't forget it's on/off.(IB)This also gives you good idea of how fast fills are,and the actual mechanics/making a trade.Great thread.Thanx.
__________________
johhny red
I traded the DIA today because I don't have a futures account open (yet),
strictly according to AHG. I traded 500 shares to simulate 1 contract and my
results: 2.91 pts and 4/5 WL. I'll take it! Note: 1.71 pts came on the last
trade of the day...I picked a good day to start
Tyler
Had a nice day as well, did +$228. Have to believe though that things will become much harder when the moves become smaller and ranges tighter....this will be the days to see how really disciplined one can be.... ;)
Trades for 08.01.07
I'm exhausted, I did not sleep all night by the massive afterhour/pre-market
move activity that was hard to ignore.
After the market closed I had to take a 3 hour nap so I apologize that this
chart is getting to you a little later than usual.
However, on a positive note, I was in perfect sync with the market today. I
annotated little hints that price gives us that might indicate a possible
reversal or choppy move. Whenever I saw things like that I made an effort to
stay on the sidelines.
Massive profits today, more like obscene. These hard strong moves are a gift
from the gods.
Tip of the day: Make an effort to spot possible reversals/choppyness by watching
erratic highs/lows.
Longs
6 for 6
No losers
Shorts
7 for 7
No losers
Total
13 for 13
(Notice the lack of bias, roughly half and half)
Don't despair, keep on using that sim. Your skill will ONLY get better. Learn to
spot the chop, it will save you AND make you money.
Keep on practicing, keep on reading, keep on noticing how those lows and highs
develop. Don't give up. If I can do it, you can do it.
Hope it helps.
Anek
PS: 199 Tick Chart, don't ask ![]()
Glad to hear you some of you guys did well.
Remember, you are JUST beginning to get your feet wet, assuming my style of
trading is new for you.
I promise you, your skill will ONLY get better.
If you keep your discipline and your money management in check it's only a
matter of time until you can mimic my performance and in many cases I'm sure,
surpass it.
Keep it simple and you will prevail.
Anek
Anek's Big Rule of 3
1) Spot the Trend, it is your ONLY friend.
Up, Down, Sideways, All over the place ? Only up or down interests us. Odds in
our favor.
2) Spot the Entry
Do we have one ? Should we have one ? Use your tools for confirmation, not the
other way around.
Your eyes go 90% of the time on price. Specifically on those highs and lows.
3) Spot the Chop
This kills us and reverses us. No one is forcing you to trade as the market is
always there.
Anek
I'm happy to see you were able to catch that big move at the close. I work
during the day, so I only get to watch the market during RTH when I can steal a
few minutes here and there, but happened to watching price action during that
monster swing during the last 30 minutes and I was hoping you and some of the
other kind folks here on ET were riding that puppy up.
Thanks again for your generosity in posting these trades over the past couple of
weeks. Your posts have inspired me! My trading approach (albeit on a simulator
for now) is becoming much more simple and effective.
Congrats Anek and thanks again for post !
Quote from mikehbeck808:
I'm happy to see you were able to catch that big move at the close. I work during the day, so I only get to watch the market during RTH when I can steal a few minutes here and there, but happened to watching price action during that monster swing during the last 30 minutes and I was hoping you and some of the other kind folks here on ET were riding that puppy up.
Thanks again for your generosity in posting these trades over the past couple of weeks. Your posts have inspired me! My trading approach (albeit on a simulator for now) is becoming much more simple and effective.
Quote from Razor:
Congrats Anek and thanks again for post !
I'm getting a LOT of questions on stops.
ie "Anek, what kind of stops do you use".
Here is the answer to one PM I just replied to, figure it can help some of my
friends so posting it here.
...........
Notice how I use stochastic crossing for entries. I feel that the
stop should be large enough to handle noise and not much else. Since
you are using the SIM I will let you be the judge of this.
It's very dependent on the type of trader, the better your
aim/precision the smaller your stop will get in time.
Start with 12-15 and adjust accordingly. No need to rush, polish those skills.
Good to hear from you.
..............
Bottomline is that as you get more experienced your entries will be more
optimal. For now, stay on the sim and you be the judge of what your entries
require.
You need just enough to handle noise, anything else and it's prob not the type
of trade you should be taking.
Aside from recognizing the current trend or lack of this is probably the most
critical area of my method. Unfortunately, it is extremely dependent on entry
and the trader. Use sim to take statistics.
For instance....
- What do the good trades usually need based on my entries ?
- Will a bigger stop had made this losing trade a winning one ? Is it worth it
based on my targets ? Will I be deviating from the initial premise to take the
trade ?
You need to ask yourself these questions and take notes. Very important.
I will rather pass on a trade that requires a big stop than take it. As a last
resort, minimal car size then. In the end, if you miss it, so be it, odds are
that the next day, market is there waiting for you to try again
![]()
It's a risk management game.
Anek
Excellent info, thanks Anek ! ![]()
Quote from Anekdoten:
I'm getting a LOT of questions on stops.
ie "Anek, what kind of stops do you use".
Here is the answer to one PM I just replied to, figure it can help some of my friends so posting it here.
...........
Notice how I use stochastic crossing for entries. I feel that the
stop should be large enough to handle noise and not much else. Since
you are using the SIM I will let you be the judge of this.
It's very dependent on the type of trader, the better your
aim/precision the smaller your stop will get in time.
Start with 12-15 and adjust accordingly. No need to rush, polish those skills.
Good to hear from you.
..............
Bottomline is that as you get more experienced your entries will be more optimal. For now, stay on the sim and you be the judge of what your entries require.
You need just enough to handle noise, anything else and it's prob not the type of trade you should be taking.
Aside from recognizing the current trend or lack of this is probably the most critical area of my method. Unfortunately, it is extremely dependent on entry and the trader. Use sim to take statistics.
For instance....
- What do the good trades usually need based on my entries ?
- Will a bigger stop had made this losing trade a winning one ? Is it worth it based on my targets ? Will I be deviating from the initial premise to take the trade ?
You need to ask yourself these questions and take notes. Very important.
I will rather pass on a trade that requires a big stop than take it. As a last resort, minimal car size then. In the end, if you miss it, so be it, odds are that the next day, market is there waiting for you to try again
It's a risk management game.
Anek
AHG tough today... 2/5 on the DIA +.21. Could've done better if I had tried
to really scalp, but instead I tried to ride the microtrends and would end up
getting stopped. Oh well, at least it was a positive day in a choppy market.
Tyler
Hi,
Only 3 trades here NQ, 2 winners but small.....ended up +$36 on the day, better
than a loss ![]()
Trades for 08-02-07
Tough day, chop land until the later afternoon. Moves were not as strong as
yesterday, except late afternoon.
If you broke even, had small losses or small wins today, give yourself an
applause.
If you made money, you are getting it and I'm proud of you. Means you are
trading with caution and taking only what should be taken, or most of it.
Longs
1st Winner
2nd Winner
3rd Loser full stop
4th BE
5th Winner
6th Loser full stop, bad stop fill too!
7th Grand slam !
8th BE
Shorts
1st Winner
2nd BE
3rd The one i forgot to mark with the vertical line, full stop
4th Winner
5th BE
6th Winner
7th Winner
8th Winner
9th Full stop
Total
9 Winners
4 Losers
4 BE, due to commissions I will count as 1 full Loser
...so 9 Winners and 5 Losers
Circles identify chop evidence. Funny how yesterday I spoke so much about the
chop, i guess I was expecting it after so many strong move days.
Exercise for today, work on spotting the chop on today's chart, yes, again
![]()
Hint of the day: Study stoch crosses with the trend, check my entries
![]() It's a good indicator, fast too,
just need to know WHEN to take those crosses. They don't always help, obviously.
It's a good indicator, fast too,
just need to know WHEN to take those crosses. They don't always help, obviously.
Real tough day unless you had full focus of those highs and lows.
Anek
Guys and Gals,
I would like to talk about Winners and Losers.
There are only five possible outcomes in trading.
1-)Big Losses
2-)Small losses
3-)Big Winners
4-)Small Winners
5-)Break even
Stay away from the first one and the rest will EMBRACE you.
When the system fails to produce profits it is probably because the market had
no direction and nothing but reversals. When this happens you WILL have a losing
day even if following the system.
We have yet to see this but when it comes I will most likely post a losing day.
However, it will most likely fall in the small losses category and that is what
is all about.
Remember....
If there are no 2 higher lows and no 2 higher highs, it's not an uptrend.
If there are no 2 lower lows and 2 lower highs, it's not a downtrend.
Don't anticipate (yet), stick to the plan.
Stay with the plan, work on those skills, this is good stuff.
Those that has seen me trade live know what I can do. This is most of what I do,
nothing else, no magic, no tricks. And last but not least, I'm giving you the
tools, the samples, the manual on how to do it.
Stay disciplined, practice, and help me make a great thing better.
Let me see you work on those skills, show me that you can do it, I ask for
nothing else in return.
Anek
Thanks Anek for the continued motivation and info, hugely appreciated.
As a note I have been trading with a completely blank chart accept for price
bars and heiken bars. I will draw in fibs and trendlines at times but that is
it, zero indicators. Do you recommend putting on the stoch and using that for
entries or if I am breakeven / winning small for right now then try and learn
with price only ?
Cheers,
Ray ![]()
Quote from Anekdoten:
Guys and Gals,
I would like to talk about Winners and Losers.
There are only four possible outcomes in trading.
1-)Big Losses
2-)Small losses
3-)Big Winners
4-)Small Winners
5-)Break even
Stay away from the first one and the rest will EMBRACE you.
When the system fails to produce profits it is probably because the market had no direction and nothing but reversals. When did happens you WILL have a losing day.
We have yet to see this but when it comes I will most likely post a losing day.
However, it will most likely fall in the small losses category and that is what is all about.
Remember....
If there are no 2 higher lows and no 2 higher highs, it's not an uptrend.
If there are no 2 lower lows and 2 lower highs, it's not a downtrend.
Don't anticipate (yet), stick to the plan.
Stay with the plan, work on those skills, this is good stuff.
Those that has seen me trade live know what I can do. This is most of what I do, nothing else, no magic, no tricks. And last but not least, I'm giving you the tools, the samples, the manual on how to do it.
Stay disciplined, practice, and help me make a great thing better.
Let me see you work on those skills, show me those profits, I ask for nothing else in return.
Anek
Razor,
I recommend that you find one and only one tool to help you find optimal
entries.
It is IMPERATIVE that you keep it simple or you will lose focus.
I use stochastic crosses when I feel a trend has been determined with an
opportunity to enter with low risk. You can clearly see this on my charts, on
most anyway.
I use Heikin Ashi to adjust my trailing stops/targets or otherwise known as
riding the winners.
I use trendlines to gauge the big picture and Fibonacci for prediction.
As it is now, I don't recommend much else. However, if any reader has found a
tool to enhance the system by all means, share it and I will promise to test it.
If it helps I will not only thank you but will use it and recommend it.
Anek
Ok this question merits it's own post.
How do you feel about averaging down ?
I feel it's the devil, and you should never ever do it. It's a recipe for
disaster and I recommend everyone following my system to stay as far away from
it as you possibly can.
Hope I'm 100% clear on this.
Anek
Anek,
Wondered if you might make a few notes on my attached chart. Last two days I
have gotten run over picking up nickels infront of an Exxon tanker truck.
Shorted one rally too many, last hour especially turned a profitable day into a
loss.
Shorted rallies..even though it seemed like a congestion pattern.
Thanks mate!
Quote from anvil993:
Anek,
Wondered if you might make a few notes on my attached chart. Last two days I have gotten run over picking up nickels infront of an Exxon tanker truck.
Shorted one rally too many, last hour especially turned a profitable day into a loss.
Shorted rallies..even though it seemed like a congestion pattern.
Thanks mate!
Quote from Anekdoten:
Anek's Big Rule of 3
1) Spot the Trend, it is your ONLY friend.
Up, Down, Sideways, All over the place ? Only up or down interests us. Odds in our favor.
2) Spot the Entry
Do we have one ? Should we have one ? Use your tools for confirmation, not the other way around.
Your eyes go 90% of the time on price. Specifically on those highs and lows.
3) Spot the Chop
This kills us and reverses us. No one is forcing you to trade as the market is always there.
Anek
Quote from Stealth Trader:
I came across this thread last night and have been scanning through the posts. What you are doing is remarkably similar to my method. So much so, if I didn't know better, I'd say someone has been looking over my shoulder!
Main differences are I don't use any indicators, although I did spend years trying prove their worth. I simply found I could trade better without them. In addition, I use regular OHLC bars set to constant volume data and monitor market internals for strength of trend. To me, HA distorts the price action, especially on reversal pattern bars, which is my mainstay for entries and stop placement.
All in all though, your method and mine are built on the same principle of HH/HL/LH/LL's. As such, I thought I would drop by and applaud you for sharing a very simple, yet quite lucrative style of extracting money out of the markets each day. I'm always amazed as to how few traders grasp the concept of price action being the closest thing to the holy grail they will ever encounter. People like you are far and few between, and those following your thread will be well served if they decide to follow the generous sharing of your wisdom. Well done, sir!
Regards,
st
Quote from Anekdoten:
ST,
Thank you for the kind words, I will study your suggestions in detail considering you trade using a similar approach.
Appreciate the input.
Anek
Quote from Stealth Trader:
No suggestions intended, just comparing the slight differences.
Keep doing what works for you.
st
Whew! Ended up a few points, but only from luck. Quite disapointed with my stop setting today, and not taking profits at resistance/support levels on such a range day. Kept holding them waiting for that rocket blast. Good to hear Anec's comments, makes me feel a little better.
Quote from bmwhendrix:
Whew! Ended up a few points, but only from luck. Quite disapointed with my stop setting today, and not taking profits at resistance/support levels on such a range day. Kept holding them waiting for that rocket blast. Good to hear Anec's comments, makes me feel a little better.
Quote from Anekdoten:
I'm really happy you posted, gives extra encouragement to those following me that this approach is a good starting point for winning on a consistently basis.
As far as the HA bars I use them for the runners not for the entries. In that respect I find them valuable but I do see what you meant, for entries they are most definitely counter productive. They go red when you should be looking to go long hehe
Anek
Anek,
Thanks for the notes on the XOM chart, AHG v1 LL/LH paid off today...+485.
Quote from anvil993:
Anek,
Thanks for the notes on the XOM chart, AHG v1 LL/LH paid off today...+485.
Lower lows lower highs I see longs around this time of the massacre and Im
cracking the whip ![]()
Loving it !
Anek
4 trades, Net $28 ![]()
3 winning days in a row but something tells me I should have done much better
than this....still having the mental block that when I get in the trend will
end.....so silly because of course this will happen sometimes but will it happen
greater than 50% of the time, doubtful.....that should be all that matters if I
book bigger gains than loses.....oh well, a new week awaits us
![]()
Have a good weekend all and thanks again Anek !
Same here. Up for the week. Gotta follow Anec's advice more closely, especially regarding using only 1 indicator. Trying to use others as filters really does create confusion in my little mind. Confusion leads to hesitancy, hesitancy leads to bad entries/exits which lead to losses, which lead to confusion.....
Trades for 08.03.07
Hard to type with the current excitement. I get goosebumps on days like today.
Anyway, enough chit chat, to the details.....
Evidence of congestion in circles on chart attached.
Longs
1st Winner
2nd *A MISTAKE* there was a lower high, stochs were crossing down. I have no
idea what I was thinking. Closed it for BE as soon as I noticed my mistake.
Whenever you make an obvious mistake close the trade ASAP don't even think twice
about it.
3rd Stopped out
4th Stopped out
1 Winner
2 Losers
1 BE
Total: 1 for 2
Geez, think longs were not working well today, no real structure. I wonder why
![]() Let's switch to the dark side,
shall we?
Let's switch to the dark side,
shall we?
Shorts
1st Winner
2nd Winner
3rd Winner
4th Stopped out
5th Winner
6th Winner
7th Winner
8th Stopped out
9th Stopped out
10th Grand Slam
11th Grand Slam
12th Grand Slam
3 Losers
9 Winners
Total: 10 Winners 5 losers 1 BE
Notice all the losers I had. Do I care ? Do they bother me ? Do I feel bad ?
To be blunt, I don't care, I expect them and I don't fear them as I know how to
control them. You lose, you stand up, and you fight back, over and over again.
Because you believe in yourself, in your trading, in your system.
Win some, lose some, just like a champion in boxing, at the end of the fight,
what you want is the decision, not perfection. You can shoot for perfection, but
lets be realistic.
What can I say, I love days like today, I trade for days like today.
They are special and extremely profitable if you just follow the trend. God
knows how many contrarians called bottoms during the hard slam down, and hard it
was!
Best summer I've witnessed, they are usually dull this is far away from it. This
is wonderful, this is just like heaven!
Anek
Quote from bmwhendrix:
Same here. Up for the week. Gotta follow Anec's advice more closely, especially regarding using only 1 indicator. Trying to use others as filters really does create confusion in my little mind. Confusion leads to hesitancy, hesitancy leads to bad entries/exits which lead to losses, which lead to confusion.....
Quote from Razor:
4 trades, Net $28
3 winning days in a row but something tells me I should have done much better than this....still having the mental block that when I get in the trend will end.....so silly because of course this will happen sometimes but will it happen greater than 50% of the time, doubtful.....that should be all that matters if I book bigger gains than loses.....oh well, a new week awaits us
Have a good weekend all and thanks again Anek !
Cheers Anek for the response.....I guess I just need more time, I think the
reason I am having the mental block is becuase the markets have been so
'trending' with great follow through the last couple of weeks and I think I am
telling myself that when we get back to tighter ranges that I will be getting
whip sawed over and over again as just when a trend looks like it is forming we
head back the other way.....I think after I trade through some periods like this
and see that it is still possible to have a breakeven / small winning day during
these times and still book some big win days 2 - 3 days per week that maybe the
mental block will lift.....only time will tell....anyway, my head is up and I am
plodding ahead ![]()
Quote from Anekdoten:
I know EXACTLY what you mean, I know cause I've been there in the past.
It's hard to get long when the immediate price action is down but if the trend that matters is up, then bigger picture should win, no?
Study past charts, you have MASSIVE samples at hand. Convince yourself that it's the right way to go, then and only then is that you will have enough faith to pull the trigger comfortably when the time comes. Don't let losses misguide you, they are inevitable, but if you do it right I promise you, you win at the end.
Examine my trades. Am I doing something different than described in the original AHG post ?
Am I somehow bending the rules ?
You tell me!
Anek
Razor,
Take all the time that you need, I mean it. No sense in rushing this.
BTW, when we get a massive day of consolidation the trick is to say....
"No 2 lower highs, no 2 lower lows, I'm staying put."
"No 2 higher highs, no 2 higher lows, I'm staying put"
Sometimes the best trade is no trade.
....and when they do happen if it reverses you, so be it, take your small loss
and move on.
However, statistically speaking, trend patterns outnumber reversals so in terms
of numbers you win at the end ![]()
And guess what, if the reversal is strong enough, you will be there riding it
too !
As you say, Cheers! ![]()
Anek
Makes perfect sense ! ![]()
Now go enjoy your weekend ! ![]()
Cheers,
Ray ![]()
Quote from Anekdoten:
Razor,
Take all the time that you need, I mean it. No sense in rushing this.
BTW, when we get a massive day of consolidation the trick is to say....
"No 2 lower highs, no 2 lower lows, I'm staying put."
"No 2 higher highs, no 2 higher lows, I'm staying put"
Sometimes the best trade is no trade.
....and when they do happen if it reverses you, so be it, take your small loss and move on.
However, statistically speaking, trend patterns outnumber reversals so in terms of numbers you win at the end
And guess what, if the reversal is strong enough, you will be there riding it too !
As you say, Cheers!
Anek
Quote from Anekdoten:
Trades for 08.03.07
Hard to type with the current excitement. I get goosebumps on days like today. Anyway, enough chit chat, to the details.....
Evidence of congestion in circles on chart attached.
Longs
1st Winner
2nd *A MISTAKE* there was a lower high, stochs were crossing down. I have no idea what I was thinking. Closed it for BE as soon as I noticed my mistake. Whenever you make an obvious mistake close the trade ASAP don't even think twice about it.
3rd Stopped out
4th Stopped out
1 Winner
2 Losers
1 BE
Total: 1 for 2
Geez, think longs were not working well today, no real structure. I wonder why
Shorts
1st Winner
2nd Winner
3rd Winner
4th Stopped out
5th Winner
6th Winner
7th Winner
8th Stopped out
9th Stopped out
10th Grand Slam
11th Grand Slam
12th Grand Slam
3 Losers
9 Winners
Total: 10 Winners 5 losers 1 BE
Notice all the losers I had. Do I care ? Do they bother me ? Do I feel bad ?
To be blunt, I don't care, I expect them and I don't fear them as I know how to control them. You lose, you stand up, and you fight back, over and over again. Because you believe in yourself, in your trading, in your system.
Win some, lose some, just like a champion in boxing, at the end of the fight, what you want is the decision, not perfection. You can shoot for perfection, but lets be realistic.
What can I say, I love days like today, I trade for days like today.
They are special and extremely profitable if you just follow the trend. God knows how many contrarians called bottoms during the hard slam down, and hard it was!
Best summer I've witnessed, they are usually dull this is far away from it. This is wonderful, this is just like heaven!
Anek
Nice Stealth,
One thing about the ES as well.....it can handle huge size with minimal
slippage, freakin NQ slips a tick on 1 contract in fast markets....sucks but for
now it is the cheapest per point mover out there until I can build consistency.
Thanks for the chart ![]()
Quote from Stealth Trader:
If you should be interested, here is a marked chart of what I was looking at today.
st
Stealth,
I see the similarities, no doubt. Good trades.
Razor,
The days of the YM and I are numbered but since it was the first e-mini I ever
traded it's hard to let go.
Have not decided yet if I'm going to ES or NQ. Definitely not to ER2 with the
upcoming transition from CME to ICE.
Anek
Quote from Razor:
Nice Stealth,
One thing about the ES as well.....it can handle huge size with minimal slippage, freakin NQ slips a tick on 1 contract in fast markets....sucks but for now it is the cheapest per point mover out there until I can build consistency.
Thanks for the chart
Go grab a beer man ! LOL, seriously, I am on my way out for a beer or two but
if you want to build real size ES is the ticket IMHO (but then again what do I
know ![]()
Cheers ![]()
Quote from Anekdoten:
Stealth,
I see the similarities, no doubt. Good trades.
Razor,
The days of the YM and I are numbered but since it was the first e-mini I ever traded it's hard to let go.
Have not decided yet if I'm going to ES or NQ. Definitely not to ER2 with the upcoming transition from CME to ICE.
Anek
Hi Stealth,
Your experience and input is welcome here I am sure, please keep posting and
your points are noted regarding getting stuck on one particular emini.....a
question I have though....
.....if one is and has been consistently profitable for a while why not trade ES
and over time build contract size....why stay at 10 etc ?.....I mean from what I
have read one can do 100 - 300 ES contracts a time with 1 tick slippage ? Sounds
like a lot of cars but if one is consistently profitable and account is building
even with withdrawls why not add contracts over time ?....just a thought, ok I
am off now for a couple brews ![]()
Quote from Stealth Trader:
I don't trade huge size, about 10 is my limit. I was trading the ER exclusively up until about three weeks ago, but the recent volatility within it was placing my stops too far out for my rules. One thing I might mention is to continuously compare different contracts with each other and trade the one that currently gives the best bank for the buck . Many people become married to a certain contract, when in reality, they can and do change in the way they trade.
I am not going to rain on Anec's thread.
I just wanted to share what I am doing and how close his method is to mine. I've been involved in the markets close to 30 years, and he is the first here on ET that I believe actually has a clue. Of course, I am a bit biased!
st
The drinks are ready Belhaven's Stout is what I like. However, got my kids
all over me playing anything from Nintendo Wii to Xbox 360 so I'm playing with
my journal as they develop their "skills" in video games.
Once they hit the sack, I will surely start the weekend with an "up" note as I
examine charts ![]()
Definitely welcome Stealth and anyone else with positive thinking into the
journal. Companionship, friendship, education, sharing and good times is what
it's all about.
Off to kick some butt in Viva Piñata!
Anek
Anek,
Regarding your 3rd Short trade today, I noticed you took it after only one LL
and one LH. Was this a mistake or do you sometimes take this kind of trade
rather than wait for the stated two LL's and two LH's?
Stealth, your comment on Anec is right on. I have played around for about 20
years with trading as a hobby. Now becoming serious, and I fully appreciate the
what Anec is doing. Very rare indeed.
Anec, On the first congestion area you circled today, it looks like there were a
couple of trades that I might have been sucked into.
What Kept you out. Hope the chart attaches.
Quote from AlpineTrout:
Anek,
Regarding your 3rd Short trade today, I noticed you took it after only one LL and one LH. Was this a mistake or do you sometimes take this kind of trade rather than wait for the stated two LL's and two LH's?
Stealth, It appears you must be using about a 200 tick chart or minute
equivalent. At least that is what is seems to be on my IB data feed which is not
true tick. And given that time frame it looks like stops might be up to 30
points. Is that about right?
But with runs like that last short, who cares!. Thanks for posting.
Quote from bmwhendrix:
Anec, On the first congestion area you circled today, it looks like there were a couple of trades that I might have been sucked into.
What Kept you out. Hope the chart attaches.
Stealth, I also use ensign, could you please explain what function was used to create the LL,LH,HH,HL notations on the chart. Thank You, Dave.
*Upcoming Change*
----------------------
Starting next week I am officially moving to the ES.
It might take me sometime to adjust but better now than later.
YM liquidity and bad fills are getting on my nerves lately. I had a few stop
market orders today that got filled for 4 tick against me. Simply not acceptable
anymore.
Have not decided which tick size or volume bar size I will proceed with but I
guess I will know soon.
Officially I'm saying my farewell to the YM unless the ES spanks me in ways that
do not excite me ![]()
Anek
I am reading your logs..wonderfull work.
If somebdy can hele in duplicating stochastic like you hav done on your chart. I
am using Qouetracker and unable t create simmilar thing. i have ayed with lot of
there setup ut dosn't replicate your setup.
One more thing , i am also watching for blck tades and tick hook along with the
signal generated from AHG system.
I think stochastic and MACD combined are great tool, if you have patience.
Still debating should use 199 tick or 89 tick chart.
Thanks again to Anekdoten for a generous and helpful thread. Regarding the
stochastics question from billdobson1972, I am sure the charts that have been
posted are from Tradestation and their feed. Judging from your question, you may
be using Quotetracker with another feed, probably Interactivebroker (IB) ?
Please note that IB is not a tick by tick feed, so that on a tick chart, it will
sometimes look very different between QT/IB than TS or other true tick based
feed. Here is the TS inputs for slow stochastics :
code:
inputs: PriceH( High ), PriceL( Low ), PriceC( Close ), StochLength( 14 ), SmoothingLength1( 3 ), { used to slow FastK to FastD = SlowK } SmoothingLength2( 3 ), { used to slow FastD to SlowD } SmoothingType( 1 ), { pass in 1 for Original, 2 for Legacy } OverSold( 20 ), OverBought( 80 ) ;
thanks for your help
I am still studying and as of now i am using etrade..i am planning to switch to
IB. I will be looking at markets only from 9.30 - 10.30 and again from 1 p.m -
3.0 p.m... will be making very few calls ...less than 2 trade /day.. thats my
goal...
One of the guys in this thread posted a very good chart which shows the latest
swing high or swing low ..now i am trying to develop paintbars for that logic..
I also find ticks/Trin/intermarket relationship/ Block trades(trades gretaer
than 200K on spy) to be very good tells...
this is a great approach ..need to fine tune the entry & exit - so market
internals grasp would make or break this system
Awesome news ! All the best and just imagine what you can achieve when you
groove with the ES and build those contracts 20, 30, 50, 100, 300 .... :-)
Cheers ![]()
Quote from Anekdoten:
*Upcoming Change*
----------------------
Starting next week I am officially moving to the ES.
It might take me sometime to adjust but better now than later.
YM liquidity and bad fills are getting on my nerves lately. I had a few stop market orders today that got filled for 4 tick against me. Simply not acceptable anymore.
Have not decided which tick size or volume bar size I will proceed with but I guess I will know soon.
Officially I'm saying my farewell to the YM unless the ES spanks me in ways that do not excite me
Anek
I have been contemplating starting a journal for a couple of weeks now called "Old Fashioned Trading" or something similiar and then I ran across this thread and see that you have already done it. Our trading approaches are almost identical except that I am still using time bars. Pullbacks in a trend, double bottoms and double tops. What else do you need? I use only trendlines and a couple of moving averages although I have used the stochastic off and on. I have seen you mention 50% fib retracement and sto crossover as an entry. Which one are you using now? I am also wondering if you have taken anything from Proflogic as theres a lot of parallels. In any case I would like to join in the discussion. Great thread. A rarity on this board.
Just a word on this if this if it's an index system . Not sure how many
trades it takes, and if it's base on charts only, but BEWARE !
Il will say this: TA on intraday charts is pretty much worthless and in the
current market forget it . You've got to have something else than TA alone to
even have a chance to survive.
Daytrading on TA (S/R, patterns, oscillators have they ever worked as
standalone?) is DEAD ! There is nothing there. A couple of years ago yeah you
could make money more than 50% of the time if you were really good.
Don't waste your time trading intraday and don't dream about making it as a
homebased daytrader. It's the biggest pipe dream/ scam invented by the brokerage
industry.
__________________
"Nobody can catch all the fluctuations"
Reminiscences of a Stock Operator
Wow. Pretty broad generalizations. Obviously youve had some bad experiences
in the past. I completely disagree with your comments but I'm sure it will do
nothing to change your opinion. Live and let live is my motto.![]()
Kicking,
Beautiful, just what these guys need, a typical vile ET comment.
Pretty negative sentiment you got there considering all these weeks I've been
describing how to squeeze profits from the market on a daily basis.
Most daytraders fail, I give you that. If you are on the 95% group perhaps you
should be listening to the 5% and learn instead of staying a non believer for
life.
Basically you are saying that 100% of daytraders lose money in the long run.
Or maybe just maybe, you are simply in the 5% and are afraid that someone in
your group simply wants to help!
How about you prove me wrong instead of dumping absurd generalizations on my
journal ?
Anek
Quote from Kicking:
Just a word on this if this if it's an index system . Not sure how many trades it takes, and if it's base on charts only, but BEWARE !
Il will say this: TA on intraday charts is pretty much worthless and in the current market forget it . You've got to have something else than TA alone to even have a chance to survive.
Daytrading on TA (S/R, patterns, oscillators have they ever worked as standalone?) is DEAD ! There is nothing there. A couple of years ago yeah you could make money more than 50% of the time if you were really good.
Don't waste your time trading intraday and don't dream about making it as a homebased daytrader. It's the biggest pipe dream/ scam invented by the brokerage industry.
Welcome aboard Gary.
I don't use anything else besides what has been described in the journal. In
fact, I've been slowly trimming down the charts. Would not be surprised if soon
I end up just using price action indicators like support/resistance, hh/lh/ll/hl
pivots with trendlines and nothing else.
Anek
Quote from GaryN:
I have been contemplating starting a journal for a couple of weeks now called "Old Fashioned Trading" or something similiar and then I ran across this thread and see that you have already done it. Our trading approaches are almost identical except that I am still using time bars. Pullbacks in a trend, double bottoms and double tops. What else do you need? I use only trendlines and a couple of moving averages although I have used the stochastic off and on. I have seen you mention 50% fib retracement and sto crossover as an entry. Which one are you using now? I am also wondering if you have taken anything from Proflogic as theres a lot of parallels. In any case I would like to join in the discussion. Great thread. A rarity on this board.
Quote from billdobson1972:
I am reading your logs..wonderfull work.
If somebdy can hele in duplicating stochastic like you hav done on your chart. I am using Qouetracker and unable t create simmilar thing. i have ayed with lot of there setup ut dosn't replicate your setup.
One more thing , i am also watching for blck tades and tick hook along with the signal generated from AHG system.
I think stochastic and MACD combined are great tool, if you have patience.
Still debating should use 199 tick or 89 tick chart.
"Simplicity is the ultimate sophistication".
There are plenty of wornout threads on the timeworn topic on whether or not TA
works...this isnt one of them; lets keep our eye on the AHG ball and its
continued development.
Anek, Good response to the neysayer. I was wondering how long it would take
them to stick their heads up.
On eliminating the sto for an indicator, I do not know if this would be an
improvement, but I find that years of viewing the sto as an ob/os indicator
still influences my being able to use it strictly as a crossover instrument for
entries. I'm sure you have looked at everything many times, but I'm kind of
liking the use of just a 10 period sma. Using a close over the sma as an entry,
if the HH/LL business is all in order. Keeps my subconscious from saying "Hey
Don! You can't buy this crossover!, The sto is at 85, way overbought!, Odds must
be against it!" Takes a long time to undo bad trading habits and concepts. Sure
makes a clean chart too. Spooky clean!
Quote from Razor:
Awesome news ! All the best and just imagine what you can achieve when you groove with the ES and build those contracts 20, 30, 50, 100, 300 .... :-)
Cheers
B,
I study the stochastic crosses and been slowly paying less attention to its
oversold/overbought signals. Sometimes I pay attention to divergences but I
should not as I don't believe they are that solid signals. Yep, a little
confused there myself.
You don't need to use MA crossovers if you keep those eyes (assuming you got
two) ![]() on price action and the
high/low pivot areas. In fact, many backtesting studies suggest MA crossovers do
not work in the long run. Once again, price action is what you need, it's
superior, nothing beats it.
on price action and the
high/low pivot areas. In fact, many backtesting studies suggest MA crossovers do
not work in the long run. Once again, price action is what you need, it's
superior, nothing beats it.
Trust me, they don't work as good as price, you can be faster than that. Which
is exactly why I intend to eliminate stochastics at one point.
Part of the trick here is speed. You want to be faster than the rest and the
ONLY way I know how to accomplish that is by following price action and nothing
else.
Anek
I think you will like ES. I find the stops more reliable than YM. This thread has made me take a look at heikin-ashi charts as staying with a move is one of my weaknesses. Do you simply exit when you get a change of color?
Quote from GaryN:
I think you will like ES. I find the stops more reliable than YM. This thread has made me take a look at heikin-ashi charts as staying with a move is one of my weaknesses. Do you simply exit when you get a change of color?
I'm here sitting with my Stout(s) and my ES charts considering 610 tick
charts as working area for next week with a 4x anchor chart for meaningful S/R
areas to avoid congestion and understand the big picture.
Any suggestions related to chart size and/or ES characteristics this would be
the time. My experience with ES is usually limited to swing trades.
Thank you.
Anek
Just studied the daily ES chart to get familiar with what's going on in this
"new" territory. The actual trend is 100% down no doubt about it.
Low of Friday looks like minor support from 03/07. How and if it bounces from
here will be interesting to watch. If we get more downside the next support area
is very much important, 1400 + psychological. If we get down there I expect some
consolidation, highly doubt that gives up without a massive bull fight. Now, if
that breaks and support becomes resistance it could get very ugly for the
market.
No bias just doing homework.
Anek
Quote from bmwhendrix:
Stealth, It appears you must be using about a 200 tick chart or minute equivalent. At least that is what is seems to be on my IB data feed which is not true tick. And given that time frame it looks like stops might be up to 30 points. Is that about right?
But with runs like that last short, who cares!. Thanks for posting.
Quote from xiaodre:
bmw, I think Stealth Trader said he is using constant tick bars and from looking at the chart, it looks to be the ES 10,000 contracts per bar. It's something ensign software does, but apparently very few other packages.
To whoever was asking about similarities with Proflogic's methods, constant volume bars is something he espouses I believe. Someone correct me if I'm wrong.
Anek, great great thread. I am an avid reader and fan.
Looks to be about as smooth as a baby's bottom compared to constant volume bars in the YM...
Here is a HYPOTHETICAL chart of how I would have traded ES on Friday using my
rules.
Arrow direction = Short or Long
Yellow Cross = Stopped out
Last short prob a BE, too close to tell.
Anek
interesting..interesting....very good...i am studying SPY with 200K share
constant volume... i have quote tracker with etrade feed...
will like to move..shat would be a good suggestion for action replay..i watch
live markets for 3 hrs daily...
any software which does market replay...
whats your thought on market delta..if not why not..need to get into your
brain..why you reject it... Dr Brett contantly approves of this ask/bid and
delta shift theory
also why not look for market internals
I did the trial on Market Delta awhile back but could not see any real advantage to it that is above and beyond what you see on DOM but I know a couple of people who seem to like it. Sometimes I think it is counterproductive to look at too much. If you have traded for awhile and absorbed losses over a period of time the mind starts looking for an excuse not to act and the more you look at the more excuses you can come up with. At least this has been my experience. I have gradually pared down my data to the bare minimum.
B,
I agree with Gary, I like to keep things simple to be able to concentrate on
what really matters, price.
Anek
Quote from Anekdoten:
Last short prob a BE, too close to tell.
Anek
entry rules
what are the enry rules for the last entry.
1. do u enter on 3 rd bar or 2nd bar close. whats the target and stop for emini
sp 500.
will be good to see if it works for s&p....
u did not have stchs on last charts so dont know how u entered trade...did u
enter on 14.59 bar close
Re: entry rules
Quote from billdobson1972:
what are the enry rules for the last entry.
1. do u enter on 3 rd bar or 2nd bar close. whats the target and stop for emini sp 500.
will be good to see if it works for s&p....
u did not have stchs on last charts so dont know how u entered trade...did u enter on 14.59 bar close
Enjoying the helpful discussion so far. I wonder if switching to ES at this
time would be much better than YM, considering the noise that just came into
this game. Be careful out there everybody:
http://futurepathtrading.com/content/view/362/69/
If you were trading the SPs on Wednesday, you probably noticed a marked chance in behavior re the "noise level". 10 ticks up, 10 ticks right back down, 10 ticks up, ten ticks down...., also, affectionately known as "noise". You probably also noticed a huge drop in the size of the bid/ask. All markets have their own footprints and the footprint in the SPs had definately changed mid week. It is pretty hard to keep things "mum" in this industry, so it did not take more then a few hours of networking around to learn that one of the largest firms specializing in algorithmic "black box" auto systems (market making), had taken a rather large hit the prior few days, and had turned off all their auto-trading systems. Another large firm specializing in the same game, claimed "technical difficulties" and had also shut off their auto trading systems. These type of systems add liquidity to the system and generally make up about 40% of the volume in the e minis. Some of the systems work in the manner that a floor specialist would - buying on bid, and selling out on offer 2-3 ticks higher, or shorting on offer, and covering on bid 2-3 ticks lower - constantly extracting dollars out of the spread between the bid ask.
Have you ever taken the time to determine what happens to price, once you've
been stopped out? Maybe you'd be better off hitting the REVERSE button rather
than the EXIT button.
After all, the market is telling you you're on the wrong side.
Quote from thrunner:
Enjoying the helpful discussion so far. I wonder if switching to ES at this time would be much better than YM, considering the noise that just came into this game. Be careful out there everybody: http://futurepathtrading.com/content/view/362/69/
Quote from AlpineTrout:
Have you ever taken the time to determine what happens to price, once you've been stopped out? Maybe you'd be better off hitting the REVERSE button rather than the EXIT button.
After all, the market is telling you you're on the wrong side.
Quote from Anekdoten:
Alpine,
point dully noted.
Quote from Anekdoten:
Alpine,
I have not done enough studies to determine that but if I had to take a wild guess I would say there are more chances of choppy action developing before a new trend. If the chances favor choppy action vs a complete reversal the chop could most probably chop your head off
Good question for a complete study though, point dully noted.
Anek
Quote from Anekdoten:
X,
Thanks.
Here is a screenshot of 10,000 volume bars for ES in Tradestation; I must say, not bad!
Look at that massive downtrend during the second half of the trading day. That was free money, free free free
Anek
Quote from Anekdoten:
When to exit is a loaded topic and perhaps merits an entire book.
For now I will give you the following suggestions.
- If long before last known resist area
- If short before last known support area
- If scaling out and trade happens to break out in your favor then watch the next time it makes a HH or a LL depending if you are short or long.
- HA bars help me determine VISUALLY in a quickly manner if I should trail my stop because momentum is there.
....and last but not least, learn to read momentum. This can be a powerful thing, when price is on fire and not looking back, there is no reason to leave the roller coaster, ride it until you see hesitation. Once again, price action, price has mood swings, behavior, characteristics, learn to read them. It's very valuable.
Hope it helps.
Anek
Quote from Kicking:
Just a word on this if this if it's an index system . Not sure how many trades it takes, and if it's base on charts only, but BEWARE !
Il will say this: TA on intraday charts is pretty much worthless and in the current market forget it . You've got to have something else than TA alone to even have a chance to survive.
Daytrading on TA (S/R, patterns, oscillators have they ever worked as standalone?) is DEAD ! There is nothing there. A couple of years ago yeah you could make money more than 50% of the time if you were really good.
Don't waste your time trading intraday and don't dream about making it as a homebased daytrader. It's the biggest pipe dream/ scam invented by the brokerage industry.
Quote from TdrDave:
Stealth, I also use ensign, could you please explain what function was used to create the LL,LH,HH,HL notations on the chart. Thank You, Dave.
Quote from Razor:
Hi Stealth,
Your experience and input is welcome here I am sure, please keep posting and your points are noted regarding getting stuck on one particular emini.....a question I have though....
.....if one is and has been consistently profitable for a while why not trade ES and over time build contract size....why stay at 10 etc ?.....I mean from what I have read one can do 100 - 300 ES contracts a time with 1 tick slippage ? Sounds like a lot of cars but if one is consistently profitable and account is building even with withdrawls why not add contracts over time ?....just a thought, ok I am off now for a couple brews
Quote from bmwhendrix:
Stealth, your comment on Anec is right on. I have played around for about 20 years with trading as a hobby. Now becoming serious, and I fully appreciate the what Anec is doing. Very rare indeed.
Quote from bmwhendrix:
Stealth, It appears you must be using about a 200 tick chart or minute equivalent. At least that is what is seems to be on my IB data feed which is not true tick. And given that time frame it looks like stops might be up to 30 points. Is that about right?
But with runs like that last short, who cares!. Thanks for posting.
Two shorts so far this morning. First one stopped b/e. Second hit target.
Quote from xiaodre:
Looks to be about as smooth as a baby's bottom compared to constant volume bars in the YM...
Stealth,
When you take a Short and you're waiting for that next HH - HL combination to
take you out of the trade, don't you get chopped up on small range days of say 7
- 10 pts.?
Heres my chart for the two trades. Enter on break of trendline, target lod.
Quote from AlpineTrout:
Stealth,
When you take a Short and you're waiting for that next HH - HL combination to take you out of the trade, don't you get chopped up on small range days of say 7 - 10 pts.?
Quote from Stealth Trader:
My hard emergency stops for the ES placed with entry order is three points. Stop is then immediately set two ticks above/below high/low bar of swing point entered in normal market conditions.
st
Quote from GaryN:
What about in the present conditions? Kind of hairy when that swing hi/lo is 4-6 points away from your normal entry points. Of course the reward is proportionately greater but it takes some getting used to.
Quote from Stealth Trader:
Quote from Stealth Trader:
Ooops, forgot the attachment.
st
Basically I was just asking if the present volatility had changed your normal pattern of trading. Thanks for the detailed explanation of your method. I will look it over this afternoon.
Quote from GaryN:
Basically I was just asking if the present volatility had changed your normal pattern of trading. Thanks for the detailed explanation of your method. I will look it over this afternoon.
Nice work ST.
On your chart where you have the green bar with the green dot ontop, you then
have a red down bar, then another red down bar that breaks that previous down
bar, then a green bar that breaks to the upside, in line with the trend. Any
reason you didn't take that trade? It looks like your 123 bar reversal pattern.
My guess would be because the red bar didn't close below the green bar with the dot.
__________________
Boib
Its easy to make a small fortune if you start with a big one
Loving ES ![]()
Edit: Holy shit ![]()
Anek
Quote from Honda:
Nice work ST.
On your chart where you have the green bar with the green dot ontop, you then have a red down bar, then another red down bar that breaks that previous down bar, then a green bar that breaks to the upside, in line with the trend. Any reason you didn't take that trade? It looks like your 123 bar reversal pattern.
Stealth,
What kind of chart is that that you posted? Are you a constant volume proponent?
B
Trades for 08.06.07
If you are following my journal you should be aware by now that today marked my
complete transition from YM to the ES.
I studied it during afterhours using 500 share charts, even made some scalps
because it was trending nicely, took a much needed rest afterward, overslept a
bit and then.....
"THIS IS SPARTA!" (Avid fan)
To the trades.....
Shorts
1) Stopped out, eventhough it did not work, I'm not happy with my entry, took a
bigger stop than what I had planned due to bad entry. 3.25 Possibly a product of
my first scalping day in ES. A bad trade in every sense of the word but had it
gone a bit higher it would had been a legal short due to Price Action. Yes, I
make mistakes, on a daily basis too
![]()
Longs
1) Winner
2) Winner
3) Winner
4) Grand Slam
Off to get some rest.
Anek
Hi,
Best day yet since taking this approach, $323 net gain trading 1 NQ contract
only per trade.....pretty happy considering NQ is only worth $20 a point
![]()
Well, started this approach 7 days ago, here are the net results since starting,
all trades NQ and 1 contract only, usually 4 - 8 trades per day:
-76
-28
+43
+228
+36
+27
+323
Current goal is to have more winning days per week than losing days and for
my winning days to be bigger than losing days on avg.
Thanks again for all the contributions from everyone on this thread especially
Anek ![]()
Cheers ![]()
Razor,
I'm very happy for you it looks like you are on the right track!
Anek
Quote from Razor:
Hi,
Best day yet since taking this approach, $323 net gain trading 1 NQ contract only per trade.....pretty happy considering NQ is only worth $20 a point
Well, started this approach 7 days ago, here are the net results since starting, all trades NQ and 1 contract only, usually 4 - 8 trades per day:
-76
-28
+43
+228
+36
+27
+323
Current goal is to have more winning days per week than losing days and for
my winning days to be bigger than losing days on avg.
Thanks again for all the contributions from everyone on this thread especially Anek
Cheers
Cheers Matey ![]()
Quote from Anekdoten:
Razor,
I'm very happy for you it looks like you are on the right track!
Anek
I need to do some research between constant volume bars and the volume bars
Tradestation provides.
Will report any findings.
Thanks to ST for his valuable contributions to the thread.
Anek
Quote from Anekdoten:
I need to do some research between constant volume bars and the volume bars Tradestation provides.
Will report any findings.
Thanks to ST for his valuable contributions to the thread.
Anek
Quote from Bogwaluth:
Stealth,
What kind of chart is that that you posted? Are you a constant volume proponent?
B
Quote from Stealth Trader:
Valuable???? I'd say that is subjective to personal opinion. I was just called a "shill" on another thread!
st
I havent met a good trader yet that was a negative personality. How can you be sour if your making money?
Quote from GaryN:
I havent met a good trader yet that was a negative personality. How can you be sour if your making money?
Great thread.
BK,
This is how I average up. Had you added a forth one there, plausible, you would
have had the following outcome:
Enormous gain on the first.
Gigantic gain on the second.
Great gain on the third.
Small loss on the fourth.
Note: I don't recommend this YET unless you are an experienced trader and
dominate to perfection what I'm trying to teach here.
Nevertheless, this is in my humble opinion the holy grail of money management
systems.
Hope it helps.
Anek
I'm getting multiple private messages on suggested reading material.
The way i trade and the way I manage my trades is based on personal trading
experience and I don't think I could give credit to anyone out there but myself
and my hard work (and my family) for increasing my trading skills.
To be honest there is a lot of crap out there.
However, if I had to recommend one book, I would highly recommend the following
work by Suri Duddella, "Trade Chart Patterns like the Pros". You can get it from
surinotes.com, I did.
This guy deserves a round of applause. In fact, he posts in ET Forums, he
actually sent me a PM the other day asking me if i could review his book on the
reviews section and eventhough I have not done that yet (sorry man) I will go
ahead and recommend it here.
The book has nothing but chart patterns and price action analysis, a great piece
of work, terrific.
Disclaimer, I'm not related to Suri or get commission from the sales, just
anticipating the ET Police ![]()
Anek
To the Crazy ETers via PM:
..... yes I paid for the book too you skeptical fools.
If you guys spent more time trading and doing less detective work your PL would
be higher ![]()
Anek
Slapped like a mule today. I turned +600 into -1565. Around 735AM PST, I ran
into a stuck quotes issue, unable to remove cancelled orders kind of messed me
up. Became frustrated when I missed out on a nice down move, would have put me
over 1000.
Continued trying to short the move, but by that time there wasn't much left. Did
not take the small profit offered. Then ran into the rally, my confidence was
low and frustration high so I did not profit from it.
I seem to have difficulty when the trend changes meaningfully intraday.
Anvil,
Attached most notable changes of trend. It's imperative that you are able to
recognize this in real time. Until you do, you are better off in the simulator
because it's a key ingredient of the system.
Examine carefully when price starts making new higher highs or new lower lows.
Check the end of the day, check how a change of a trend is developing there.
Hope it helps and don't give up, takes a while to master this part. In fact
everything revolves around this.
Anek
Anek, Are you using the 10,000 share bar chart to trade ES? One of the
problems I am having is switching back and forth between timeframes, and one
chart will show me a clear LL and LH, but on another (let's say shorter)
timeframe there might have been a HL in between which throws me off.
Stealth, When I first discovered ET (fairly recently) I was quite turned off by
the amount of negativity - just plain nastiness - on many of the threads. I now
limit myself pretty much to the few and rare positive threads, like this one,
and the ES journal. Many of the better professional traders stress the
importance of maintaining a positive mental attitude, and provide links to
articles and other resources on their websites. Clearly important in all aspects
of life, as Tony Robbins would tell you
![]() but critically important in the
trading profession.
but critically important in the
trading profession.
thanks again for the work here Anek!
just a great thread for n00bs like me.
also, ST, thanks for your examples. yes, i see the similarity to your technique
and Anek's. very helpful.
![]()
Quote from Jaxon:
Anek, Are you using the 10,000 share bar chart to trade ES?
Quote from BigBubba:
thanks again for the work here Anek!
just a great thread for n00bs like me.
also, ST, thanks for your examples. yes, i see the similarity to your technique and Anek's. very helpful.
Hi Anek,
Great thread.Appreciate your willingness to share.Have one question for now
regarding entries on a 50% retracement of the prior swing.
Do you differentiate between Fib entrys in an up market which is making higher
highs and higher lows vs an upmarket where the last high did not not take out
the previous high??Would you still look to enter on a 50% retacement of the last
swing even though the last high was lower thn the one preceeding it??
Would you wait to see if the next low was a higher low??
Thanks in advance
Tao
Thanks for you assistance, Anek.
Now that I removed the yellow crime tape wrapped around my head I am reviewing
my trade journal for the day.
I trade equities, via a prop firm...this might be a lame question, but do you
think I can apply the AHG method successfully to the SPY? I generally scalp XOM
during the day, pretty successfully by targeting 6, 8 10 cents at a time.
Catching larger intraday trends I find much more difficult, almost unnerving; I
think my average hold time is in the 11 seconds on winners, and yes 2 hours on
losers as I pray for divine assistance!
I used a low near Fridays close, combined with the lower low in the first 15
minutes today, reading your prior response leads me to believe I should not have
counted Fridays action in determining the trend today.
Jesse Livermore use to say he made most of his money when he was 'sitting on his
hands'...waiting for the trade to present itself. That is a tough one for me
with the buypower burning a hole in my pocket and my monitors twinkling away
with green and red.
Tao,
That's a great question. In order for me to see the continuation of an uptrend,
I need to see higher highs and eventhough price can and will retrace at some
point that retracement will tell you a lot about price action.
What if the retracement makes a double bottom ? Goes as low as previous support
and bounces back and makes a new high ? Is that still an uptrend, technically,
no! Because an uptrend requires higher lows, not higher highs and same lows.
Now, double bottoms are powerful little fellas, so much discretion around this
area.
During an uptrend, you need to examine price with all your attention and when
you see those candles WITHIN that retracement making higher lows and higher high
then you say....ok this could be my entry. That, is price action. Time and sales
help in this, where is the pressure ? In the buying ? In the selling ? Lot of
tips here and there that can be used.
Hope that helps a bit, great question.
Anek
Quote from taowave:
Hi Anek,
Great thread.Appreciate your willingness to share.Have one question for now regarding entries on a 50% retracement of the prior swing.
Do you differentiate between Fib entrys in an up market which is making higher highs and higher lows vs an upmarket where the last high did not not take out the previous high??Would you still look to enter on a 50% retacement of the last swing even though the last high was lower thn the one preceeding it??
Would you wait to see if the next low was a higher low??
Thanks in advance
Tao
Quote from anvil993:
I generally scalp XOM during the day, pretty successfully by targeting 6, 8 10 cents at a time.
Catching larger intraday trends I find much more difficult, almost unnerving; I think my average hold time is in the 11 seconds on winners, and yes 2 hours on losers as I pray for divine assistance!
Quote from Anekdoten:
To the Crazy ETers via PM:
..... yes I paid for the book too you skeptical fools.
If you guys spent more time trading and doing less detective work your PL would be higher
Anek
Quote from Anekdoten:
Jaxon,
500 Volume Bars for Aftehours.
10,000 Volume Bars for Market hours.
Recently starting with ES so nothing written in stone.
One thing you could do is stick to a chart you feel comfortable with then use an anchor chart of say 4x the small one for major S/R + areas of congestion.
You can only slice price in so many ways.
Anek
First trade of day
Anec and Stealth,
I usually start off the day with a bad trade. Do you have certain criteria you
look for each day, perhaps not to trade before a certain time, or to wait for an
initial high and low to form?
Again thanks,
Don
Quote from Anekdoten:
Anvil,
Attached most notable changes of trend. It's imperative that you are able to recognize this in real time. Until you do, you are better off in the simulator because it's a key ingredient of the system.
Examine carefully when price starts making new higher highs or new lower lows.
Check the end of the day, check how a change of a trend is developing there.
Hope it helps and don't give up, takes a while to master this part. In fact everything revolves around this.
Anek
Quote from AlpineTrout:
I think the subjectivity of this methodology lies in the undulations of price and what actually constitutes a HH, HL, LL, & LH. Please tell me if I'm wrong.
Stealth, I also reduce my tics or shares when looking at overnight activity.
10000 shares in ES goes by quickly during the day, while overnight it could take
6 hours. YM especially, overnight volume is so light that the entire evening
could be one bar at the day's pace.
I also tend to look at a longer term chart during the day to determine the trend
but check a very short term chart to pick an entry. It does appeal to me
intuitively to just concentrate on one timeframe for daytrading. I just haven't
figured out what that is, so I switch back and forth a bit.
![]()
And here is a new twist. Should I be looking at yesterday's late high? If so, we
are now making lower highs. If I ignore yesterday, then we have a higher high
this morning. ![]() (I am over
thinking, I know)
(I am over
thinking, I know)
Quote from GaryN:
Determining the swings is the least subjective aspect imo. Subjectivity comes in on the entries and exits which cannot be helped because they are always a compromise.
ST,thank you for your priceless contribution to this thread..in one of your
previous posts you claim that trading the range in chop is easy money..could you
illustrate it with an example? would be nice to see a chart where you handle one
of those range bound days..once again thanks and I'm counting on your good mood
here ![]()
Anek,
I came across this thread a couple of days ago and have been very impressed with
your willingness to help others. I'm in the group of newcomers trying to make
sense of futures trading. I'm sure I'll have more questions as I try to become
skillful at your seemingly straightforward method.
I've been practicing with mixed success. I'm using timed price data, vs. fixed
volume, because that's all I have available using Etrade's platform, TTrader. I
know that's a crappy reason to use time-based price data, but until I move to a
different platform, what time period do you think would most mimic volume
graphs, for the ES? 1 minute charts move very fast and 5 minute charts seem way
too slow. Perhaps 3 minute bars?
Also, would appreciate anyone's 2cents on which platform I should look at.
Thanks.
Anec
I've brushed off fibs in the past but Ive been looking at it since you brought
it up and it does look like a pretty sound method of entry. Can you tell me what
kind of stop you use for those times when price blows right through your limit
order. When price is moving fast when it gets close to your order do you pull it
and try to get a better price?
Quote from Stealth Trader:
I'm curious as to why you would want to use different chart settings. The whole purpose of using constant volume is too take out the variables, not add them back.
st
Hey Coach...stayed patient, identified the trend, made good trades, took
profits, stayed in the 'present'...banked $1244.
Logged off and currently trying to tie myself to my chair...to avoid logging
back on and getting reamed on a rash trade.
Re: First trade of day
Quote from bmwhendrix:
Anec and Stealth,
I usually start off the day with a bad trade. Do you have certain criteria you look for each day, perhaps not to trade before a certain time, or to wait for an initial high and low to form?
Again thanks,
Don
Anek, Does Tradestation work ok for you? I know my comp is underpowered, but
it freezes up when activity picks up and has been nearly worthless since 215pm.
I know ts has issues with this and it is not just me.
GaryN, Anek will answer your question, but I went through the same thing and it
appears to me that rather than place a limit order at a fib retracement, waiting
for the market to hit that level, it seems that Anek lets the market turn hgiher
first, then with the help of stoch crossover enters on the uptic. Is that fair,
Anek?
Alpine,
It's prob both subjective and objective, that's where skill and experience comes
into place.
The pivots plotted by the software are quick areas of reference but not
necessarily written in stone as they have fixed parameters that might work for
some scenarios and not for others.
I actually use them so my charts look more clear when I posted them here.
You are correct about the undulations, they matter to me. If it helps highs and
lows based on FIXED wavelengths are extremely useful especially when using
volume bars.
That short was wrong on all levels as specified on the annotations, anticipated
it and paid the price.
Anek
Quote from AlpineTrout:
A few questions:
1) I understood from the beginning of the thread, that your defintion of a change in trend from UP to DOWN is (2) LL's and (2) LH's. Is this correct?
2) Are you using any price undulations that are not drawn automatically as a pivot by the software, as a LL or LH ?
3) I'm asking the above, because on that first Short (loss), I only see one LH (according to pivots placed by the software) before you took the Short trade. Please explain.
I think the subjectivity of this methodology lies in the undulations of price and what actually constitutes a HH, HL, LL, & LH. Please tell me if I'm wrong.
Quote from GaryN:
Determining the swings is the least subjective aspect imo. Subjectivity comes in on the entries and exits which cannot be helped because they are always a compromise.
Quote from anvil993:
Hey Coach...stayed patient, identified the trend, made good trades, took profits, stayed in the 'present'...banked $1244.
Logged off and currently trying to tie myself to my chair...to avoid logging back on and getting reamed on a rash trade.
Walter,
I do not like time based charts, they got longbars and mislead. I don't
recommend them.
Feel free to use them to practice trend classification but definitely tick or
volume based bars for the real deal.
Anek
Quote from walter1986:
Anek,
I came across this thread a couple of days ago and have been very impressed with your willingness to help others. I'm in the group of newcomers trying to make sense of futures trading. I'm sure I'll have more questions as I try to become skillful at your seemingly straightforward method.
I've been practicing with mixed success. I'm using timed price data, vs. fixed volume, because that's all I have available using Etrade's platform, TTrader. I know that's a crappy reason to use time-based price data, but until I move to a different platform, what time period do you think would most mimic volume graphs, for the ES? 1 minute charts move very fast and 5 minute charts seem way too slow. Perhaps 3 minute bars?
Also, would appreciate anyone's 2cents on which platform I should look at.
Thanks.
Quote from GaryN:
Anec
I've brushed off fibs in the past but Ive been looking at it since you brought it up and it does look like a pretty sound method of entry. Can you tell me what kind of stop you use for those times when price blows right through your limit order. When price is moving fast when it gets close to your order do you pull it and try to get a better price?
Jaxon,
Tradestation requires a solid machine with plenty of CPU power and memory to
work well.
I like the charting software though.
Anek
Quote from Jaxon:
Anek, Does Tradestation work ok for you? I know my comp is underpowered, but it freezes up when activity picks up and has been nearly worthless since 215pm. I know ts has issues with this and it is not just me.
GaryN, Anek will answer your question, but I went through the same thing and it appears to me that rather than place a limit order at a fib retracement, waiting for the market to hit that level, it seems that Anek lets the market turn hgiher first, then with the help of stoch crossover enters on the uptic. Is that fair, Anek?
If you are curious, I'm not trading now due to chop
![]()
Anek
Market Internals
Hi Stealth
There has been mention of market internals here. Could you mention a few I could
read up on?
TICK, TRIN, PUT/CALL, A/D ?
could you please elaborate ?
thanks for a great thread anek !
cheers
ss
Quote from Jaxon:
it seems that Anek lets the market turn hgiher first, then with the help of stoch crossover enters on the uptic. Is that fair, Anek?
Re: Market Internals
Quote from screenstruck:
Hi Stealth
There has been mention of market internals here. Could you mention a few I could read up on?
TICK, TRIN, PUT/CALL, A/D ?
could you please elaborate ?
thanks for a great thread anek !
cheers
ss
Today's chart
Anek, 3 trades today 2 win 1 loss +4,-4,+4
Would you offer comments on my entries/exits or lack of same?
Thanks,
Don
Hi,
Well back to reality today, -$216 net. Not sure what I really did wrong but just
too many losers v. winners (had an awesome short entry this morning and covered
waaaaaaayyyyy to early) and an order in for a long after fed and pulled it (if
it would have filled I would have been in for the monster rally up until
330pm.....)then I tried to get long on the pullback after the rally into 330pm
which just ended up selling into close so obviously I got stopped...oh well,
wish I could have kept the loss to under $100 today but such is life, could take
2 - 3 days to make back this 216 loss we shall see....hope others did better,
off to a meeting be back after 10pm or so tonight.....cheers
![]()
Re: Today's chart
+4 net on ES is an awesome day congrats ! Picture just averaging 2 points a
day and building up to 50 cars per trade ;)
Nice work !
Cheers,
Ray
Quote from bmwhendrix:
Anek, 3 trades today 2 win 1 loss +4,-4,+4
Would you offer comments on my entries/exits or lack of same?
Thanks,
Don
Thanks, Razor, Just luck at this point. Why don't you post your chart. Helps to get input.
Trades for 08.07.07
All annotations on chart.
Shorts
1 and 2 Averaged up on the shorts.
Longs
3
Where are the losers ? Keep behaving like this market, I like it.
Got to respect the market, the moment you get arrogant it can slap you hard
without a warning.
However, (ji ji ji) I will defy my own rules and say, taking candy from a baby
![]()
Now watch the market pull a heavy day of reversals on me to slap my behind
![]()
Trend is your friend, my friends!
Anek
PS: Notice the "elite" volume size bar
![]()
Nah, you are following the plan, no such thing as luck
![]()
Yea, I will try and post a chart later tonight when I get back from meeting if I
don't hit the sack right away.....
Quote from bmwhendrix:
Thanks, Razor, Just luck at this point. Why don't you post your chart. Helps to get input.
Anek, What size stop on that last trade?
Quote from bmwhendrix:
Anek, What size stop on that last trade?
Re: Re: Market Internals
Quote from Anekdoten:
I will let ST answer this but I could not help posting my opinion
TICK TRIN A/D nothing of that matters to me. It used to, it does not anymore.
So ST does not approve of my anchor charts and I don't approve of his market internals.
Can you say, FIGHT!?
Just kidding, peace and love.
Anek
Re: Today's chart
Quote from bmwhendrix:
Anek, 3 trades today 2 win 1 loss +4,-4,+4
Would you offer comments on my entries/exits or lack of same?
Thanks,
Don
Re: Re: Re: Market Internals
Quote from Stealth Trader:
I do not change the speed of my intraday charts at all. I was simply questioning why you continually change the speed of the entry/exit chart depending on what day or time it is. Nothing more was intended.
st
market internals? ![]()
To All:
Here is a little tip on extending your winners.
Remember, in this method, you are always with the trend, unless it changes, odds
are always in your favor. Speaking of odds, this is precisely why I trade this
way.
When you are a contrarian, calling tops and bottoms, don't you feel praying more
than trading most of the time ? Think about it, you are hoping the market
changes drastically just for you! A little naive don't you think? When the
market is ready to turn, it will lead you and even lay down hints in the
process.
Once you digest the logic behind this your confidence will increase
exponentially.
Anek
I had two trade for +3 points today. It always embarrases me when the market makes a big move up as I seldom make much. I have always done much better with the shorts as I have more confidence in what Im doing. Not sure what the cure is.
Quote from GaryN:
I had two trade for +3 points today. It always embarrases me when the market makes a big move up as I seldom make much. I have always done much better with the shorts as I have more confidence in what Im doing. Not sure what the cure is.
Some US markets have statistics on the market internal operations such as TICK, TRIN, advances, declines. Forex, for example, does not have these market internals.
Quote from screenstruck:
market internals?
Keep at it GaryN. +3 is always than -3 and much better than -33. Shorts moves twice as fast as longs generally, so you are exposed to shorter periods of anxiety
Quote from GaryN:
I had two trade for +3 points today. It always embarrases me when the market makes a big move up as I seldom make much. I have always done much better with the shorts as I have more confidence in what Im doing. Not sure what the cure is.
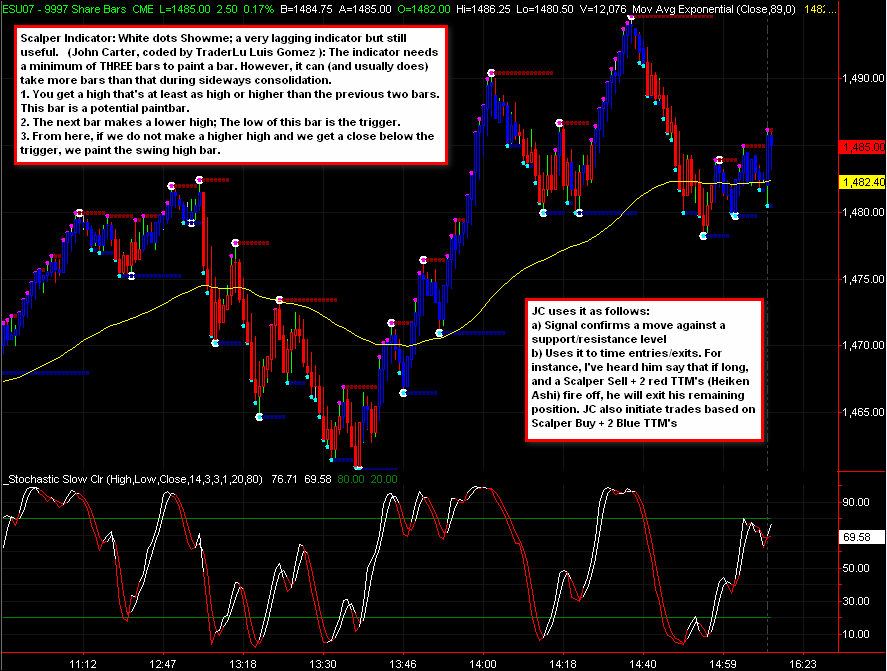
Attached please find the Tradestation indicators used in the sample Tmarket
suggests.
I have zero or very little experience with this so can't comment on the pros or
cons of such system.
However, if you got the skills this can easily be backtested in automation.
Comments welcome of course.
Anek
Hey guys! I just wanted to start out by saying to Anekdote that this journal
you've started is fantastic! This is what trading is all about. The conclusions
you have come to and this system you have been developing falls right into the
same things that I have determined: price action will give you the answers. I am
in efforts of refining my trading style to the same guidelines you have been
teaching here. I have a few questions though, and pardon if they make me look
amateur.
1) I daytrade equities instead of futures. Is there a reason that you choose
futures over equities? If so what is that reason? And if daytrading equities
instead of futures contracts is an ok option to stick to, will this type of
trading system still qualify?
2) Trading these equities I use multiple time frames for price TA, but my base
chart runs in 5 minute increments. I noticed that you use Tick instead. I have
no experience in that, but I realize this would make our charts quite a bit
different visually. So I guess the question falls somewhere under these lines:
Are you using Tick because you trade futures instead of equities, and is the
fact that I am using incremental candles instead of tick going to cause this
this type of trading system to function improperly.
Phew! Hope that isn't too confusing for you guys to read
![]()
![]()
Regards.
Cx,
I started in equities. However, futures are better, for me anyway, for countless
reasons.
- Better liquidity
- Less games (electronic)
- Way more leverage
- Around the clock (kind of)
- No research involved
- Less slippage
- No short uptick rule
- Can daytrade without 25k
- Easier taxation
...etc, etc, etc. I highly suggest you search around the forums or elsewhere for
the vast number of reasons.
As far as charts, tick and volume bars, you need to be able to kill the possible
longbars in time based charts that hide what could be important to observe; at
least as a scalper.
Hope it helps.
Anek
Do you do breakouts at all? I took the break over yesterdays high. My target
is 1499.75
edit: stopped out at 97.75. Came within a tick of hitting my target.
I was expecting strong resistence at 1500 but it was a little late in coming
in. Went another 5 points beyond my exit. Oh well. I have started watching
volume charts alongside my regular charts and I can see some interesting
differences. With overnite data included you could make a pretty good case for
having gone long right near the open.
Gary,
Wouldnt it be a higher probability trade if you let the breakout run and wait
until a HH or LL is formed, then have the odds aligned in your favor.
Quote from anvil993:
Gary,
Wouldnt it be a higher probability trade if you let the breakout run and wait until a HH or LL is formed, then have the odds aligned in your favor.
Trades for 08.08.07
Chart Attached.
Not my kind of day, did not see ideal retracements in many good trends.
1 Long
Modest gains
2 Short
1st Winner
2nd Stopped out
Total
2 for 3
Taking off early, not my kind of day. I'm thinking 10,000 bars might be a bit
too high for my scalping style but it's too early to tell. Since I'm new to ES I
might start examining 5000. Definitely can't say I'm married to one yet. Not
sure yet, could be the feeling that today I did just ok and saw many good trends
that did not quite give me a good entry. It took some discipline.
Tomorrow is a new day, taking off early to clear my mind. I see a bearish trend
forming now but I'm not in the right state of mind, choosing the door out.
As I say, small gains, small losses, no shame in that.
Anek
I need advice; please help. I just setup my first futures account, and I have
a choice of software platforms:
Realtick
Quote Tracker
Nexa
Meridian
or Esignal
I currently use IQ for equities, but they don't allow futures. Any suggestions?
Thanks,
Tyler
Esignal is great but expensive.
Anek
Quote from tv92670:
I need advice; please help. I just setup my first futures account, and I have a choice of software platforms:
Realtick
Quote Tracker
Nexa
Meridian
or Esignal
I currently use IQ for equities, but they don't allow futures. Any suggestions?
Thanks,
Tyler
"The ones you should ignore (for now) because they require greater
skill to consistently profit from or
simply, the sideway ones:"
Following this rule has really helped me stay out of trouble.
+827
I just examined the day at hand using 5000 volume bars and see those
pullbacks I did not find today in 10000.
Taking into serious consideration.
Ok off I go.
Note to self: Examine more days
Anek
Quote from anvil993:
"The ones you should ignore (for now) because they require greater
skill to consistently profit from or
simply, the sideway ones:"
Following this rule has really helped me stay out of trouble.
+827
Quote from Anekdoten:
I love it when you guys post profits, makes me feel great. Record what you been doing that is helping you, stick to the plan/rules.
Anek
Anek, still trading YM, I took basically the same trade as your 2nd short,
but I got in a little earlier and my trailing stop gave me a small profit on
that trade. I move my stops pretty quickly to preserve profit, but hopefully not
too quick in case the market wants to run. Following your method really saved me
some heartache this afternoon. Following the plunge to the lows I really really
wanted to short it, but looking at my chart after the 15:28 low I saw mostly HH
and HL (one LL), so.... according to my trading plan I don't short. Didn't take
a long after a couple of HH/HLs, but at least it saved me from taking an ill
advised short. ![]()
Quote from Jaxon:
Anek, still trading YM, I took basically the same trade as your 2nd short, but I got in a little earlier and my trailing stop gave me a small profit on that trade. I move my stops pretty quickly to preserve profit, but hopefully not too quick in case the market wants to run. Following your method really saved me some heartache this afternoon. Following the plunge to the lows I really really wanted to short it, but looking at my chart after the 15:28 low I saw mostly HH and HL (one LL), so.... according to my trading plan I don't short. Didn't take a long after a couple of HH/HLs, but at least it saved me from taking an ill advised short.
In case you don't have access to volume bars.
Attached please find ES Chart using 4999 shares for today's action.
This is more like me, look at all the pullback opportunities with the trend.
Exquisitely beautiful for my averaging up money management approach (again, only
for veteran traders).
Anek
In order to prevent the same question asked over and over again I will state
my opinion on MACD here in the journal, this will make my job easier as I get
the same questions asked over and over and over again.
- It is extremely slow, gets you in and out 3-4 bars too late. This goes against
my trading style.
- It's useful only on strong trending environments and you will leave profits
behind on entries and exits.
- It's divergences signals are as good as 50%. More like random, more like
useless.
- It is nothing but the derivative of two LAGGING indicators (Moving Averages).
Do I recommend it ? NO!
I don't want to start a MACD discussion in this journal, just stating my opinion
for the record.
You are better off learning CCI, in fact you are better off with price action
alone, no stochastics either, that goes for me as well.
.....but if you use it profitably, by all means disregard all of the above and
carry on. ![]()
Anek
Attached please find the outcome of the system TMarket described yesterday
for today.
White dot plots, if subsequent bars are of the same color (HA) of the pivot
direction, take the signal.
Notice that the white dot ONLY plots after 3-4 bars have been completed,
sometimes more.
Just a one day test, no conclusions yet. However, compared to AHG, pitiful so
far. Using 5000 volume bars I would have killed that chart.
My only doubt is if the bar with the plot has to be of the desired color or only
the following ones. I assumed it had to be.
Anek
Anek,
Take a look at this idea on your 4999 CV chart for entry, exit and re-entry. T28
in his SPM thread used a 3sma (+1 offset). TradeStation can probably do it. You
might be able to ditch the Stoch.
Quote from AlpineTrout:
Anek,
Take a look at this idea on your 4999 CV chart for entry, exit and re-entry. T28 in his SPM thread used a 3sma (+1 offset). TradeStation can probably do it. You might be able to ditch the Stoch.
Alpine,
Yes, TS can do it. On displacement, -1 or +1 ? This could very from software to
software.
Anek
Just in case, here is the Hull Moving Average for TS, usually superior to
SMA/EMA etc.
This one changes color too based on slope.
I believe the Zero Line Input would be the displacement/offset input that Alpine
speaks of for this technique, one that I'm still unaware of
![]()
This better be good as adding indicators to my trading sounds like a kick in the
balls but if its for the better, I'll take the hit, ouch!
![]()
Anek
Quote from Anekdoten:
Alpine,
Can you please elaborate on the details of 3MA (+1 offset) ?
Obviously, it is a very fast moving average. Do you mean watching it for entry when price is retracing ?
Anek
Quote from AlpineTrout:
The 3sma should be offset +1 (to the right). On a retracement in an uptrend, an entry can be taken when price closes back above the 3sma. It can also be used as an exit when price closes below it. After an exit, it can be used for re-entry if price has made a HL. Simply re-enter with another close above the 3sma.
IMHO looks like a hull 10 period with +1 displacement works well on a 5000 v es chart. Maybe less evil than sto?
Quote from AlpineTrout:
The 3sma should be offset +1 (to the right).
Quote from Jaxon:
I am playing with the 3sma on Tradestation and it appears that with ts you have to use -1 to move the average to the right, if that is what you want to do. Positive numbers move it to the left.
Hey, thanks for the detailed reply. I am seriously considering opening a
futures account for the reasons you've stated as well as others. I did research
the comparisons of trading futures to equities like you said and found that they
both have their pros and cons. In any case, like I said in my first post I have
always traded using time increments instead of options like Tick like you use. I
was wondering if the transition from time increments to Tick data would be
difficult or if it just merely an adjust and some getting used to? Also... do
you have any other threads going that you op that are similar to this one? Would
just like to follow the others if they exist (gotta know when to pursue the
valuable ![]() . Lastly through
research, it seems like for what I am interested in most trade the YM or ES. I
see that you recently just now changed to the ES. So i was looking for feedback
on which of those two is a better choice based experience and good hard data?
Feedback from Anekdote and any others much appreciated. Thanks!!
. Lastly through
research, it seems like for what I am interested in most trade the YM or ES. I
see that you recently just now changed to the ES. So i was looking for feedback
on which of those two is a better choice based experience and good hard data?
Feedback from Anekdote and any others much appreciated. Thanks!!
Cx~
Cx,
It might not be a completely objective opinion but I traded equities for four
years, they offer VERY little pros in comparison to futures. To each their own.
My suggestion, paper trade for SIX MONTHS MINIMUM before you use a single
dollar. Once you feel comfortable on paper if you see constant profitability,
hard to do within a six month period unless you got the right mindset and tools
from the start (read this journal), then you work on psychology with MINIMAL
contract size in CASH.
Hope it helps.
Anek
Quote from Cxinvest:
Hey, thanks for the detailed reply. I am seriously considering opening a futures account for the reasons you've stated as well as others. I did research the comparisons of trading futures to equities like you said and found that they both have their pros and cons. In any case, like I said in my first post I have always traded using time increments instead of options like Tick like you use. I was wondering if the transition from time increments to Tick data would be difficult or if it just merely an adjust and some getting used to? Also... do you have any other threads going that you op that are similar to this one? Would just like to follow the others if they exist (gotta know when to pursue the valuable
Cx~
Hi,
I am resisting the urge to add anything to my chart right now, just price bars
and Heiken bars. IMHO if I can continue to book profits with just price action
and zippo indicators then when market goes through diff periods as it does of
course (ie, tighter ranges, wider ranges, etc) my eye will be more adjusted to
pure price action vs. looking for an indicator to confirm. I will say though I
do look at between the 40 - 60% retrace level from the prior move to start
focusing on price action in more detail (ie: entry mode) to get me in the trade
as this 40 - 60% seems the either continue back with the trend or fail and start
a new trend zone. I will also draw in the odd trendline here and there. Here is
what my chart looks like:
http://i19.tinypic.com/4tztukw.png
Cheers ![]()
PS: I will occasionally glance at the pivot points for the day as well for
potential support and resistance zones but pure price is where my ultimate
decisions are made.
PPS: I am only voicing my thoughts and what I do right now but I am a rookie so
best to probably ignore my babble and do what Anek and the crew are doing
![]()
Razor,
This is only a test, not a modification.
In order for me to officially go from v1.0 to 1.1 in AHG it has to be a
phenomenal improvement.
You got the right mindset, keep trading with the proven methods. If I find a
modification to the system that is substantially positive it will be announced
as an option. The ultimate decision is yours.
I'm all for don't fix what is not broken but life has taught me that
intransigence and stubburness leads to nothing but trouble. If we find an
improvement that is worth it whether it is suggested by me or Bin Laden himself,
we will share the option for the sake of milking the market.
Anek
Quote from Razor:
Hi,
I am resisting the urge to add anything to my chart right now, just price bars and Heiken bars. IMHO if I can continue to book profits with just price action and zippo indicators then when market goes through diff periods as it does of course (ie, tighter ranges, wider ranges, etc) my eye will be more adjusted to pure price action vs. looking for an indicator to confirm. I will say though I do look at between the 40 - 60% retrace level from the prior move to start focusing on price action in more detail (ie: entry mode) to get me in the trade as this 40 - 60% seems the either continue back with the trend or fail and start a new trend zone. I will also draw in the odd trendline here and there. Here is what my chart looks like:
http://i19.tinypic.com/4tztukw.png
Cheers
PS: I will occasionally glance at the pivot points for the day as well for potential support and resistance zones but pure price is where my ultimate decisions are made.
PPS: I am only voicing my thoughts and what I do right now but I am a rookie so best to probably ignore my babble and do what Anek and the crew are doing
Good stuff! I have been interactive with the markets for some time now, but
have little actual trading experience. I do consider myself ahead though in that
I have allready chosen to bypass the excess and choose to trade only what I see
and what the chart tells me to do. That said, I only trade price action (i make
note of a few small things here and there, but they are miniscule at best). I do
agree with the paper trading. You suggesting that only further implements your
quality that builds this thread. I do respect your opinion between futures and
equities as I agree with its basis. Any other thoughts on my questions about the
transition from time increments to TICK or the ES vs. YM???
Cx~
I hear ya my brutha ![]() I just
know when I start adding stuff I do worse LOL....so for right now gonna just
keep it the way it is, like you say though I am always open to look at new
things and my mind is always in open mode
I just
know when I start adding stuff I do worse LOL....so for right now gonna just
keep it the way it is, like you say though I am always open to look at new
things and my mind is always in open mode
![]()
Cheers ![]()
Quote from Anekdoten:
Razor,
This is only a test, not a modification.
In order for me to officially go from v1.0 to 1.1 in AHG it has to be a phenomenal improvement.
You got the right mindset, keep trading with the proven methods. If I find a modification to the system that is substantially positive it will be announced as an option. The ultimate decision is yours.
I'm all for don't fix what is not broken but life has taught me that intransigence and stubburness leads to nothing but trouble. If we find an improvement that is worth it whether it is suggested by me or Bin Laden himself, we will use it for the sake of milking the market.
Anek
Time to provide input on what's better for entry.
Both indicators are applied on today's ES chart.
Square area marks the clear uptrend.
Your time is appreciated.
Anek
Cx,
Since you are going to be paper trading how about you examine both and you
decide. As far as tick or volume based bars, you can't go wrong there.
Anek
Quick question out of curiousity Anekdote. Why not just trade the etf SPY instead of trading the ES? Any other reasons other than futures accounts require less money?
Quote from Cxinvest:
Quick question out of curiousity Anekdote. Why not just trade the etf SPY instead of trading the ES? Any other reasons other than futures accounts require less money?
If its so monsterous please enlighten us. I find it hard to find thats there
a monsterous difference, unless your refering to the fact that the emini trades
in quarters and the spy trades in pennies.
Please explain!
__________________
Dinoman
Quote from dinoman:
If its so monsterous please enlighten us. I find it hard to find thats there a monsterous difference, unless your refering to the fact that the emini trades in quarters and the spy trades in pennies.
Please explain!
Eh, I guess that leaves it at more leverage, taxes, lower commissions and
possibly more precise consistency of stop fills.
AHHHHH..... ![]()
![]()
![]()
Aside from leverage the spread is possibly the biggest difference that and
the around the clock nature of futures.
A market order is actually better on SPY, depending on # of shares of course,
.01 vs possible 12.50
Anek
Yeah I figured the open hours of the futures market was part of the
reasoning. Well... until i can figure out something else to pick your brain with
i'll sit back and continue to enjoy the oustanding thread. Good trading!!!
Cx~
Cx,
Imagine you are swing trading and something catastrophic happens at 3AM in the
morning. Futures give you the option to bail or solidify your position if you
are on the right side. In equities or ETFs you would need to wait til pre-market
opens to decide. They even give you the option to hedge if you got investments.
They are simply more flexible.
As a very aggressive averaging up trader when things go my way, and panic hits
the market hard the massive leverage provided by futures allows me to keep
averaging up if the trend continues. In SPY I would be limited to 4X, least last
time I checked. That to me is priceless for my particular style of trading.
Anek
Ya that is another awesome point! I don't intend to hold SPY or es mini for
swings though, basically just your typical 9:30 a.m.-4:00 p.m. EST. I'll leave
the swings++ for building wealth in equities.
~Cx
Great little downtrend during afterhours. Managed to short many of the pop
ups, still no higher high so hard to go to bed on this position.
As it keeps going down, I add shorts on the weak pop ups. All stops on what
would be a higher high, signaling a possible change of a trend.
Time to get some coffee could be a long but interesting night.
Anek
Forgot the chart, yep, I'm tired
![]()
500 Share charts due to obvious lower volume of the night.
See that ? That's a sweet sweet downtrend.
Anek
Keeps dropping, adjusted stop a bit with a trail, good night, yep GOOD GOOD
night ![]()
Anek
Still dropping....new LOD.
Support on the multi day chart, covering half, trailing the rest, and really
hittting the sack now.
Anek
Stopped out on the remaining half based on a HH. Profits secured on 2/3rd of
the remaining positions, last add small loss.
Now I can sleep in peace.
Anek
just made a dumb mistake, details later...
![]()
Back for more....
Anek
Im having problems with Quotetracker using volume bars with heiken ashi. The do some weird things. The last price does not match the last on the candle. I may have to look around if I decide to keep using these things. Three shorts so far this morning. Still in the last one.
Highs and lows will differ between Heiken and regular price bars, fwiw
![]()
Quote from GaryN:
Im having problems with Quotetracker using volume bars with heiken ashi. The do some weird things. The last price does not match the last on the candle. I may have to look around if I decide to keep using these things. Three shorts so far this morning. Still in the last one.
1 screwup
1 badly timed short - still not sure what I was thinking.
Now I only see chop (YM)
Quote from Razor:
Highs and lows will differ between Heiken and regular price bars, fwiw
Hey,
Yea I find my trendlines etc move on the volume charts as well.
Quote from GaryN:
Thx. I guess I should read up on the things before using them, huh? Thats not the only thing screw up tho. My trendlines keep moving too. That doesnt happen on time charts. Weird.
Massive profits on this downside move, nothing but LL and LHs.
AHG rules, yes I'm biased!
Anek
Nice work, I am down today......guess why........ been trying to catch this
bottom, so silly........well I am still a work in progress
![]()
Quote from Anekdoten:
Massive profits on this downside move, nothing but LL and LHs.
AHG rules, yes I'm biased!
Anek
Quote from Razor:
Nice work, I am down today......guess why........ been trying to catch this bottom, so silly........well I am still a work in progress
I hear ya Anek, trying to beat these emotional demons....perhaps an answer to
this question will help me, if one were to just take these trend trades as per
your guidance how many days per month roughly will one experience days where the
counter trend action chops you up ? Obviously you can't tell me exactly how 'I'
will perform on a counter trend day but what I am getting at is recently the
markets have been very trendy IMHO which is unusual as compared to action I have
seen over the last 12+ months. Over the course of a 'normal' month how many days
does one see trending action ? The reason I ask this is because I have always
been under the impression that there are only about 2 - 5 trend days per month
with 18 - 15 usually counter trend days etc....I think this is what is causing
me a mental block....thoughts ?
Cheers ![]()
Quote from Anekdoten:
I will say something that will sound mean but should help you.
You went against the trend, you called a bottom, glad you lost, but will be even more glad if you learn the lesson once and for all and stop doing what amateurs and newcomers do.
It's time for you to trade right.
Anek
I'm not a smart man, but you don't need a "Trend Day" to be a ble to catch
intraday trends. Price "trends" all the time. Even range days have short lived
"trends". AHG is about scalping small trend moves to start, then you can add
stuff as you advance.
You shouldn't care WHAT the market does.....find the set ups, enter trade, exit
when market tells you to, and at the end of the day, hopefully, you made money.
If I had to describe today, I'd call it a range day. One with 2 nice
trends.....one up.....one down.....imagine this. Every day the market made
charts that looked like a W or an M......Those would be range bound days....but
each would have numerous INTRA day trends. Different charts....different
trends.......imagine if a chart looked like this WW.....lots of trends, lots of
scalps. / or this \ might not make you alot of money if you get out too soon.
I just thought I'd add my nonsensical 2 cents.
Sorry for the keyboard symbols.....just to lazy to find a chart.
Anek.....can you add a 500 volume Hang Seng Futures chart.....want to see what
it would look like. ![]()
Bog you nailed the concept, hats off.
If someone has the symbol for TS that you request I will gladly post a chart.
Anek
Quote from Bogwaluth:
I'm not a smart man, but you don't need a "Trend Day" to be a ble to catch intraday trends. Price "trends" all the time. Even range days have short lived "trends". AHG is about scalping small trend moves to start, then you can add stuff as you advance.
You shouldn't care WHAT the market does.....find the set ups, enter trade, exit when market tells you to, and at the end of the day, hopefully, you made money.
If I had to describe today, I'd call it a range day. One with 2 nice trends.....one up.....one down.....imagine this. Every day the market made charts that looked like a W or an M......Those would be range bound days....but each would have numerous INTRA day trends. Different charts....different trends.......imagine if a chart looked like this WW.....lots of trends, lots of scalps. / or this \ might not make you alot of money if you get out too soon.
I just thought I'd add my nonsensical 2 cents.
Sorry for the keyboard symbols.....just to lazy to find a chart.
Anek.....can you add a 500 volume Hang Seng Futures chart.....want to see what it would look like.
You can try HSIU7 and HHIU7.....if they don't work try HIU7....
Thanks Anek.
![]()
This is not much different from what Ive been doing, pullbacks and double tops and bottom, but I am always looking to improve. The thing that has been an eyeopener is paying more attention the the sequence of highs and lows. I thought I was aware of the swing highs and lows but apparently it was only halfhearted attention because it does make a great filter. The volume/heikin ashi charts seem to bring this out in a much clearer way. Making new lows as we speak. Yummy.
Great work on this thread Anek and everyone contributing. It's really helping
my learning process.
Quick question for you guys. I know ES,YM,ER2 trading isn't quite as well in the
evening hours. But is there any problem trading pre-market ? For me ideal would
be 5am - 8-am EST. Are these good hours in terms of liquidity and price movement
?
Also any opinions on trading ES from 6pm - 9pm EST. Is there enough action/price
movement
Thanks Guys for the great work !
Booyah,
A chart is a chart but unless it's a special event, lack of liquidity and
volatility could screw with the best ones out there.
Unless you been around the block I advice against trading off market hours.
Anek
Quote from booyah:
Great work on this thread Anek and everyone contributing. It's really helping my learning process.
Quick question for you guys. I know ES,YM,ER2 trading isn't quite as well in the evening hours. But is there any problem trading pre-market ? For me ideal would be 5am - 8-am EST. Are these good hours in terms of liquidity and price movement ?
Also any opinions on trading ES from 6pm - 9pm EST. Is there enough action/price movement
Thanks Guys for the great work !
Quote from Anekdoten:
Booyah,
A chart is a chart but unless it's a special event, lack of liquidity and volatility could screw with the best ones out there.
Unless you been around the block I advice against trading off market hours.
Anek
"We SHORT a pop up and again, we are nimble with our target."
Rinse.Repeat.
+1288
booyah
If you want to go to bed early you can get up around 3:00am and trade the Dax
and Estx50. Really not much different than trading the minis.
Well.....very disappointing day for me....my own fault for trying to fight
the trend but disheartening none the less....Net Down -$441
![]()
Oh well, back at it tomorrow....
edit: over traded as well, 32 round trips....
Trades for 08.09.07
Today I traded without stochastics, instead I tested a very fast MA with an
offset to the right for comparative reasons.
Did I miss the stochs ? No.
5000 shares chart for ES as suspected is my new girlfriend !
11 Shorts
1st Winner
2nd Winner
3rd Winner
4th Hold it right there sir! Stopped out
![]()
5th Winner
6th Winner
7th Winner
8th Break Even got too greedy ![]()
9th Winner
10th Winner
11th Still in the play short....
9 for 11 so far
3 Longs
1st Winner
2nd stopped out
3rd The Double Bottom looked good, so i took it with a 2 tick stop and rode it
for well over 4x reward.
2 for 3
Total: Aprox 11 for 14
The trend is your friend!
We don't' call bottoms, we don't call tops and we never never EVER go against
the immediate trend.
Is it sinking in yet ? ![]()
Anek
nice work
very nice work..but i still cant get a very good handle of this technique..
Question -
In a downtrend if you get a pop up and after that 2 bars with lower low. Will
you enter on close of third bar or 2nd bar.
Whats the ideal stop will be top last high bar.
Say Bar 1 is last high bar then you have Bar2 and Bar3 which creates lower low
will you enter on close of bar4 or Bar3. Where is the stop????
Can you post some chart with SPY volume 1000000 shares.
thanks for help
Re: nice work
Bill,
Here is your chart for SPY.
As far as your entry question, I need to see some sort of signal that the pop up
had enough. Today I was using the fast MA to eyeball the exhaustion but that
thing was pretty fast today, it's slope though was very helpful. There is no
specific rule of 2nd or 3rd bar, I eyeball a good entry and place my limit
orders, sometimes I get lucky, sometimes I miss the move completely but I never
ever chase it.
Hope it helps.
Anek
Quote from booyah:
I see what you're saying Anek. But does the liquidity really die dow after 430, or before the bell around 8am. I'll try to be careful and a noob should play it safe, but it sucks having a fulltime job and living in the EST time zone.
Quote from anvil993:
"We SHORT a pop up and again, we are nimble with our target."
Rinse.Repeat.
+1288
Quote from Razor:
Well.....very disappointing day for me....my own fault for trying to fight the trend but disheartening none the less....Net Down -$441
Oh well, back at it tomorrow....
edit: over traded as well, 32 round trips....
Quote from GaryN:
booyah
If you want to go to bed early you can get up around 3:00am and trade the Dax and Estx50. Really not much different than trading the minis.
What is it with all the new aliases with 0-1 posts sending messages via PM ?
Makes me curious if I'm a newbie magnet or if some of the elite trader "pride"
is hiding their real identity in search for guidance.
Assuming this could be a possibility, I wonder what ever happened to humility
lately.
I have absolutely no complex taking/asking suggestions from Joe.Trader.X or
Tudor Jones. Makes no difference to me, this is not about pride, this is about
getting better, improving your trading, making friends and last but not least
sharing!
Moving on.
Anek
Quote from Bogwaluth:
Anek.....can you add a 500 volume Hang Seng Futures chart.....want to see what it would look like.
Hi Anek,
Will do, no reason why I should not be booking a profit on days like today, sad
really....oh well tomorrow is a new day
![]()
Thanks for the response and encouragement
![]()
Quote from Anekdoten:
Examine your chart, annotate all errors and mistakes. Make an effort to differentiate what was inevitable and what was your fault.
Learn from the above, tomorrow is a new day.
Anek
Quote from Razor:
Hi Anek,
Will do, no reason why I should be booking a profit on days like today, sad really....oh well tomorrow is a new day
Thanks for the response and encouragement
Quote from Jaxon:
1 screwup
1 badly timed short - still not sure what I was thinking.
Now I only see chop (YM)
Bill,
Couple of extra tips for entries that should help you determine optimal areas.
Anek
A. I know you are right about the mental aspect, Lately, though I am not
really a religious person, I am adopting somewhat of a religious take on
trading. If a person believes in a method, they should quit listening to the
DEVIL!
Those pretty indicators, those split second impluses, those quick rushes of fear
or greed. All work for the Devil! Really, I find I overthink myself out of
profit hand over fist. Seems if I just follow the rules, like making widgets,
then the system works as described on the box.
In getting a better feel on when to exit at a S/R level or let it run, It looks
like the let it run approach works best when coming out of an area of
consolodation or range, where we would anticipate to see a breakout run. Sound
about right?
Also, curious on your time zone. Looks like about 5 hours ahead of me here in
North Florda.
Again, Thanks
bmw,
I could not agree more. How about this simple rule ? Unless the indicator
measures price action and by price action I mean highs lows support resistance
allow yourself a maximum of one, your choice. That way your concentration stays
on what matters, price. Remember you look at price first then you get
confirmation from your tools. Not the other way around. Many traders concentrate
on indicators and forget about Gran Daddy, PRICE!
Letting the winners run is not only crucial but could determine the difference
between a poor, good and a great day. Lots of market time should be devoted to
this area. I've said multiple times in this journal it is possibly the hardest
aspect to master too. In my humble opinion, momentum is the key here. Is is
rallying, is it stopping, is it hesitating, in the tape, where is the pressure ?
There should be some extra info about momentum in the journal as well.
As far as location for security reasons I wish to keep all personal details
private.
Anek
Quote from bmwhendrix:
A. I know you are right about the mental aspect, Lately, though I am not really a religious person, I am adopting somewhat of a religious take on trading. If a person believes in a method, they should quit listening to the DEVIL!
Those pretty indicators, those split second impluses, those quick rushes of fear or greed. All work for the Devil! Really, I find I overthink myself out of profit hand over fist. Seems if I just follow the rules, like making widgets, then the system works as described on the box.
In getting a better feel on when to exit at a S/R level or let it run, It looks like the let it run approach works best when coming out of an area of consolodation or range, where we would anticipate to see a breakout run. Sound about right?
Also, curious on your time zone. Looks like about 5 hours ahead of me here in North Florda.
Again, Thanks
Anekdoten...
Why don't you give everybody a thrill and post your trade results each day.
Just post a pic of your PnL... I bet they would get a kick out of that...![]()
Plus they could see right where you entered and exited.
They could really learn a lot from that don't you think?
Quote from version77:
Anekdoten...
Why don't you give everybody a thrill and post your trade results each day.
Just post a pic of your PnL... I bet they would get a kick out of that...
Plus they could see right where you entered and exited.
They could really learn a lot from that don't you think?
The last short is still open.
Why ? Because there is still no reason to cover.
Live chart attached.
Hope it helps.
Anek
Awesome ! ![]()
Quote from Anekdoten:
The last short is still open.
Why ? Because there is still no reason to cover.
Live chart attached.
Hope it helps.
Anek
Since next week will be the end of your journal, I suspect you will get a
barage of questions. So, I'll start now just to break the ice.
I notice you do not re-enter a trade after a loss and have stated so I believe
in this journal. It is a falt that I have. Anything else you may offer on this
subject?
It may be just a judgement call, but on the attached chart from today there is a
high label HH and a low labeled LL. It seems they could be viewed as the
beginning of a congestion, but you took a sell off of the pullback of the next
LL. Are you guided by the previous High and Previous Low rather than the
secondary ones that I labeled? Kind of an obtuse question, but I think it is an
area with which some of us are struggling.
On a pullback, say on a downtrend do you look at the distance in points to the
previous low as a gauge whether or not to take a sell. Since you may exit at or
near that low, do you look for some room for price to move around in?
More to come...........Thanks
B,
The journal, hopefully will keep growing as you guys help each other out. I can
always chip in with ideas or comments. Just hard to keep this rate going when
you have family.
Yes if I get stopped out I suspect change of a trend aka some consolidation
before a new trends develops. I also need to see, and this is very important, IF
it develops one.
I definitely saw that in real time but took a chance and called it "noise" due
to the volatility at hand, valid question though.
When something like that presents itself close stop is always good insurance.
Hope it helps.
Anek
Quote from bmwhendrix:
Since next week will be the end of your journal, I suspect you will get a barage of questions. So, I'll start now just to break the ice.
I notice you do not re-enter a trade after a loss and have stated so I believe in this journal. It is a falt that I have. Anything else you may offer on this subject?
It may be just a judgement call, but on the attached chart from today there is a high label HH and a low labeled LL. It seems they could be viewed as the beginning of a congestion, but you took a sell off of the pullback of the next LL. Are you guided by the previous High and Previous Low rather than the secondary ones that I labeled? Kind of an obtuse question, but I think it is an area with which some of us are struggling.
On a pullback, say on a downtrend do you look at the distance in points to the previous low as a gauge whether or not to take a sell. Since you may exit at or near that low, do you look for some room for price to move around in?
More to come...........Thanks
Quote from Jaxon:
1 screwup
1 badly timed short - still not sure what I was thinking.
Now I only see chop (YM)
Jaxon,
Stop needs to be strategic for whatever reason but strategic, not some fixed
number.
Losses are inevitable but winners very viable so it evens out.
If you don't see an optimal entry then there is no play. Don't force trades,
odds in your favor or back to crossing your arms.
Anek
Quote from Jaxon:
My screwup was moving my stop up too soon which took me out of a trade at a small loss that would have gone profitable fairly quickly. My initial stop would have been untouched.
My badly timed short was almost identical to your 4th short that you got stopped out on, except the pattern occurred earlier in the day , I shorted the last lower high as the trend was changing to "up"
Market was moving sideways from 10:30 to 12:30 eastern time with some LH and HL mixed in with HH and LLs.
I just went through the exercise of walking through the daily bar chart (555 volume YM and 222 volume YM bars) and taking trades based on HH/ HL, LH/LL with entry determined by stoch cross, using as little discretion as possible. I presume close of bar price as my entry. I still am having trouble showing net profit! I get stopped out of a lot of trades, (I use an 8 tic mm stop for YM) and not many of those would have been huge winners anyway. Seems my biggest problem is the sharp moves where there is very little retracement. I have a hard time finding a reasonable entry.
"Throughout all my years of investing I've found that the big money was never
made in the buying or the selling. The big money was made in the waiting."
Jesse Livermore
Anek,
I noticed a potential short on the chart today, and was unclear why you did not
take it. I attached your chart with a couple arrows. The first arrow seems to be
a candidate for a short.
thanks!
jeff
Look how the resistance dots were pushed up constantly. Price had momentum to
the upside, was probably waiting for those red dots to form horizontally and
stabilize.
On top of that I was just coming out of my previous short. Waiting for another
pop up for a good fill is logical.
Also notice how my shorts are usually taken when the resistance dots are pulled
down instead of up. Increases accuracy, you want to short a pop up but the pop
up must at least begin some DOWNSIDE momentum, or at least I try to.
Examine what happened next, resistance dots stabilized, momentum shifted to the
downside, and weeee off we go, and that one I took.
Anek
Quote from jetbird:
Anek,
I noticed a potential short on the chart today, and was unclear why you did not take it. I attached your chart with a couple arrows. The first arrow seems to be a candidate for a short.
thanks!
jeff
After massive consolidation around the LOWS in late night afterhours ES just
broke resistance and moved a few ticks up.
Expecting some rally after that extended congestion period I have elected to
cover my shorts and call it a day/night.
Forgot to mark the mini breakout out of consolidation at the end of the chart
but should be obvious to notice.
I'm very pleased with this trade and should be a good demonstration that when
you are taking a position whether is long or short there should be a reason for
bailing. Since we don't call tops and bottoms we can't say "I think it had
enough" because you never know, let price action decide.
This was a monster trade, aprox 13-14 full points, have not even calculated, all
i know is that I need a bed.
Have a good night all.
Anek
PS: Notice volume bar adjustment to make up for low AH activity.
Sure enough the ES rallied to make higher highs confirming that price action
and the trend are your best odds in trading.
Continuation attached, yep bed time
![]()
Anek
Trading can be addictive. Woke up for a glass of water, saw a play and had to
take it.
Might take tomorrow off for a long weekend with the family. If so back on
Monday.
Be good, and follow that trend.
Anek
Hi Anek,
Do you typically sell into strength on an uptrend(or set a very tight trailing
stop once a price objective has been met)???
I am finding that if you sell on a pullback,you will often sell very close to
the 50% retracement of the prior swing...Or where we should be buying!!!
I should mention that traditional indicators do have merit,just not the way we
have been led to believe.I recently purchased a product which can run thru
thousands of permutations on indicators,and more often than not,the best
approach to applying an indicator was the exact opposite of "conventional
wisdom".As an example,if one is trading %D,it is best to go long when %D crosses
80 to the DOWNSIDE.
If you think about it,it is exactly the point you have been making.
tao
resistance dot
i had been following your writing for a few days...fascinated by what you are
doing... can you tell me how you come up with those resistance dts.
if possible give me the code for plotting those dots..
if anybody else can share that would be gr8 ...i am trying to learn and on
simulator for now.
Two shorts so far this morning. We are forming a nice sym. triangle here.
Theres the old saying that if a triangle breaks one way then reverses and goes out the other side you want to get on board. Sure was the case today but I didnt do any longs. Only had one more short late in the afternoon but overall a very nice day. I am now using a 50k volume chart for primary trend and taking trades in accordence with the hi/lo sequences I see there using a 10k chart for entry. The 5k is a little too fast for me. Cuts down on the number of trades but increases the winners. My win rate has been up pretty dramatically lately but Im sure its because of the overall downtrend. Hard not to make money in a strong downtrend unless your a new trade in which case its easy to lose in any kind of market. Been there, done that. Have a good weekend.
What a symmetric triangle breakout that was. Still breaking out.....
Only play I took today.
Anek
Re: resistance dot
Quote from billdobson1972:
i had been following your writing for a few days...fascinated by what you are doing... can you tell me how you come up with those resistance dts.
if possible give me the code for plotting those dots..
if anybody else can share that would be gr8 ...i am trying to learn and on simulator for now.
Hi,
Ok, tried to take only trend trades today except for the one after the double
top (which I show on chart below).....well guess what the result was, +$333 Net
trading 1 NQ car only (NQ is only worth $20 a point as well !!)......but look at
my exits, left multiple points on the table on almost every trade, I am talking
a easy $1,000 day if I would have been able to capture just some of the move (I
basically exited close to entry on most trades....too scalpish). Please look at
my charts below with all entries and exits and let me know what ya think (red
line shorts, green lines longs and the black lines are the exits with gain or
loss posted next to them).
Cheers and have a great weekend all
![]()
http://i9.tinypic.com/4zcr0xx
edit missed one:
http://i16.tinypic.com/4z1jc6a
http://i12.tinypic.com/62rrecz
http://i16.tinypic.com/5xrau06
http://i15.tinypic.com/661qwzp
http://i18.tinypic.com/66ju3ns
Edit: Had to come back and say MAN DID YOU SEE HOW MUCH I LEFT ON THE TABLE
!!!!!!!!!!!!!!!!!!!!!!!! LOL ![]()
"Let's start with the UPTREND.
We BUY a pullback and we are nimble with our target."
Thanks, coach!
+1737
Mr. Symm sends his regards.
Quote from anvil993:
"Let's start with the UPTREND.
We BUY a pullback and we are nimble with our target."
Thanks, coach!
+1737
Professor, look at my trades above, do I get a gold star for the day ???
![]()
Quote from Anekdoten:
Someone is paying attention in class.
Job well done, love it.
Anek
Razor,
I don't know how to add multiple attachments, perhaps someone can assist.
Here is 1
Razor,
Here is 2
Razor,
Here is 3
Razor,
Here is 4
Razor,
Here is 5 and last.
I think you kicked ass, love the small losses too.
Cheers!
Anek
Hey,
Not sure on the multiple attachments, what I do is just save the files to my
desk top then go to
www.tinypic.com and then upload the files there (takes 2 seconds) then they
give you a link (like the ones I use) to post and you can post multiple links on
one post.....by the way, huge thanks for going over my charts, greatly
appreciated ![]()
Man, huge thanks for your input on my trades, thanks again
![]()
Off to the gym and then a few beers later, have a great weekend Anek and all
![]()
Cheers ![]()
Quote from Anekdoten:
Razor,
Here is 5 and last.
I think you kicked ass, love the small losses too.
Cheers!
Anek
WTG Razor. I wonder why you are using heikin ashi on single colored bars tho. Kind of defeats the purpose doesnt it? I am making this comment because I have found the color coding to be helpful, especially in hanging with a trade. Psycholically easier to stay with a trade when the color matches your position.
Anek , thanks for this jornal .
Triangle action made it a bit tough today for me , this was one clear set up
though .
__________________
Lets all drink to the death of a clown.
Quote from babe714:
Anek , thanks for this jornal .
Triangle action made it a bit tough today for me , this was one clear set up though .
Quote from GaryN:
Psycholically easier to stay with a trade when the color matches your position.
Tao,
Interesting info.
As far as selling into strenght, I base it on momentum. I try not to say, ok
that's enough, I look at the bars, assuming I'm long if I see price going higher
without stopping much there really is no reason to sell. This is where HA help
for when panic, uncertainty and confusion of losing your profits might strike.
You could also say ok if it breaks the low of the last 2-3 bars I'm out.
However, in a sense this is what HA does. Just use what you feel more
comfortable with, the color psychology of HA bars, as Gary so eloquently
described, helps.
Remember guys, I don't use HA bars for entry only for exit but the real skill
here is analyzing momentum and the S/R surroundings as price is going. When it
stops, why did it stop, should i wait, if so how long ? If it retraces, your
stop better be there to secure your profits, not too tight, give it room, use
past bars to have a logical exit.
If you suspect the trend is much too strong but the trail stop got hit, you can
always get back in at the next logical entry.
Anek
Quote from taowave:
Hi Anek,
Do you typically sell into strength on an uptrend(or set a very tight trailing stop once a price objective has been met)???
I am finding that if you sell on a pullback,you will often sell very close to the 50% retracement of the prior swing...Or where we should be buying!!!
I should mention that traditional indicators do have merit,just not the way we have been led to believe.I recently purchased a product which can run thru thousands of permutations on indicators,and more often than not,the best approach to applying an indicator was the exact opposite of "conventional wisdom".As an example,if one is trading %D,it is best to go long when %D crosses 80 to the DOWNSIDE.
If you think about it,it is exactly the point you have been making.
tao
Re: resistance dot
Quote from billdobson1972:
i had been following your writing for a few days...fascinated by what you are doing... can you tell me how you come up with those resistance dts.
if possible give me the code for plotting those dots..
if anybody else can share that would be gr8 ...i am trying to learn and on simulator for now.
Quote from GaryN:
Two shorts so far this morning. We are forming a nice sym. triangle here.
Hi Gary,
This is an issue with esignal, if you look at my last couple of trades posted
you will see the red and green heiken bars, for some reason esignal does not
plot the heiken bars back further than a couple of hours so my trades from the
morning all you are seeing is the regular price bars (which are all black and
overlay the heiken bars, I made them all black so that I only concern myself
with the heiken bars in red and green)....in real time the heiken bars print red
and green so it's ok just is not good when looking back over the day and only
seeing price bars.
Cheers ![]()
Quote from GaryN:
WTG Razor. I wonder why you are using heikin ashi on single colored bars tho. Kind of defeats the purpose doesnt it? I am making this comment because I have found the color coding to be helpful, especially in hanging with a trade. Psycholically easier to stay with a trade when the color matches your position.
Razor,
That was some good trading today. Looking back at your chart your biggest
weakness seems to be letting the winners run.
Take some time off during the weekend to examine/work on that.
There is no reason to sell on strength unless there is sign of weakness and vice
versa for shorts. Study those charts.
It will make an insane difference in your trading if you pull it off.
For me personally it was the difference between profitability and quitting my
day job.
Anek
Cheers Anek for the kind words, I will review charts over the weekend as per
usual ![]()
Quote from Anekdoten:
Razor,
That was some good trading today. Looking back at your chart your biggest weakness seems to be letting the winners run.
Take some time off during the weekend to examine/work on that.
There is no reason to sell on strength unless there is sign of weakness and vice versa for shorts. Study those charts.
It will make an insane difference in your trading if you pull it off.
For me personally it was the difference between profitability and quitting my day job.
Anek
I think Anec is right about letting winners run being the key to getting to the next level. I am getting better at it but still have a ways to go. Small wins cover small losses and keep you in the game as long as you avoid the larger losses but its the occasional home runs that build the account. For me its having faith in the fact that most of the time the last swing high/low (in the right circumstances) will be tested but you also have to learn (beaucoup screentime) to recognize from the tape when it is probably not going to make it.
Quote from Anekdoten:
For me personally it was the difference between profitability and quitting my day job.
Anek [/B]
Razor,
I look at this chart and it's painful for me to see this.
Your entry was incredible but then I can't see a single reason for exiting where
you did. Not one, in fact your exit would had been my entry.
Do not be afraid of a small winning trade becoming a break even one. Move that
stop accordingly and shoot for a good exiting reason.
Your accuracy rate will decrease, less winners more break evens. However, do we
play for small winners ? As bingo said all they would do is offset the small
losses assuming you are disciplined enough to evade the nasty ones.
A good winner once in a while will wipe 3-5 small losers without blinking twice.
Remember, there is no shame in small winners small losses and breakevens, we
need to escape the larger losses but we need large winners to make this game
worth our risks and efforts.
This is how your scalps should look like in terms of amounts and progression.
-50
-75
+0
+0
+300
+0
-100
+75
-100
+350
+0
-75
-50
-100
+0
+0
+0
+300
The hard part is having the proper psychology to handle a bad streak of small
losses and break evens while keeping your guard up.
Nevertheless a small winner becoming a break even or even a small loss is a
psychological hit.
Still we are working as planned because our priorities are preservation of
capital and making the green.
This game is for the most part psychological never forget that.
How do we protect our capital ? With small losses and break even trades while
adjusting our stops in our favor, never against it.
How do we make the green ? Not with extreme accuracy not with small winners but
with medium to big winners AND with patience.
In trading I don't believe in luck, I believe in a solid system, mental
fortitude and the having a brass pair of balls to know and accept that the
market is bigger than you, me and everyone else here but once in a while, if
patient, we can be in perfect harmony with Mr. Market.
You get the picture.
Hope it helps.
Anek
PS: If your accuracy rate is high, then more power to you but this will only
come after years and years of screen time.
Hi Anek,
Yea man I agree with everything you are saying 100% ! Looking over yesterdays'
trades pains me to see how much I left on the table and how poor my exits were
but I also like to look at positives and for the most part at least I actually
traded with the trend most of the day instead of fighting the trend so that is a
positive....also I think that I had some very good entries and my lossed were
nice and small ![]() .....Goal for
next week is to continue to trade with trend, small losses and focus on letting
some trades run fully excepting that I will have more breakevens than winners.
.....Goal for
next week is to continue to trade with trend, small losses and focus on letting
some trades run fully excepting that I will have more breakevens than winners.
Thanks again for your input Anek ![]()
Cheers ![]()
Quote from Anekdoten:
Razor,
I look at this chart and it's painful for me to see this.
Your entry was incredible but then I can't see a single reason for exiting where you did. Not one, in fact your exit would had been my entry.
Do not be afraid of a small winning trade becoming a break even one. Move that stop accordingly and shoot for a good exiting reason.
Your accuracy rate will decrease, less winners more break evens. However, do we play for small winners ? As bingo said all they would do is offset the small losses assuming you are disciplined enough to evade the nasty ones.
A good winner once in a while will wipe 3-5 small losers without blinking twice.
Remember, there is no shame in small winners small losses and breakevens, we need to escape the larger losses but we need large winners to make this game worth our risks and efforts.
This is how your scalps should look like in terms of amounts and progression.
-50
-75
+0
+0
+300
+0
-100
+75
-100
+350
+0
-75
-50
-100
+0
+0
+0
+300
The hard part is having the proper psychology to handle a bad streak of small losses and break evens while keeping your guard up.
Remember a small winner becoming a break even or even a small loss is a psychological hit. Still we are working as planned because our priorities are preservation of capital and making the green.
How do we protect our capital ? With small losses and adjusting our stops in our favor, never against it.
How do we make the green ? Not with extreme accuracy but with medium to big winners.
You get the picture.
Hope it helps.
Anek
PS: If your accuracy is extremely high, then more power to you.
Happy to help, I edited the message and added a few new bits as the kids were
going commando in my office.
..and btw the previous post is precisely how you get to the next level.
Time to study those charts, the same goes for me
![]()
Anek
Quote from Razor:
Hi Anek,
Yea man I agree with everything you are saying 100% ! Looking over yesterdays' trades pains me to see how much I left on the table and how poor my exits were but I also like to look at positives and for the most part at least I actually traded with the trend most of the day instead of fighting the trend so that is a positive....also I think that I had some very good entries and my lossed were nice and small
Thanks again for your input Anek
Cheers
LOL on the kids going commando....I don't have any kids of my own but have
four godkids so I know what ya mean !
![]()
Off to study some charts as well......cheers
![]()
Quote from Anekdoten:
Happy to help, I edited the message and added a few new bits as the kids were going commando in my office.
..and btw the previous post is precisely how you get to the next level.
Time to study those charts, the same goes for me
Anek
Quote from Razor:
Off to study some charts as well......cheers
ROFL......gotta love it ![]()
Quote from Anekdoten:
My old man says preservation of capital is printing a chart, hitting the bathroom, studying it, then wiping your ass with it
Anek
A. I'm sitting here with beer and charts, usual Sat afternoon, and am
puzzling over your averaging up. My quandry is if I see a strong move with
momentum and I enter on a pullback, which I feel may be just part of a big move.
At the next pullback I have 2 options, to take profit on the first entry, let a
second pullback develop and enter with 2 contracts, and so on. That way I have
banked something. The other option is to just hold onto the first and add a
contract on the appropriate signal, while risking a full pullback to breakeven
on the first. A little too complicated for me to backtest. Any thoughts on which
might be the best in the long run?
Thanks,
Don
Don,
Averaging up, in my humble opinion, is only pertinent to those with good
accuracy and a solid understanding of how the market and daytrading works.
Now, it is possibly the last step to good fortune as far as phases and stages.
The concept of only adding to a winning position is phenomenal because by
definition it ensures that your trades are only about small losses, break evens
and small to gigantic wins. Notice this is exactly how I suggest your money
management results should be so it's highly compatible with AHG.
Nevertheless, you need to be able to handle, from a psychological perspective, a
streak of small losses and break evens, in many cases watching small winners
become small losses. This is the negative aspect of averaging up. The positive
aspect is the monumental winners it can and will provide if you do it right.
When I average up, I add to a a winning position on retracements only if the
major trend is intact and healthy always keeping a stop for ALL positions, this
stop strategically placed at a definite change of a trend. As the trade keeps
going in my favor, I keep adding to the position and adjusting the stop, the
stop is the same for all brothers and sisters in the trade. As the trend
develops the trend pivotal point obviously moves up as well.
When the trend ends, you take a small loss/break even on the last position ONLY
or last two depending how flexible you were and all the initial adds collect
massive returns, especially the original one.
It is the holy grail of money management systems BUT for seasoned traders not
for someone who has just starting to get his/her feet wet with a new system.
Averaging up is probably the most important reason as to why I was attracted to
future's leverage. In fact, I've reached 20x with this technique and knowing I
had secured profits on 85% of the adds felt like I was the king of the world. In
the ES I usually trade between 3 to 10 cars depending on the stop risk of the
trade. I have yet to average up aggresively on ES since I'm fairly new to the
contract but when I'm comfortable on a great run this number could go all the
way up to 40-50, without giving too much info on my personal total leverage.
When averaging up, at least on the YM, I have used full leverage on the account
without a single ounce of fear because of secured profits on most of the adds.
When you get a nice run the profits are nothing short of a monstrosity.
Obviously, if the trade does not go in your favor you don't even touch leverage
or add to your position.
Very powerful indeed but requires complete dominance of your psychology.
Anek
Quote from bmwhendrix:
A. I'm sitting here with beer and charts, usual Sat afternoon, and am puzzling over your averaging up. My quandry is if I see a strong move with momentum and I enter on a pullback, which I feel may be just part of a big move. At the next pullback I have 2 options, to take profit on the first entry, let a second pullback develop and enter with 2 contracts, and so on. That way I have banked something. The other option is to just hold onto the first and add a contract on the appropriate signal, while risking a full pullback to breakeven on the first. A little too complicated for me to backtest. Any thoughts on which might be the best in the long run?
Thanks,
Don
Rule Two: Press your winners
Phantom of the Pits
http://www.webtrading.com/phantom/chapter6.htm
Averaging up illustration on the daily dow when it was trending strongly.
No, I did not do this, I wish I had though.
However, I have accomplished something similar during strong intraday trends.
You might ask yourself, why not start with 12 and move your stop accordingly as
higher highs and higher lows are made ?
The answer is naturally risk management. If you were wrong from the start you
take a full stop on a full leveraged position, not exactly how we want to trade
and protect our capital.
Averaging up is great stuff.
Anek
“When I am bearish and I sell a stock, each sale must be at a lower level
than the previous sale. When I am buying, the reverse is true. I must buy on a
rising scale. I don’t buy long stock on a scale down, I buy on a scale up.”
“Remember that stocks are never too high for you to begin buying or too low to
begin selling. But after the initial transaction, don’t make a second unless the
first shows you a profit. Wait and watch.”
Jesse Livermore
Yep, he certainly knew what to do albeit many times he did not do what he
KNEW he had to do.
Lack of discipline I guess, we have all visited that point sometime during our
trading careers.
Anek
Quote from anvil993:
�When I am bearish and I sell a stock, each sale must be at a lower level than the previous sale. When I am buying, the reverse is true. I must buy on a rising scale. I don�t buy long stock on a scale down, I buy on a scale up.�
�Remember that stocks are never too high for you to begin buying or too low to begin selling. But after the initial transaction, don�t make a second unless the first shows you a profit. Wait and watch.�
Jesse Livermore
Quote from Anekdoten:
. . .as the kids were going commando in my office.
Re: Re: resistance dot
Quote from Anekdoten:
Bill,
Krelisk.com has a LOT of price action based indicators they are coded by TRO. They are free, help yourself and don't forget to thank the guy.
Anek
Re: Re: Re: resistance dot
Bill,
{ _TRO_Dynamic_FibsSR - draw fibs between the Support/Resistance lines }
{Attn: TradeStation
if this indicator is posted on the TradeStation Forum, I, TheRumpledOne, did NOT
post it there,
so I can't be blamed for this indicator having my contact info.}
{Programmer: Avery T. Horton, Jr. aka TheRumpledOne,
gifts and donations accepted, PO Box 43575, Tucson, AZ 85733 }
{ © Copyright 2006 Avery T. Horton, Jr.}
inputs:
iStartDate(1060120), // if not intraday, date to start counting
iPrice( Close ),
iDecimals(2),
iPeriods(5),
// iHigh( HighD(0) ),
// iLow( LowD(0) ),
iFibPlot("R"), // "P" = projections, "R" = retracements
//iFib1(.24),
//iFib2(.38),
iFib3(.50),
//iFib4(.62),
//iFib5(.76),
//iFib1Color(darkcyan ),
//iFib2Color(darkbrown),
iFib3Color(darkgray),
//iFib4Color(darkbrown ),
//iFib5Color(darkcyan ),
HighColor( red),
LowColor( blue),
idummy("");
variables:
//xFib1(iFib1),
//xFib2(iFib2),
xFib3(iFib3),
//xFib4(iFib4),
//xFib5(iFib5),
tFib(""),
xLowestLow(0),
xHighestHigh(0),
xRange(0),
xPosition(0),
oExtremeVal( 0 ),
oExtremeBar( 0 ) ;
variables:
xBars( 0 ),
xPeriods(05),
xOldPeriods(0),
Dynamic_R( 0 ),
Dynamic_S( 0 ),
OldDynamic_R( 0 ),
OldDynamic_S( 0 ),
PrevDynamic_R( 0 ),
PrevDynamic_S( 0 ) ;
{commentary variables}
variables:
xcomm(0),
oComm1( "" ),
oComm2( "" ),
oComm3( "" ),
oComm4( "" ),
oComm5( "" ),
oComm6( "" ),
oComm7( "" ),
oComm8( "" ),
oComm9( "" ),
oComm10( "" );
{ CALCULATIONS }
If date this bar >= iStartDate
then begin
{save old values}
If Dynamic_R <> PrevDynamic_R
then OldDynamic_R = PrevDynamic_R;
If Dynamic_S <> PrevDynamic_S
then OldDynamic_S = PrevDynamic_S ;
OldDynamic_R = PrevDynamic_R ;
OldDynamic_S = PrevDynamic_S ;
PrevDynamic_R = Dynamic_R ;
PrevDynamic_S = Dynamic_S ;
{ high / low for period }
xBars = xBars + 1;
oExtremeVal = Extremes( L, iPeriods, -1, Dynamic_S , oExtremeBar ) ; // lowest
low
oExtremeVal = Extremes( H, iPeriods, 1, Dynamic_R , oExtremeBar ) ; // highest
high
If Dynamic_R <> H
and Dynamic_R < PrevDynamic_R
then if PrevDynamic_R <> 0
then Dynamic_R = PrevDynamic_R;
If Dynamic_S <> L
and Dynamic_S > PrevDynamic_S
then if PrevDynamic_S <> 0
then Dynamic_S = PrevDynamic_S;
{
If iLow <> iLow[1]
Or iHigh <> iHigh[1]
then begin
}
If iFibPlot = "R"
Or iFibPlot = "r"
then begin
xLowestLow = Dynamic_S ;
xRange = Dynamic_R - Dynamic_S ;
//xFib1 = iFib1 * xRange + xLowestLow;
//xFib2 = iFib2 * xRange + xLowestLow;
xFib3 = iFib3 * xRange + xLowestLow;
//xFib4 = iFib4 * xRange + xLowestLow;
//xFib5 = iFib5 * xRange + xLowestLow;
end // If iFibPlot = "R"...
else Begin
// oExtremeVal = Extremes( iLow[iPeriods], iPeriods, -1, xLowestLow ,
oExtremeBar ) ; // lowest low
// oExtremeVal = Extremes( iHigh[iPeriods], iPeriods, 1, xHighestHigh ,
oExtremeBar ) ; // highest high
xLowestLow = Dynamic_S ;
xHighestHigh = Dynamic_R ;
xRange = xHighestHigh - xLowestLow;
If close > OpenD(0)
then begin
//xFib1 = iFib1 * xRange + xHighestHigh; // high projections
//xFib2 = iFib2 * xRange + xHighestHigh;
xFib3 = iFib3 * xRange + xHighestHigh;
//xFib4 = iFib4 * xRange + xHighestHigh;
//xFib5 = iFib5 * xRange + xHighestHigh;
end
else begin
//xFib1 = xLowestLow - iFib1 * xRange ; // low projections
//xFib2 = xLowestLow - iFib2 * xRange ;
xFib3 = xLowestLow - iFib3 * xRange ;
//xFib4 = xLowestLow - iFib4 * xRange ;
//xFib5 = xLowestLow - iFib5 * xRange ;
end;
end;
// end; { If iLow <> iLow[1]... }
//Plot1(xFib1 , "fib1", iFib1Color ) ;
//Plot2(xFib2 , "fib2", iFib2Color ) ;
Plot3(xFib3 , "fib3", iFib3Color ) ;
//Plot4(xFib4 , "fib4", iFib4Color ) ;
//Plot5(xFib5 , "fib5", iFib5Color ) ;
Plot6(Dynamic_R , "Resistance", HighColor ) ;
Plot7(Dynamic_S , "Support", LowColor ) ;
end; // If date >= xStartDate
CommentaryCl( "Dynamic_R: ", NumToStr( Dynamic_R , iDecimals) );
CommentaryCl( "Dynamic_S: ", NumToStr( Dynamic_S , iDecimals) );
Bingo,
Beautiful stuff, right on too. Thanks.
Quote from Bingoking:
And that's what makes all our efforts worthwhile doesn't it.
Couldn't but help think of this:
The Children's Hour
Poem lyrics of The Children's Hour by Henry Wadsworth Longfellow.
Between the dark and the daylight,
When the night is beginning to lower,
Comes a pause in the day's occupations,
That is known as the Children's Hour.
I hear in the chamber above me
The patter of little feet,
The sound of a door that is opened,
And voices soft and sweet.
From my study I see in the lamplight,
Descending the broad hall stair,
Grave Alice, and laughing Allegra,
And Edith with golden hair.
A whisper, and then a silence:
Yet I know by their merry eyes
They are plotting and planning together
To take me by surprise.
A sudden rush from the stairway,
A sudden raid from the hall!
By three doors left unguarded
They enter my castle wall!
They climb up into my turret
O'er the arms and back of my chair;
If I try to escape, they surround me;
They seem to be everywhere.
They almost devour me with kisses,
Their arms about me entwine,
Till I think of the Bishop of Bingen
In his Mouse-Tower on the Rhine!
Do you think, o blue-eyed banditti,
Because you have scaled the wall,
Such an old mustache as I am
Is not a match for you all!
I have you fast in my fortress,
And will not let you depart,
But put you down into the dungeon
In the round-tower of my heart.
And there will I keep you forever,
Yes, forever and a day,
Till the walls shall crumble to ruin,
And moulder in dust away!
My dad had that one memorized. I know I had a place "in the round tower of my [his] heart."
Quote from GaryN:
Im having problems with Quotetracker using volume bars with heiken ashi. The do some weird things. The last price does not match the last on the candle. I may have to look around if I decide to keep using these things. Three shorts so far this morning. Still in the last one.
Quote from GaryN:
you also have to learn (beaucoup screentime) to recognize from the tape when it is probably not going to make it.
Thanks and questions
Thanks indeed Anek for this insightfull thread. Thanks also to other
participants.(Special thanks also to ST)
I see that exits are paramount and maybe make the difference and I have some
questions:
If one has not the luxury of trading multiple contracts, how do you decide
between taking profit objectives or letting the market take you out?
Apart from obvious support/resistance, how do you decide your profits
objectives? Some ratio to initial stop risk, some ratio to the previous
move,....?
Thanks again
Quote from billdobson1972:
did you ever figure out why its doing that..i think i need t first study or have a primer on heiken ashi
Quote from Anekdoten:
Assuming the entry was logical, that is what trailing stops are for, whether they are predetermined or managed manually.
I prefer the manual approach.
Anek
Quote from GaryN:
I trail stops once it gets going. I was referring to those times when it never gets going but starts stalling out shortly after entry. Sometimes this happens even with a logical entry. As you have said, the good ones usually go your way right away.
Quote from GaryN:
I trail stops once it gets going. I was referring to those times when it never gets going but starts stalling out shortly after entry. Sometimes this happens even with a logical entry. As you have said, the good ones usually go your way right away.
Some AH fun tonight.
Managed to ride many of the little bullish upside moves but not in an optimal
way.
Attached little AH action reference for further study.
Note to self: Don't forget this price action pattern it's valuable.
Anek
The very same consolidation from another angle. Can't get a better entry on
this uptrend ![]()
Anek
Quote from Anekdoten:
Some AH fun tonight.
Managed to ride many of the little bullish upside moves but not in an optimal way.
Attached little AH action reference for further study.
Note to self: Don't forget this price action pattern it's valuable.
Anek
Quote from GoodGame:
What do you mean by breaking out by one tick? I can't find the one tick breakout from the low unless you are talking about the last and successful breakout?
I did some scalps today, mostly based on S/R, some worked well some did not
and when they did not small stop as always.
I did not trade the morning because I was fairly active in the late hours of the
night in afterhours and needed rest. Glad I did as the morning was quite choppy
and afterhours was sensational.
Attached the best play of the day for me, once again symm triangles prove to be
one of the best patterns in trading.
Anek
Pretty choppy day alright. Only one trade for me. Shorted the double top when those three bars failed to take out 70.25 after stalling there earlier. Targeted the previous swing low.
morning trades?
hi anekdoten, i wanted to try this out.....this is actually the same thing as
what i am practicing, but minus the moving averages....But then if you see HH
and HL, you dont need a moving average to tell you its in an uptrend. As they
say, keep it simple! I have stochastics on my chart, but ill get rid of it as
they do not help me.
What i wanted to ask is I dont have time to trade all day, just an hour at the
start of the day. You think this is feasible to trade for that time? I am
talking between 1 to 2 trades
Thanks
Re: morning trades?
Quote from artieboy:
hi anekdoten, i wanted to try this out.....this is actually the same thing as what i am practicing, but minus the moving averages....But then if you see HH and HL, you dont need a moving average to tell you its in an uptrend. As they say, keep it simple! I have stochastics on my chart, but ill get rid of it as they do not help me.
What i wanted to ask is I dont have time to trade all day, just an hour at the start of the day. You think this is feasible to trade for that time? I am talking between 1 to 2 trades
Thanks
Quote from GaryN:
Pretty choppy day alright. Only one trade for me. Shorted the double top when those three bars failed to take out 70.25 after stalling there earlier. Targeted the previous swing low.
Done for the day +$223 Net on 12 trades
![]()
Scalped out to quickly on some trades again but working on holding longer still
![]()
Re: Re: morning trades?
Quote from Anekdoten:
You would be better of swing trading then.
My 02 cents.
Anek
__________________
Vienna
Keep them coming.....
Anek
Re: Re: Re: morning trades?
Quote from Vienna:
Hi Anek,
Interesting thread.....somewhere you said you suck at swingtrading... why do you think that is? It seems your method should lend itself to that... actually, that's pretty close to what I am doing.
Quote from Razor:
Done for the day +$223 Net on 12 trades
Scalped out to quickly on some trades again but working on holding longer still
Cheers ![]()
Quote from Anekdoten:
Morning was tough, was lucky enough to evade it by being asleep due to intense afterhours otherwise I would have had some small losses there for sure.
Great job on the green Razor.
Anek
106 points in the YM today. This is as close to the zone as I've ever gotten.
I haven't got the hang of entry with the 3sma+1 shift, though. Anek, may I ask
how are you using it for entries?
Quote from xiaodre:
106 points in the YM today. This is as close to the zone as I've ever gotten.
I haven't got the hang of entry with the 3sma+1 shift, though. Anek, may I ask how are you using it for entries?
Quote from xiaodre:
106 points in the YM today.
Quote from bigbadbaz:
Ahhh the ole zero line conundrum.. it's all interpretation Holmes.. indicators are a good servant but a poor master
If an indicator is taking trades away from you then you are letting it influence you instead of working it to unveil the price action your brain unconsciously recognizes
Quote from Stealth Trader:
If you should be interested, here is a marked chart of what I was looking at today.
st
That long did'nt go anywhere for me , should have taken the previous two entry opportunities .
__________________
Lets all drink to the death of a clown.
Quote from billdobson1972:
Hi St,
yor chart looks neat, would you mind posting code for printing those HH,HL,LL how many bars are you considering
After the initial opening thrusts, looks to be a bit choppy on the YM. HL and
LHs, LLs and HHs...
I guess I have a bit of a hard time waiting sometimes.
And thanks for the congratulations, but thanks for the thread more importantly.
I owe it to you and the peeps contributing here.
Quote from xiaodre:
After the initial opening thrusts, looks to be a bit choppy on the YM. HL and LHs, LLs and HHs...
I guess I have a bit of a hard time waiting sometimes.
500 constant volume and 1000 constant volume charts, and 5000 and 25000
constant volume charts for reference.
Yeah, it's been really trendy after that choppy patch between 9:50 and 10:05
eastern. Guess I was looking for a reason to complain and/or post...![]()
This is the YM...
Awesome morning. Looks like we are going to test the lows. If 1433 doesnt hold it could get really bloody.
![]()
__________________
Lets all drink to the death of a clown.
![]()
![]()
PM chart looks just like the AM chart. See if they can take out 33 before the day is over. The volume charts are pretty awesome in a trending environment.
Quote from GaryN:
PM chart looks just like the AM chart. See if they can take out 33 before the day is over. The volume charts are pretty awesome in a trending environment.
__________________
Lets all drink to the death of a clown.
Hi,
Net down -$24 on 22 trades NQ. Did not capatilize on a nice day but was down
$200 by mid-day so happy with the end result. Back at it tomorrow
![]()
Cheers ![]()
Trades for 08.14.07
What can i say. I love my system, I love to trade and I love days like today.
..and I wish anyone struggling will simply read this journal because the feeling
is just splendid and quite lucrative.
Longs
5 Total
1 Break Even
2 Loser
2 Winners (both home runs)
Shorts
14 Total
3 Break Even ( I really wanted big runners today, price to pay)
2 Losers
9 Winners (4 averages up here)
Total
Sick profits and nothing and I mean nothing but what I've been teaching here.
Anek
PS: Two symmetric triangles NOT annotated on chart played for additional gains,
both worked great, as usual.
Razor, That is sure a lot of trades. What timeframe is this?
A post of a chart with trades shown might provide you with some helpful
comments. NOt from me, but perhaps from A.
My chart downloading alright ?
Hi bmw,
Not really IMHO, look at Anek he had 19 trades today I did 22 not that far off,
just need to keep improving but happy with a breakeven day (well -24) after
being down $200 in the morning.
Didn't mark up charts with trades today in real time so may do that tomorrow and
post a chart for peops in here to see.
Cheers ![]()
PS: NQ, 400 volume bars
Quote from bmwhendrix:
Razor, That is sure a lot of trades. What timeframe is this?
A post of a chart with trades shown might provide you with some helpful comments. NOt from me, but perhaps from A.
Quote from Anekdoten:
My chart downloading alright ?
Second try for chart.
Cool !
Quote from Anekdoten:
Second try for chart.
no problem downloading your chart....enclose the triangles...would love to
see them,cheers![]()
V,
Will do so after eating, could not even stop to eat today, market was too pretty
![]()
Anek
That chart is a really good demonstration of what its all about. The losers only add to the validity of the system. I only had 8 trades but the ones I did matched up with yours pretty closely.
Quote from vinc:
no problem downloading your chart....enclose the triangles...would love to see them,cheers
Garry,
I just can't tell the difference between a regular triangle and a symetrical one
/hope there is one ![]() /,have to get
used to them as they seem a good play..that's why I'm asking..
/,have to get
used to them as they seem a good play..that's why I'm asking..
Quote from vinc:
Garry,
I just can't tell the difference between a regular triangle and a symetrical one /hope there is one
Gary
thanks a lot...just can't spot those little m-s
![]() , sort of triangle blind..need
more practice I guess,thanks again..
, sort of triangle blind..need
more practice I guess,thanks again..
Remember, a symmetric triangle requires two higher lows and two lower highs.
Price gets trapped, then you look out for escaping side and ride it.
Anek
Vinc
Draw trendlines. What else have you got to do when youre not in a trade? Every
trend change begins with a trendline break. There is no better indicator out
there, imho.
and I was just tying to figure out how you guys draw those lines! and you
come up with definition.. Anek,I really appreciate your input,I think you woul
be an exellent teacher ![]() if I ever
make any money trading this method I think I'm going to donate some of it
following your suggestions
if I ever
make any money trading this method I think I'm going to donate some of it
following your suggestions![]()
Here they are:
Here is the Long Symm, real easy to spot.
Anek
Here is the Short Symm, slightly harder to spot due to tight congestion. To
be honest I'm not sure if this even qualifies.
You can see how the Long Symm was more obvious to detect.
Thought it had been an additional play but it's one of the shorts I took on the
main chart was this one as well, so that leaves only the long symm as the extra
play.
Anek
If you become an expert at detecting symmetric triangles you cannot lose in
the long run if you play them right.
Here is a scenario:
Since they are semi rare....
Load NQ
Load YM
Load ER2
Load ES
Two different time frames to increase chances of them developing. Say one LCD
for each emini, a smaller timeframe, and a slightly bigger one.
Using some sort of programmatic alert you could just wait patiently for them or
just go with the multiple monitors approach.
The reason I like them so much is because their rate of success is above 50% and
their targets can be exponentially bigger than the stops. And that's the right
way to trade.
As I said in the journal I know people who live off them, they trade nothing
else. They wait patiently for the formation, very lucrative stuff.
Anek
yeah,the first one looks like double bottom to me.. that's why I can never be sure..
Here is a play I took months ago in the YM. It worked out so well I took a
screenshot and kept it for references. Glad I did cause now I can show you guys.
Anek
Anec
Could you include the timebar in your charts please. The only ones I see that
fill the bill are around 9:34 and 14:58 EST.
Quote from vinc:
yeah,the first one looks like double bottom to me.. that's why I can never be sure..
Quote from vinc:
and I was just tying to figure out how you guys draw those lines! and you come up with definition.. Anek,I really appreciate your input,I think you woul be an exellent teacher
the last one you posted reminds me of a wolfe wave in a way and I don't mean
to be ironic here..well,whatever..be it d.bottoms or w.waves..if it brings us
some green means it works![]()
Gary,
I took two, not at all three.
Just like I suck at swing trading due to the necessity of larger stops I have
trained my eye to spot them. Again, got to concentrate on your forte.
Anek
Quote from monti1a:
FWIW
Tradestation has a Penant Breakout Showme study that can be adjusted to pick up some symmetrical triangles...
However, I believe the best software on the market is "your own Eye"...imho
OK Thx. I see the third one now. My charts are compressed quite a bit more
than yours. I will try exanding my charts a bit.
edit: Also clearer on the 5k. Might try that too. Too much fun.![]()
We interrupt this journal to celebrate and welcome the return of Diamond Dave
to Van Halen!
/drool
Anek
Quote from xiaodre:
I haven't got the hang of entry with the 3sma+1 shift, though.
Quote from Anekdoten:
Monti,
I have tried the Pennant show me but as you said there is nothing like the eye.
I have been unsuccessful at obtaining an ELD for Tradestation the facilates the search for them, aside from the show me you mentioned.
I can spot them with ease but I could use assistance if I was looking at four eminis with two different timeframes.
Could you please post the settings you got for the pennant show me ? Perhaps it can be useful to me.
Thank you.
Anek
Quote from monti1a:
Anek..actually, I don't use that canned Tradestation showme...I simply "eyeball" the chart...the default setting can, however, be adjusted....
Symmetrical triangles appear to show up easily (FOR ME) on the 15 minute and 7 minute BAR chart....and I emphasize BAR CHART....place both charts side by side....They appear more clearly on bar charts (FOR ME) than Candlestick charts.
Also, they tend to form when the market quiets down..
On a side note....very nice thread you have here....
Quote from Razor:
Hi,
Net down -$24 on 22 trades NQ. Did not capatilize on a nice day but was down $200 by mid-day so happy with the end result. Back at it tomorrow
Cheers
Anek,
I grew up on Sammy, 51/50 still rocks.
![]() I would be surprised if they
actually complete the tour.
I would be surprised if they
actually complete the tour.
Your entries often are excellent. If you could shed some light on how you can
consistenly enter at the right time I would appreciate it.
1. Do you sometimes pick a price to buy/sell based on 50% retracement percentage
if it lines up well with a pivot/trendline?
2. You mentioned before that you read tape. Are you entering the market
sometimes based on time and sales action on a retracement?
3. Do you ever place stop market orders above/below resistance(on a retracement)
to enter the market?
4. Do you use a smaller timeframe (tick/volume) chart to identify when to enter
the market?
thanks!
Quote from Anekdoten:
No shame in small losses!
Keep practicing.
Anek
Quote from monti1a:
.but the absolute worse thing a trader can do is sell a large part of his position at a close profit target (ex., 4, 5, 6 ticks)....trust me..it's a zero sum to losing game....the money is made on the large winners
Quote from jetbird:
Anek,
I grew up on Sammy, 51/50 still rocks.
Your entries often are excellent. If you could shed some light on how you can consistenly enter at the right time I would appreciate it.
1. Do you sometimes pick a price to buy/sell based on 50% retracement percentage if it lines up well with a pivot/trendline?
2. You mentioned before that you read tape. Are you entering the market sometimes based on time and sales action on a retracement?
3. Do you ever place stop market orders above/below resistance(on a retracement) to enter the market?
4. Do you use a smaller timeframe (tick/volume) chart to identify when to enter the market?
thanks!
Anec
Do you have the dynamic s/r code in an eld file? The charting I am using will
import TS easylanguage files but Im not sure how to just put it in there with
the code you posted awhile back.
Here you go.
Anek
Thanks. Training my eyes to pay more attention to those triangles.![]()
AHG style trade caught triangle break out
__________________
Lets all drink to the death of a clown.
Just noticed the YM making a higher high, and the ES did not. For those
trading the YM it may pay to keep a chart of the ES up, as it seems to be a more
reliable indicator of moves. ![]()
Public announcement:
THE TREND IS YOUR FRIEND ![]()
Hi,
I have a buddy that has TS, I have esignal. Can someone with TS help me with
where to tell him to find the Heiken Ashi bars or post the formula.
Cheers ![]()
Today had it all. Pullbacks. Triangles. A beautiful double top (my favorite trade in a downtrending market). And still making new lows. Daytraders paradise.
Don Perignon, on me!
Anek
Razor,
Here you go.
Anek
Cheers ![]()
Quote from Anekdoten:
Razor,
Here you go.
Anek
One last triangle for dessert.
Gary,
...and what a beauty it was!
Anek
Net down -$372 on 19 trades NQ, was up $200 by first hour of the day, for
some reason got this bias in my mind that we would be up huge today, proceeded
to fight the trend all day (yup, stupidity) and viola ! down huge on the
day......tomorrow is another day.....we shall see...
Cheers ![]()
Trades for 08.15.07
They say a picture is worth a thousand words, therefore I'll let my chart do the
talking.
Once again, nothing but the system.
Anek
Awesome, I am such a putz fighting this darn trend.....
Quote from Anekdoten:
Trades for 08.15.07
They say a picture is worth a thousand words, therefore I'll let my chart do the talking.
Once again, nothing but the system.
Anek
Razor
Until you stop fighting the trend, I'm not responding to your messages or PMs.
If you are going to fight the trend or make predictions you are on the wrong
journal my friend.
You know what you have to do, and when you do it you either make money or lose
small. WTF Man!
Hope it helps.
Anek
I hear ya and don't blame ya......
Quote from Anekdoten:
Razor
Until you stop fighting the trend, I'm not responding to your messages or PMs.
If you are going to fight the trend or make predictions you are on the wrong journal my friend.
You know what you have to do, and when you do it you either make money or lose small. WTF Man!
Hope it helps.
Anek
Quote from Razor:
Net down -$372 on 19 trades NQ, was up $200 by first hour of the day, for some reason got this bias in my mind that we would be up huge today, proceeded to fight the trend all day (yup, stupidity) and viola ! down huge on the day......tomorrow is another day.....we shall see...
Cheers
Quote from Anekdoten:
Don Perignon, on me!
Anek
__________________
Joe.
Quote from u21c3f6:
His brother Dom makes a better product.
Quote from u21c3f6:
Don't fight the trend!
Yeah, I was down -39 points on YM this morning. Frustrating. Took a nap for
hour half. Awoke refreshed.
And WOW what an afternoon !! The last couple hours of Trading is what
implementing AGH is all about. A Beautiful Beautiful downtrend with so many
ample opportunities to short the popups !! Just remember to "be nimble with your
target" ![]()
The morning was stll a downer since I usually don't ever have such a bad
session.
But I Ended up +1 for the day after racking up +40 points in last 1.5 hour of
day !!
P.S. Anek, heres something that might add another tool in the Arsenal with the
HH HL method. Of course identifying trends during the day is what we are looking
for. And I have taken it one step further with what I learned from Alex at
Puretick 5 months ago. That is at beginning of day identify the tone of the
Market by using Filters. This is more of a general trend for the day using daily
Pivot point, 15 min Range, A/D, . And once the Filters has been established
whether it be Bullish or Bearish then trade the HH HL Method. But do it in
accordance with the Filters for the day. If we are way below Daily Pivot Point
and A/D is very Bearish then adjust your position size accordingly. So for
instance if we see an intra day HH HL intra day Trend on a Bearish filter day we
might enter long on a pullback but only with 1/2 of our regular position size.
But when we later in day see LH LL we might short a pop up with full position
sizing since filters have been established (and have remained) as bearish. And
we are just putting the odds more in our favor by trading with the general
trend.
Just a little tidbit I thought that I would share that has been helpful in
mitigating risk for me and maiming profitability.
Quote from Anekdoten:
Trades for 08.15.07
They say a picture is worth a thousand words, therefore I'll let my chart do the talking.
Once again, nothing but the system.
Anek

Last sentence should be "maximizing" not "maiming" profitability
![]()
Jimmy,
Play it out let me know how it goes for you.
Frankly, I like to keep it simple, the more crap I add the more conflicting
stuff I get.
For what is worth I don't use any filter except once in a while I like to look
at the slope of A-D or it's value to see how drastic things are in terms of
power or weakness.
Please try it out and report back if you can.
For now, I feel quite at home just with highs and lows plus Trendlines, it is
really all you need.
Say the market is up 100 points, clearly above daily pivot, above the 15 min
opening range, above yday's high, the A-D are positive, etc etc etc but the
market decides it had enough. Sounds familiar ?
The filters will give you a bias, and my friend, THAT IS THE LAST THING YOU
NEED.
Needless to say, don't ditch something because I said so, trading is very
personal.
Thanks,
Anek
Quote from Anekdoten:
Jimmy,
Play it out let me know how it goes for you.
Frankly, I like to keep it simple, the more crap I add the more conflicting stuff I get.
For what is worth I don't use any filter except once in a while I like to look at the slope of A-D or it's value to see how drastic things are in terms of power or weakness.
Please try it out and report back if you can.
For now, I feel quite at home just with highs and lows plus Trendlines, it is really all you need.
Say the market is up 100 points, clearly above daily pivot, above the 15 min opening range, above yday's high, the A-D are positive, etc etc etc but the market decides it had enough. Sounds familiar ?
The filters will give you a bias, and my friend, THAT IS THE LAST THING YOU NEED.
Needless to say, don't ditch something because I said so, trading is very personal.
Thanks,
Anek
Here's another approach: turn off everything on your chart and just watch
price. Don't do any trades, don't watch CNBC, don't watch Bloomberg, don't read
ET posts ,don't read this thread. Don't do anything. JUST WATCH.
Then maybe after a week of watching ask yourself: If I want to take money out of
this market what do I need to do and where do I need to be?
I have found Trin, AD, Ticks to be a total waste of time for trading ES. Do
some studies. These things follow ES rather than lead it. This is why they are
called FUTURES!! They lead the way![]()
Quote from GaryN:
I have found Trin, AD, Ticks to be a total waste of time for trading ES. Do some studies. These things follow ES rather than lead it. This is why they are called FUTURES!! They lead the way
ES Short update.
ES currently at 1409, still short on a semi heavy averaged up position that
began and 1433.25 but still enough leverage available to press it further.
Will consider adding to the position on pop ups that do not make a HH from my
last add, if that happens I get stopped out on all adds and collect the gains.
Hopefully some panic kicks in soon, major levels were broken. At this point
trading with markets money. Not calling a bottom, I'll let the market tell me
when it had enough on this play.
Anek
A. I am still having a problem with the process of adding positons. Only
working on this with sim right now. After the first swing is made, there is a
clear place to place a stop, but I am not clear on your actions during the first
few minutes of a trade.
When, do you move to a break even stop, or lower original stop, if ever.
Sorry, if you have already answered this earlier.
I have made considerable progress with your help. There is nothing on my screen
but HA and trendlines as needed.
Thanks,j
Don
Don,
I add to a position when I feel the trend is stronger than usual. For instance,
today's double top followed by furious downside pressure on a bearish market was
a good one.
I usually begin to add to the position when price pops but still in a trend
where the stop of the second position can secure profits on the first position.
Remember that I use the same stop for all adds including the original but it is
trailed. Usually this stop is a HH or a LL depending on orientation.
Anek
Quote from bmwhendrix:
A. I am still having a problem with the process of adding positons. Only working on this with sim right now. After the first swing is made, there is a clear place to place a stop, but I am not clear on your actions during the first few minutes of a trade.
When, do you move to a break even stop, or lower original stop, if ever.
Sorry, if you have already answered this earlier.
I have made considerable progress with your help. There is nothing on my screen but HA and trendlines as needed.
Thanks,j
Don
Cuttin the BS and trading strictly with the trend tomorrow and in the future
unless confirmed trend change (by either HH and HL or LL and LH) double bottom
or double top.....gonna mark my trades on the chart and post in here in the
afternoon.....like Anek has said in the past, time to stop trading like a rookie
(trying to catch bottoms and tops) and trade like a pro with the
trend.......overall I am not going to get too down on myself, since I started
trying to make some changes to my trading with Anek's methods my results have
not been horrible IMHO:
-76
-28
+43
+228
+36
+27
+323
-216 <--- fought strong trend
+139
-441 <--- fought strong trend
+333
+223
-24
-372 <--- fought strong trend
Net Gain after all commish and fees $195 trading 1 NQ contract ($5 a tick)
roughly 8 - 24 trades per day. This is over 14 days or roughly 3/4 of a trading
month. Yes I will admit there have been some incredible opportunities that I
have missed because of fighting the trend on certain days but I have to try and
stay positive and focus on always improving rather than beating myself up too
much. One thing to note is my large losing days (like today) are days when there
has been the best opportunity to make huge gains becuase these are the days of
strong trend that I have been reluctant to join and instead have fought....again
on the positive side these days can go from big losers to big winners by
following the trend......ok, my rant is over and back to work tomorrow
![]()
Cheers to anyone listening and for all the good feed back in this
thread.....Anek I am gonna do your method justice from now on :-)
Cheers ![]()
Razor,
I wonder why there is no:
+300 <----Fought strong trend
+400 <----Fought strong trend
Makes you wonder.
If done correctly, and it's no rocket science either, the only day that can kill
AHG is an extremely choppy day full of reversals or the trader him/her self.
We haven't seen one like that in a long time, the market has been nothing but
beautiful lately.
Now, here are a few areas where you should watch out because they can be
difficult for trend following traders:
Lunch hour (2 hour min)
Friday Afternoon, during regular market conditions, not this insanity (I mean
that in a good way)
Friday OEX, triple witching all those crazy days.
Hope it helps and btw, for what it is worth, I can feel from your previous
charts, that there is a great trader inside you, it's just your discipline that
sucks ass.
Cheers ![]()
Anek
Thanks for the positive feedback Anek.....watch the incredible
improvements....... ![]()
Cheers ![]()
Quote from Anekdoten:
Razor,
I wonder why there is no:
+300 <----Fought strong trend
+400 <----Fought strong trend
Makes you wonder.
If done correctly, and it's no rocket science either, the only day that can kill AHG is an extremely choppy day full of reversals or the trader him/her self.
We haven't seen one like that in a long time, the market has been nothing but beautiful lately.
Now, here are a few areas where you should watch out because they can be difficult for trend following traders:
Lunch hour (2 hour min)
Friday Afternoon, during regular market conditions, not this insanity (I mean that in a good way)
Friday OEX, triple witching all those crazy days.
Hope it helps and btw, for what it is worth, I can feel from your previous charts, that there is a great trader inside you, it's just your discipline that sucks ass.
Cheers
Anek
Here is why you try to call tops and bottoms
"Greed, what we are trying to do is pick the start of a trend the other way so
we can get it all. It is part of the mental problem of "I can't join the trend
now it has to be about over" but if I pick the start it will run for a long
time"
Author's identity protected ![]()
Anek
![]()
Quote from Anekdoten:
Here is why you try to call tops and bottoms
"Greed, what we are trying to do is pick the start of a trend the other way so we can get it all. It is part of the mental problem of "I can't join the trend now it has to be about over" but if I pick the start it will run for a long time"
Author's identity protected
Anek
Korea down 7.25% ![]()
DJIA flirting with monthly trend line support.
![]()
Anek you still short my friend ?
Quote from Razor:
Anek you still short my friend ?
Get um !! ![]()
Quote from Anekdoten:
Until I see a higher high, I will be.
Anek
Added yet another short position at 1408.50-75.
Adjusted stop accordingly on all cars on a new HH. Profits on 5 of the 6 entries
very much locked and secured.
80% into full leverage
The "short" must go on!
Anek
ES currently trading at 1401.25.
Expecting some logical buying at 1400, adjusting stops to secure profits also on
the last position.
First initial position is now at near 33 points profit.
If 1400 is broken with conviction, i will consider adding a 7th add to the play.
Eventhough that will take me to near full leverage, securing profits on the
first 6 positions allows me to use it responsibly.
This is going to end as one hell of a play and I'm not only extremely proud of
sticking to my rules but very honored and humbled that as I try to give by
helping with this journal the market and Karma does not forget and reciprocates
what I consider, a good deed.
Anek
I realize the your system works period because its basis is that of reading
price action, but out of curiousity, are these profits just more flagrant now
with the index futures making these wild huge point swings up and down... or has
it proven well for you in tighter point days and periods of market congestion?
~Cx
Cx,
Yes, absolutely, this market environment is optimal for it.
ES about to break 1400.00 now as I type this.
Anek
As expected there is a strong battle for the 1400 area. Day low 1400 even.
Anek
But the system has proved well for you in times where we dont have this volatility?
I got stopped out based on the following afterhour bullish formation.
(Attached)
It ends here for now, pushed it as far as I possibly could without running into
much risk.
The 1400 area was defended very well, several thousand cars traded hands in that
area.
Stopped out on all positions at 1404.50.
Profits ranging from 4.25 points all the way up to 29.00.
Time to get some rest, there is more money to be made in the morning. The
markets are wild.
Anek
Quote from Cxinvest:
But the system has proved well for you in times where we dont have this volatility?
Quote from Anekdoten:
I got stopped out based on the following afterhour bullish formation.
(Attached)
It ends here for now, pushed it as far as I possibly could without running into much risk.
The 1400 area was defended very well, several thousand cars traded hands in that area.
Stopped out on all positions at 1404.50.
Profits ranging from 4.25 points all the way up to 29.00.
Time to get some rest, there is more money to be made in the morning. The markets are wild.
Anek
Price action does not lie.
Outcome of price after I covered.
It's not voodoo crap, it's logic, screen time and being prudent knowing that
eventhough you are probably right after reaching the so call "I got it" stage,
there are never guarantees; so you protect and preserve capital at all times.
Some patterns repeat over and over and over again, exploit them, master them, it
might seem random, but it's not.
Back to bed and good trading tomorrow.
Anek
Beautiful trade Anec. Congrats.
Quote from GaryN:
Beautiful trade Anec. Congrats.
Quote from rotflmao1:
The only problem is that Anek is so full of crap it's not funny. Just go back and check his other alias' "Neet" in the past and you will see. LMAO--the blind leading the blind.
Hi,
Anek been stickin to my guns so far and +14 NQ $224.00 net
![]()
Also did 2 QQQQ trades based on NQ chart and slightly positive on those as well
![]()
Been marking my chart up to post later and get reviews
![]()
Cheers ![]()
Quote from Bingoking:
Thanks for that hot tip. Would you please start your own thread and inform us how it should be done?
BTW - $884 net in the ES for me today, started at 8:30 (central) done by 10:20. How is your day so far?
Quote from Razor:
Hi,
Anek been stickin to my guns so far and +14 NQ $224.00 net
Also did 2 QQQQ trades based on NQ chart and slightly positive on those as well
Been marking my chart up to post later and get reviews
Cheers
Cheers ![]()
Quote from jimmygold:
Nice Raz !! Keep it up we all know you can do it !!!
Quote from Razor:
Cheers
Superb ! ES ?
Quote from jimmygold:
Cheers back at you
Got my +24pts for day. I am headed out to the beach
jimmygold, Tell me about your daily goal strategy. It appears you call it a
day after making 20 or so points. Reasons this works for you?
Thanks,
Don
Interesting situation this afternoon. Is this a legitimate triangle or do the two intermediate lower highs disqualify it? Turned out to be a spectacular break but did I cheat? ES may do 5 million contracts today. Simply amazing.
I love daytrading. I never get squeezed for more than 2 or 3 points. What a
turnaround. What a day. Im exhausted!![]()
On a side note I think Warren Buffet turned this market around. He was on the
news this morning because he was buying financials and eventually they turned
the market as they were up all day.
Hi,
Finished Net Gain $210.00 on NQ, +13.75 points. I will post a chart later. Need
to take a break. I am pretty happy with todays trading and stuck to the trend
all day.
Also, traded AAPL, QQQQ and GOOG based on trend and watching NQ chart trend for
entries etc.
QQQQ - slightly down (about commish worth)
GOOG - roughly +4.00 points
AAPL - roughly + 1.00 points
Chart on NQ with trades to be posted later
![]()
Cheers ![]()
Trades for 08.16.07
Morning Session
Longs 3
1st Stopped out
2nd Stopped out
3rd Stopped out
(got chopped to death on the longs today in the morning, kept buying the last
wave)
Shorts 6
1st Winner
2nd Winner
3rd Winner
4th Stopped out
5th Winner
6th Winner
Total: 5 Winners 4 Losers
Anek
Trades for 08.16.07
Afternoon Session
Longs 10
1st Winner
2nd Winner
3rd Winner
4th Winner
5th Stopped out
6th Winner
7th Winner
8th Winner
9th Winner
10th Winner
Shorts 5
1st Break Even
2nd Stopped out
3rd Stopped out
4th Grand Slam, this one left the park
5th Stopped out
Total 9 Winners 4 Losers 1 Break Even
Anek
Today's trading session was absolutely insane, the swings were extremely
strong and the afternoon was exactly what I needed to pull ahead in a
comfortable manner.
Without a good system methodology and solid discipline it's the kind of day that
can kill a trader. On the other hand with a proper education is fun and
profitable.
The morning session was definitely not optimal for me as you can see by my
longs.
Still since the stops are usually smaller than the winners, in terms of P/L I
was modestly ahead.
The afternoon, a gift from the gods, the surprising up move during the last hour
was solid, furious and even had the decency to retrace once in a while for me.
I won't trade Friday Option's Expiration, it's usually not ideal for AHG and I
could use the break.
Anek
Hi,
Here are all my NQ and QQQQ trades for the day. Basically the Q's mirror the NQ
but I did some Q's today because at some points the volitility was so much that
NQ's required too big of a stop even on 1 contract but I could go to the QQQQ
and drop down share size to as low as needed to be in proper loss / risk zone.
Not a perfect day but I really tried my best all day to trade with the trend,
looking for to comments especially our teacher Anek.
Cheers ![]()
http://i11.tinypic.com/5z51xm8.png
http://i16.tinypic.com/6gx5r4p.png
http://i17.tinypic.com/4m9boyp.png
http://i11.tinypic.com/6at8j2o.png
http://i10.tinypic.com/6397b7t.png
http://i12.tinypic.com/4v2yp81.png
http://i11.tinypic.com/67s3kzq.png
http://i18.tinypic.com/6d1a6hv.png
I feel the journal has enough information and illustrations for anyone
willing to learn how to trade this methodology properly.
As hinted earlier last week, I will stop posting my daily trades this week
because eventhough I enjoy it, the constant updates of the journal requires
constant personal sacrifices that I cannot continue to neglect.
AHG is a good system and some areas require more experience/skills than others
but overall I've never come across anything better out there. If there is, and
there probably is, I would use it, but I don't know the details.
Needless to say you can consistently pull money out of the market with this. You
will have losing days but they will be rare and miniscule compare to some of the
good winning days.
I encourage others to participate in the journal and I will drop from time to
time to offer any possible advice, for what it's worth, to keep the discussion
evolving and alive.
Hope some of you continue working on your skills, once you get there, you won't
regret it. It's the most lucrative and exciting profession I have ever come
across.
Stick around, you have all the tools needed right here, the rest is up to you!
Anek
Razor,
Working on your charts now. Give me a few....
Anek
HUGE thanks Anek for taking the time to start and follow through on this
incredible journal ![]()
All the best to you and hope to see you posting in here on ocassion as you say
you will.
Cheers ![]()
Quote from Anekdoten:
I feel the journal has enough information and illustrations for anyone willing to learn how to trade this methodology properly.
As hinted earlier last week, I will stop posting my daily trades this week because eventhough I enjoy it, the constant updates of the journal requires constant personal sacrifices that I cannot continue to neglect.
AHG is a good system and some areas require more experience/skills than others but overall I've never come across anything better out there. If there is, and there probably is, I would use it, but I don't know the details.
Needless to say you can consistently pull money out of the market with this. You will have losing days but they will be rare and miniscule compare to some of the good winning days.
I encourage others to participate in the journal and I will drop from time to time to offer any possible advice, for what it's worth, to keep the discussion evolving and alive.
Hope some of you continue working on your skills, once you get there, you won't regret it. It's the most lucrative and exciting profession I have ever come across.
Stick around, you have all the tools needed right here, the rest is up to you!
Anek
Quote from Razor:
Hi,
Here are all my NQ and QQQQ trades for the day. Basically the Q's mirror the NQ but I did some Q's today because at some points the volitility was so much that NQ's required too big of a stop even on 1 contract but I could go to the QQQQ and drop down share size to as low as needed to be in proper loss / risk zone.
Not a perfect day but I really tried my best all day to trade with the trend, looking for to comments especially our teacher Anek.
Cheers
http://i11.tinypic.com/5z51xm8.png
http://i16.tinypic.com/6gx5r4p.png
http://i17.tinypic.com/4m9boyp.png
http://i11.tinypic.com/6at8j2o.png
http://i10.tinypic.com/6397b7t.png
http://i12.tinypic.com/4v2yp81.png
http://i11.tinypic.com/67s3kzq.png
http://i18.tinypic.com/6d1a6hv.png
Dots are Heiken Ashi bars, time frame 400 volume / share bar chart.
Hope that helps ![]()
Quote from Charly:
What kind of indicators are the colour dots on your chart and which time frame do you use exactly - if you don't
mind me asking.
Thx
Cahrly
Razor,
All your charts zipped into one file to overcome the ET forum limitation of one
file per post.
You rode some good runners today, good stuff.
Anek
if i'm not mistaken Razor, 400v on nq is a
pretty fast chart. have you looked at maybe a
lil slower 1, like a 1200, 1600, or even higher? just a thought.. maybe you
already do that.
bb
Thanks for the critque Anek, greatly appreciated....now go enjoy your family
![]()
Hope to see you soon.
Cheers ![]()
Quote from Anekdoten:
Razor,
All your charts zipped into one file to overcome the ET forum limitation of one file per post.
You rode some good runners today, good stuff.
Anek
Big Bubba,
I sometimes look at a 3 min chart to see what the bigger picture is doing and
even a 20, 240, daily chart for possible key support and resistance points but
almost all of my attention is focused on that 400vb, my eye seems to be
adjusting to it ok but I will def take a look at slightly higher like you
suggest just to see if it offers any benefit.
Cheers for the input ![]()
Quote from BigBubba:
if i'm not mistaken Razor, 400v on nq is a
pretty fast chart. have you looked at maybe a
lil slower 1, like a 1200, 1600, or even higher? just a thought.. maybe you already do that.
bb
Price Action of a Strong and calm Uptrend.
Why would a trader ever want to short something with such a formation ?
Hope it helps.
Anek
A trader friend just asked me why I did not keep the longs today.
Here is why, attached the big picture.
Anek
On the other hand, we got a possible hammer at the end of a downtrend on the
daily chart.
Will be interesting to see how the 240 min downtrend channel reacts now. If
price breaks that downtrend channel, along with the ES hammer, we could have
some serious upside move, but imho it's too early to tell.
Anek
PS: BTW, the Hammer is green but my HA bars paint it red due to the downtrend.
Quote from Razor:
Big Bubba,
I sometimes look at a 3 min chart to see what the bigger picture is doing and even a 20, 240, daily chart for possible key support and resistance points but almost all of my attention is focused on that 400vb, my eye seems to be adjusting to it ok but I will def take a look at slightly higher like you suggest just to see if it offers any benefit.
Cheers for the input
Attached is a chart of afterhours up to 3:30 AM EST.
Take a guess as to how difficult that is to trade with AHG.
Now look where price rebounded, that's even harder.
Good night.
;)
Anek
Quote from Anekdoten:
Trades for 08.16.07
Morning Session
Longs 3
1st Stopped out
2nd Stopped out
3rd Stopped out
(got chopped to death on the longs today in the morning, kept buying the last wave)
Shorts 6
1st Winner
2nd Winner
3rd Winner
4th Stopped out
5th Winner
6th Winner
Total: 5 Winners 4 Losers
Anek
__________________
Lets all drink to the death of a clown.
Quote from babe714:
your 3rd short @11:32 looks like only 1 lower low and 1 lower high , is that right ?
short at 12:00 looks like it was preceded by a higher low
Quote from Anekdoten:
On the other hand, we got a possible hammer at the end of a downtrend on the daily chart.
Will be interesting to see how the 240 min downtrend channel reacts now. If price breaks that downtrend channel, along with the ES hammer, we could have some serious upside move, but imho it's too early to tell.
Anek
PS: BTW, the Hammer is green but my HA bars paint it red due to the downtrend.
Fed Discount Rate For Banks
Markets on fire
Anek
Careful, fire can burn...........
ES spiked up plus 40 points for a few seconds. I have a high of 1471.5. Glad
I wasnt short.![]()
A day in the life.
.....but I got the FUNNIEST screenshot for you ever !
I'm scalping the ES, go have some breakfast, and come back to this.
Screenshot aptly named, I SUCK !
lmao
Anek
Quote from Anekdoten:
I feel the journal has enough information and illustrations for anyone willing to learn how to trade this methodology properly.
As hinted earlier last week, I will stop posting my daily trades this week because eventhough I enjoy it, the constant updates of the journal requires constant personal sacrifices that I cannot continue to neglect.
AHG is a good system and some areas require more experience/skills than others but overall I've never come across anything better out there. If there is, and there probably is, I would use it, but I don't know the details.
Needless to say you can consistently pull money out of the market with this. You will have losing days but they will be rare and miniscule compare to some of the good winning days.
I encourage others to participate in the journal and I will drop from time to time to offer any possible advice, for what it's worth, to keep the discussion evolving and alive.
Hope some of you continue working on your skills, once you get there, you won't regret it. It's the most lucrative and exciting profession I have ever come across.
Stick around, you have all the tools needed right here, the rest is up to you!
Anek
Quote from Anekdoten:
A day in the life.
.....but I got the FUNNIEST screenshot for you ever !
I'm scalping the ES, go have some breakfast, and come back to this.
Screenshot aptly named, I SUCK !
lmao
Anek
8/17 morning
__________________
Lets all drink to the death of a clown.
Babe,
Glad you caught that ![]() Was nice up
to the low 40s.....
Was nice up
to the low 40s.....
Some NASTY consolidation channel that had, took some patience.
Anek
This is what i saw this afternoon .
__________________
Lets all drink to the death of a clown.
I did not trade today. I dont have any particular objection to trading on expiration day but I do where there is some sort of unusually large move. I dont trade fed afternoons. Large spikey moves throw everything out of whack for me. Very good week though. Have a nice weekend.
Didn't trade much, Net Gain $40, one bad note is I got in a trade and scalped
out way to early as not to plan and then it proceeded to run about $250, I would
have probably got about 100 - 150 of it if I would have stayed in and looked for
LL exit.
Oh well, cheers ![]()
Quote from babe714:
This is what i saw this afternoon .
Couple of years ago I taught a close friend of mine how I trade and
illustrated to him the AHG methodology.
Long story short he has been at it ever since and eventually found out about
this journal via another friend. He now uses it the very same principle to trade
Forex with very good success.
Here is a copy of his email, some of you might find it useful.
"
I read your journal in the ET forums. Lots of props for maintaining your cool in
that place, I always thought of it as Jurassic Park after the beasts escaped.
Sadly, the great majority of them will not put enough effort into it or the
discipline monster will derail them after something unexpected happens.
Nevertheless, I'm sure it won't be in vain and a few will actually get how this
can change their life. The very same way you changed mine.
Perhaps the highs and lows is a bit complicated for them. Why not just tell them
to use Trendlines ? You know that's how I do it. Less precise but less confusing
and works as well.
Feel free to post this in the jungle, say it's from Tarzan!"
There you go guys, use trendlines instead if it's easier to spot the trend.
Anek
![]()
Quote from Anekdoten:
Couple of years ago I taught a close friend of mine how I trade and illustrated to him the AHG methodology.
Long story short he has been at it ever since and eventually found out about this journal via another friend. He now uses it the very same principle to trade Forex with very good success.
Here is a copy of his email, some of you might find it useful.
"
I read your journal in the ET forums. Lots of props for maintaining your cool in that place, I always thought of it as Jurassic Park after the beasts escaped.
Sadly, the great majority of them will not put enough effort into it or the discipline monster will derail them after something unexpected happens. Nevertheless, I'm sure it won't be in vain and a few will actually get how this can change their life. The very same way you changed mine.
Perhaps the highs and lows is a bit complicated for them. Why not just tell them to use Trendlines ? You know that's how I do it. Less precise but less confusing and works as well.
Feel free to post this in the jungle, say it's from Tarzan!"
There you go guys, use trendlines instead if it's easier to spot the trend.
Anek
Quote
I read your journal in the ET forums. Lots of props for maintaining your cool in that place, I always thought of it as Jurassic Park after the beasts escaped.

Hi guys,
I haven't read through the whole thread yet (probably never will at this point
because of its length). I wanted to say that this is a great thread and an
excellent start for those who are struggling. The method outlined is basically
what I use day after day. There are several differences though. I use differing
levels of tick charts. I also take a bigger picture to microscopic view look at
the day and the action.
My process (in raw format) is:
Helpful as always, thank you FT71
![]()
Schaefer
__________________
Easy does it, one stick at a time!
A. If you are still around. I noticed in one of your old post in a different
thread, that you should never allow a winner to become a loser. I think we all
appreciate that, but how much to be ahead before going to a break even has
always been a moving target for me. Seems if I move to a be when up 2 points, I
seem to get a lot of 2 point reversals, back to my stop, then back to trend, so
I am not consistent in that area. Do you just play each trade as it unfolds or
move to be at a certain time. Not to beat a dead horse on this subject, just
trying to better understand what seems to me to be an important concept to have
under my belt.
Don
Briefly off-topic, though I'm researching it myself, can anyone give me input
as to what you feel the best brokerage/platform choice(s) is for index futures
trading? Research is good...but so is personal experience. Thanks!
~Cx
Quote from bmwhendrix:
A. If you are still around. I noticed in one of your old post in a different thread, that you should never allow a winner to become a loser. I think we all appreciate that, but how much to be ahead before going to a break even has always been a moving target for me. Seems if I move to a be when up 2 points, I seem to get a lot of 2 point reversals, back to my stop, then back to trend, so I am not consistent in that area. Do you just play each trade as it unfolds or move to be at a certain time. Not to beat a dead horse on this subject, just trying to better understand what seems to me to be an important concept to have under my belt.
Don
The stop should be strategically placed below or above resistance.
It is your job to make an effort to get the good fill close to it.
If using 50% fib retracement, watch the 61.8% area as stops, etc.
Risk management at all times.
Assuming long, when the price runs in your favor, consider placing stop below
the low of 2-3 last bars, reverse for short.
Placing at break even is just a common saying, using the lows of previous bars
is much more astute.
Hope it helps.
Anek
FT71,
Thank you for explaining some of your methods and for supporting logical price
action trading.
Anek
In my opinion, this is where scaling out really pays off. I think 2 pts is sufficient in a normal market, but the ES now covers 2 pts just wiggling around. Hence, it is important to reduce size and widen your stop. Scaling is great because you can bank a portion at 2 pts and let your stop play out. Generally, after the ES move 2.5 to 3 pts in my direction and then comes back to my entry, then I don't want to be in the trade anyway because eventually it is likely to reverse. I scale out always. I know others argue against it though. My crystal ball doesn't work as well as theirs though.
Quote from GaryN:
You cant stop every winner from becoming a loser. Are you going to exit a trade because it goes a tick or two in your favor then reverses? Of course if it moves significantly in your favor it would be foolish to let it turn into a loser. The question seems to be "how much". I think this must be decided by volatility. In this market two points is tight. I have doubled my normal guidelines.
In my studies I concluded that scaling out only helps the psychological
factor, releases the pressure of securing profits. Remember, you can always get
back in a trade.
Yet, a simple strategic trailing stop does the same.
My main problem with scaling out is that when you get stopped before your first
target, you lose on your full lot.
However, if your first target has a good ratio in comparison to your stop, then
by all means, scale out til your heart stops pounding.
Money management is very personal and I don't think there is only one way to do
it properly. It all depends on what is right for you and your style.
If you need to release some pressure when trading with multiple positions,
scaling out can help tremendously.
If I had to pick one, averaging up is hard to beat once you get good at reading
the market.
In fact, due to averaging up it has been years since I had a losing month
because a good day erases multiple losing ones and then some.
Hope it helps, but don't forget to research deep within yourself which style
fits you best.
Trading comfortably is important.
Anek
Anek, you are saying that you take an entry, hold the full boat and then wait for a second setup through a retracement to add more? Is this correct?
Quote from Anekdoten:
[...]
If I had to pick one, averaging up is hard to beat once you get good at reading the market.
In fact, due to averaging up it has been years since I had a losing month because a good day erases multiple losing ones and then some.
Hope it helps, but don't forget to research deep within yourself which style fits you best.
Trading comfortably is important.
Anek
Quote from FuturesTrader71:
Anek, you are saying that you take an entry, hold the full boat and then wait for a second setup through a retracement to add more? Is this correct?
I'm interested in learning about how you average up. Thanks.
Here is a little demonstration of my wife doing mini scalps in the afterhour
sessions in her own account.
Ya, we are all night owls here.
Her trading is based solely on price action and until she can demonstrate to me
that she can remain consistently profitable for 6 months in a row she cannot
increase her 1 car size.
Last 7 weeks for her have been all profitable, so she's cruising by.
Sample of her trades attached, with her permission of course. Only Price Action
based indicators are allowed in her chart. She was clearly playing breaks of
support in a downtrend, not too shabby, good accuracy.
That's a nice little run with good focus that she caught. No real heat either.
If she gets real good at it maybe I can step aside and scratch my balls while
someone works for our income !
There is a reason why I like her to train in AH as well, perhaps someone knows
![]()
Hope it helps.
Anek
Quote from Anekdoten:
........However, if your first target has a good ratio in comparison to your stop, then by all means, scale out til your heart stops pounding.......
Anek
Quote from GaryN:
You cant stop every winner from becoming a loser. Are you going to exit a trade because it goes a tick or two in your favor then reverses? Of course if it moves significantly in your favor it would be foolish to let it turn into a loser. The question seems to be "how much". I think this must be decided by volatility. In this market two points is tight. I have doubled my normal guidelines.
brokerage and data feed used
Quote from Cxinvest:
Briefly off-topic, though I'm researching it myself, can anyone give me input as to what you feel the best brokerage/platform choice(s) is for index futures trading? Research is good...but so is personal experience. Thanks!
~Cx
Quote from monti1a:
fwiw...I move my stop to Entry at 5-ticks of profit on the ES....
I think I said it a few times already but it's good stuff. If you are having
trouble with the runners/stops consider moving stop to low or high of the last
2-3 bars (depending on volatility and/or how fast your chart of choce is) once
price had left the initial S/R area, which is usually where your initial stop
should be.
This will allow you to catch more runners than you can imagine using a
mechanical way and prevents your emotions from taking profits too soon.
I'm a much better friend of adjusting stops than simply selling or covering. The
idea here is to be in control of your emotions while maintaining logic in check.
If using OSO in Tradestation, manually move this in the Matrix as price moves in
your favor.
There is no better trailing stop, this is much more precise than a fixed # stop
because it's based on recent lows or highs.
Hope it helps.
Anek
initial stop
A,
I've been trying to get an entry where I can put my stop within 2.25 es pts
above or below the swing high or low (S/R). Not easy to do , miss a lot of
entrys. Is this reasonable ?
Was at VH concerrt on 07/08/79 , in Lakeland Florida. Wish I could remember some
of it.
http://www.bootlegvideos.com/vhtourdates.html
__________________
Lets all drink to the death of a clown.
Anekdoten,
So, I've been dying of suspense all day.
Why does your wife only trade after hours?
Is the price movement less noisy?
Is it easier to tell where support/resistance lie?
Re: initial stop
B,
I would rather miss a good entry than force a bad one. Sometimes the good stuff
just slips through our fingers.
Anek
Quote from babe714:
A,
I've been trying to get an entry where I can put my stop within 2.25 es pts above or below the swing high or low (S/R). Not easy to do , miss a lot of entrys. Is this reasonable ?
Was at VH concerrt on 07/08/79 , in Lakeland Florida. Wish I could remember some of it.
http://www.bootlegvideos.com/vhtourdates.html
Quote from trader225:
Anekdoten,
So, I've been dying of suspense all day.
Why does your wife only trade after hours?
Is the price movement less noisy?
Is it easier to tell where support/resistance lie?
Quote from Anekdoten:
Maybe
Quote from trader225:
Maybe?
I ask, because experienced traders will often warn inexperienced traders to stay out of the after hours.
Quote from Anekdoten:
Yes due to possible slippage and much less liquidity and I have posted in this journal that newbies should stay out of afterhours.
In my wife's case, she's got me right there so kind of has a coach next to her, does not exactly apply.
Anek
Quote from trader225:
OK. Here's why she's trading after hours:
In the after hours you can clearly see where support is -- it's the point where price hasn't gone any lower. But when it does go lower, SELL!
Is that right?
Quote from Anekdoten:
In afterhours due to less liquidity when something is broken the effect is usually more drastic and less "fakes" are seen.
Stay with the trend, determine clear S/R and you go have so fun. Much less frustration.
Requires MASSIVE patience though, sometimes it feels like they hit PAUSE at certain hours and because I think patience is extremely important in waiting for the right setups, I train her there. It also gives her enough time to study the current scenario.
So to answer your question I want her to develop exceptional patience in trading so she can handle only taking the right setups when the time comes.
..that and the fact that it trends quite well.
Anek
Quote from Anekdoten:
Long story short he has been at it ever since and eventually found out about this journal via another friend. He now uses it the very same principle to trade Forex with very good success.
Boo,
My forex experience is quite limited. However, I have begun following DAX in
afterhours because it leads the ES and that's a highly tradeable instrument.
Anek
T,
Just now, once it bases, say 4-5 bars, when it breaks, tick tick tick cover,
funny stuff.
It's important to wait for that base.
Anek
Hi,
Anek if one would like to watch / trade after hours what percentage do you need
to change your after hours share bar or tick size by, ie: if one was trading
400VB on the regular session what should one drop to a 40VB, 100VB for after
hours ?
Cheers ![]()
I use 500 shares in AH.
Anek
Hi,
OK but I trade NQ, what do you normally use for ES on the regular session ?
Cheers ![]()
Quote from Anekdoten:
I use 500 shares in AH.
Anek
Quote from Razor:
Hi,
OK but I trade NQ, what do you normally use for ES on the regular session ?
Cheers
Cheers matey ![]()
Quote from Anekdoten:
For NQ, divide by 5, try 100.
Anek
ES right now, if you catch it, enjoy
![]()
Anek
Gads I got chopped up today. That sucked.
Feel like 1982 all over again. Playing Pac Man til my hearts content....Chop
Chop Chop Chop Chop ![]()
But a BIG nice symm triangle in the
making ![]()
I love chop. I seem to do OK with it.
First couple of hours were choppy but turned into a nice downtrend and now we have a nice uptrend. Something for everybody today.
Hi, 2 trades, +6 NQ points Net Gain $132
Had some ok gains on GOOG, about break even on AAPL and about break even on
QQQQ.
Probably should have done a few NQ longs on that nice afternoon uptrend but
still happy to finish the day positive.
Cheers ![]()
I missed the big move
__________________
Lets all drink to the death of a clown.
Quote from babe714:
I missed the big move
Quote from Razor:
Hi, 2 trades, +6 NQ points Net Gain $132
Had some ok gains on GOOG, about break even on AAPL and about break even on QQQQ.
Probably should have done a few NQ longs on that nice afternoon uptrend but still happy to finish the day positive.
Cheers
Cheers ![]()
Quote from jimmygold:
Raz, Good going !!
The morning was choppy, no real sense of direction. Confirmation was the
massive wedge formed afterwards that exploded to the downside. Followed by a
double bottom that created a solid uptrend.
Learn to stay out of the chop, when confused or undecided use a bigger time
frame for better orientation.
Anek
Hi everybody!
This is my first post on this board, just to say 'thanks' to Anek.
I've been following this thread for a while, and I also simulated the last two
weeks, mainly ES.
When I came back from work today (I live in the Middle European time zone),
first thing I saw on the chart was the triangle formation. Without hesitating, I
went live.
I took 4 trades today (each 1 contract), and netted 480.
(Like other people posted today, I also missed the run-up)
I hope to continue like this.
Thanks Man!
![]()
__________________
PM
Learn to spot the following formations before you place a trade.
Make sure you have done your homework.
Begin with level 0.
Level 0 (No Trades)
Consolidation (It can be traded but for AHG purposes I would rather you would
not, I prefer bigger better opportunities)
Level 1 (Only on opportunity, no forcing no chasing)
Uptrends
Downtrends
Level 2 (Only with confirmation, no guessing, ride them aggressively these are
not scalps, these formations put food on the table)
Double tops
Double bottoms
Level 3 (Only with confirmation ride them aggressively, target should be larger
than your usual scalp)
Wedges
Symmetric Triangles
Stay out of anything else for now use trendlines at all times.
Hope it helps.
Anek
Pax,
Good stuff, make sure you read every single post on the journal.
There is a lot of info as it grew quite unexpectedly.
Trading is hard work, examine every single one of my posts along with genuine
helpful additions by traders like ST and others.
Discipline at all times, minimizing risk and protecting capital above all.
The trend is your friend, always. Never ever forget that. Notice how people
actually lose money when they try to decide the fate of the market. Razor comes
to mind, sorry man, but you are a good example.
This is the only holy grail I know and if you stick to the rules and increase
your skills/experience as you go long you will reach prosperity.
YOU ARE YOUR WORSE ENEMY, ONLY YOU CAN BREAK AHG, DISCIPLINE DISCIPLINE
DISCIPLINE.
Do not let small losses bother you, consider it tuition for learning how to
trade.
Bla bla, you know the rest or should know the rest
![]()
Best of skill in trading.
Anek
Sure miss those Anek charts....oh well all good things do end.
But back to trading. A. what constitutes "confirmation" for the level 3
formations?
Pax,
Good stuff, make sure you read every single post on the journal.
[b]
There is a lot of info as it grew quite unexpectedly.
Trading is hard work, examine every single one of my posts along with genuine
helpful additions by traders like ST and others.
Discipline at all times, minimizing risk and protecting capital above all.
The trend is your friend, always. Never ever forget that. Notice how people
actually lose money when they try to decide the fate of the market. Razor comes
to mind, sorry man, but you are a good example.
Bla bla, you know the rest or should know the rest
Best of skill in trading.
Anek
[/]
Anek,
I've read all of the posts more than once. Some of the most interesting, I've
kept in a separate document. Sometimes I add a chart or some ideas to the
document, and I re-read it often.
Today for example, I went long after hitting the bottom a few times. I got in a
little late, mabe. Stop was 2 points. I got stopped out because of a spike
down...
I don't know what lesson to learn from this:
- adjust stop to some where below the bottom and take more risk ...
- redo the same trade (psychologically it didn't work for me ... my thought was
'not a second time')
- best solution I guess: better entry ...
And I KNEW the support was around 1435 ... (friday's chart) ...
Damn ...
__________________
PM
Quote from bmwhendrix:
Sure miss those Anek charts....oh well all good things do end.
But back to trading. A. what constitutes "confirmation" for the level 3 formations?
Pax,
Today's uptrend ONLY decent entry was right after the Double Bottom confirmed
itself. Everything else was not an optimal entry because it never stopped.
As far as your stop question, at first hand it might look like a simple one but
it's a key element in trading.
You want to reduce risk and protect your capital right ?
You agree that we never know if our targets will get hit right?
Yet you don't want noise and volatility to stop you out right ?
Then your only solution is to be patient, extremely patient and base your entry
on your stop.
All you really need in trading is a few good setups a day, nothing else really.
Your stop should be relatively small but most importantly placed in a LOGICAL
spot, don't fix yourself too much on how many points they should be but on the
where. They need to go below lows, above highs, protected by known support and
resistance.
Think of them as your children, they need to be guarded and well preserved.
If you don't see a safe area to place your stop or in this case your children,
then no trade, no leaving the kids in the
open jungle.
If using 50% fib retracements as entry then below the 61.8% but always in
logical and strategic spots.
Don't fixate too much on the entry but on the stop, this should help you define
your risk and protect your children better. In fact, consider placing your stop
first then your limit order.
Hope it helps.
Anek
Fellow "Anek" traders, we could all trade and observe hl's and lh's, in an ET
chatroom called "Index futures". (usually becomes active at start of USA stock
session)
Small, focused and a few good traders in there
Anek,
Have you posted a summary of your observations on the ES since you made your
move from the YM?
John
QT
Quote from babe714:
I missed the big move
John,
It's still very much under observation.
Naturally way more liquid, allows some afterhours trading.
For the most part it is more trendy and tends to respect S/R moreso than YM as
far as ticks goes.
All very preliminary for now but I feel at home with it.
Anek
Quote from GaryN:
I did too. Never did see the kind of pullback I like even when I dropped down the the 5k. Did ok on the down move tho.
Well, I'm here to report that my wife just completely annihilated the ES
trading AHG in afterhours again.
Trading one car, she made, over 1000 bucks. No kidding, caught a short, then the
reversal long.
I wonder who's cooking tonight lol
Crazy stuff, soon I'll be out of a job, taking the kids too school. I can't wait
;)
Anek
Wow. She must have captured almost all of both moves to get 20 points. Pretty impressive.
Re: AHG - Profitable Strategy for Struggling Traders
I'm open to suggestions and ideas on how to improve what I consider a very good system for daytrading the market. Particularly, the e-minis.
Ive always thought it's a good idea to train the life-partner(in Anek's case , the wife), or take on a trading partner. Ive often wondered about that type of diversification to reduce risk, eg. what happens if a sole trader starts to lose their sight/become blind, or other calamity
Anek,
Start looking a pretty apron to wear =)
Someone else is bringing home the bacon.
Everyone's contribution to this thread is really helping. I'm getting closer and
closer to live trading.
I paper traded the DAX this morning and made $725 ! (I know just paper money)
but the system is starting to make sense. I just had to fight with myself not to
execute the trade sooner (fear of losing profits, who knew how important the
psychological factor would be ?)
A little more time of chart watching (and maybe some yoga) and I'll be ready to
trade with you guys.
Keep up the great work guys !
Quote from GaryN:
Wow. She must have captured almost all of both moves to get 20 points. Pretty impressive.
Howdy,
Pull up an NQ 400VB, workin on a nice sym triangle.....time of post = 1:17pm
est.
Cheers ![]()
Nice Uptrend with HH,HL in late morning (eastern time)_. Had some nice
consolidated, sideway rectangle boxes (and symm triangles) in this Uptrend to
trade Long from and catch some ongoing breakouts of trendlines. Really good
profits....
I luv HH,HL....LH,LL methodolgy !!
Nice break of symm triangle to downside at 2:15 pm eastern. Sweeeeettt
proofit on short.
No HH, HL method here but part of AGH's Level 3 trading .
Being Wedges and symm Triangles !!
Good enough for me.
ES 610 tick Symm, right now...
Anek
Up we go.....
Disappointing afternoon, no real conviction either way.
Tomorrow is a new day.
Anek
Blah day alright. 3 small trades. I do most of my stuff around new highs and lows. When we drop back inside the daily range I pretty much lose interest.
Hi all,
Net Loss $27 today on NQ, overall I am happy, stuck to my guns on trend trades
for most of the day just could have had some slightly better entries.....I think
overall it was just a harder than average day IMHO
One thing to note is that I was up 6 NQ points on my first trade...then my next
trade I was in on a beautiful entry and put in an auto stop as per usual and I
put in a wrong digit which stopped me right away for -1.25 (stop was supposed to
be 2.50 away) well that was the low of the move and it proceeded to rocket up
and I would have made realistically 4 - 6 points which would have put me at my
target 10 points for the day and I would have probably gone ultra conservative
after that.....course these things will happen but it was silly because it was a
concentration error and not a poor trade error....oh well
![]()
Lost some on GOOG today (tricky fella today) and did about breakeven on APPL.
Cheers ![]()
How about the triangel that built all morning till about 10:43 E. It had at least 3 false breakouts. Triangles have never been my strong point, not that I have many.
Symmetric Triangles forming below the HOD are usually quite powerful but
today it failed miserably as it only gave a few points of a run then stopping me
out for a minor loss.
Previous to that we had a TL break that worked well but not as as well as it
should have.
NQ strong, YM weak did not help either.
Study today's chart for any possible hints that suggested congestion.
Definitely not an optimal day for my style of trading, needless to say not
detrimental either just a bit frustrating because of the time invested.
The market is looking for a sense of direction, it has not found it yet there is
a lot of uncertainty. It is actually looking more and more like the summer
trading I usually shy away from.
Anek
Today's session.....
.....posting so you get to see the type of day that no matter how disciplined
and focused you are it's really hard to get good setups out of it.
Anek
Quote from Anekdoten:
Today's session.....
.....posting so you get to see the type of day that no matter how disciplined and focused you are it's really hard to get good setups out of it.
Anek
Did OK here. $500+ all in the AM
Great job to anyone that had small losses, broke even and obviously any types
of wins today.
You guys are traders! ![]()
Now for the sake of our children, bring back the volatility!
Anek
Quote from Anekdoten:
Great job to anyone that had small losses, broke even and obviously any types of wins today.
You guys are traders!
Now for the sake of our children, bring back the volatility!
Anek
MT,
I will check it out, thanks.
Anek
MT,
I read your journal and your work looks very interesting. Unfortunately the
details are not disclosed.
Aside from the book you mentioned "Mind over Matter", I would not know where to
start.
Anek
You just got to love it.
Choppy day.
Super trending afterhours.
What gives huh ?
I got no reason to close this, none whatsoever, except the fact that my mind and
body are pleading for rest.
gnight
Anek
Quote from MoveTimer:
Look at my chart. It is what I call "market timing". Only 3 trades per day. No countertrend trades, no tops/bottoms fishing, no artificial calculations (buy 38%, 50%, 68% retracement etc). All pivot times were calculated in advance, you can check it here
http://elitetrader.com/vb/showthrea...6&pagenumber=33
08-21-07 06:41 AM
08/21 Look at 10/00 11/55 14/40 EST
The other advantage of timing - you know in advance when you will trade, no need to watch charts all time. So timing is the best tool IMO for trader who can read trend correctly.
Good luck!
Quote from monti1a:
MoveTimer,
I read over your forum, however you stated "....Few words about foundation of my method. I surely will not disclosure any details, but will describe the model at the glance...."
Since you are not willing to share your method, then what's the point when Anek has a system that already works....
No thank you...
Quote from Anekdoten:
You just got to love it.
Choppy day.
Super trending afterhours.
What gives huh ?
I got no reason to close this, none whatsoever, except the fact that my mind and body are pleading for rest.
gnight
Anek
My Two Cents
I was wondering if it is alright with Anek to help contribute to this thread. I have been trading for some years now and belive I can pass along a thing or two that I learned that would have helped me a lot when I started out, especially in the psychological arena.
Re: My Two Cents
Hey Piscuy,
Anek is obviously all about helping others so I am sure he would be happy to
have your input (he has also stated that earlier in this thread)
![]()
Cheers ![]()
Quote from Piscuy:
I was wondering if it is alright with Anek to help contribute to this thread. I have been trading for some years now and belive I can pass along a thing or two that I learned that would have helped me a lot when I started out, especially in the psychological arena.
Not seeing many HH HL LH LL type trades today .
Just took this one trade so far .
__________________
Lets all drink to the death of a clown.
Hi,
Net Loss $56, not bad IMHO ($25 of that was commish).....choppy day and a couple
trades that came back to take me out breakeven....
Was about breakeven trading GOOG as well.
Cheers ![]()
Quote from GaryN:
Do you monitor the European markets at night? I noticed that move up in ES started just around the time DAX and others start trading. Nice double top this morning.
Re: My Two Cents
Quote from Piscuy:
I was wondering if it is alright with Anek to help contribute to this thread. I have been trading for some years now and belive I can pass along a thing or two that I learned that would have helped me a lot when I started out, especially in the psychological arena.
Quote from babe714:
Not seeing many HH HL LH LL type trades today .
Just took this one trade so far .
IB and QT
Quote from babe714:
Not seeing many HH HL LH LL type trades today .
Just took this one trade so far .
On TWS screen, in the "underlying" column, type es and enter. then just follow prompts.
If you are new to futures make sure you do sim or paper trading for at least
3-6+ months. The more the better.
This suggestion is important, do not overlook this due to excitement.
Anek
what other index can be followed
Quote from Anekdoten:
If you are new to futures make sure you do sim or paper trading for at least 3-6+ months. The more the better.
This suggestion is important, do not overlook this due to excitement.
Anek
Question for Anek
What is the indicator on the bottom of your chart marked:
Anek's HG v20?
PT,
It's an indicator I wrote based on a price action algorithm a very talented
coder/friend developed. Unfortunately, I'm not in the liberty to share because I
wrote the indicator not the function itself which has most of the juice.
I can't discuss much about it but think of it as a price action based MACD
without the lag, something extremely powerful.
Anek
ES Afterhours out of control breakout....
Anek
Quote from Anekdoten:
ES Afterhours out of control breakout....
Anek
Monti.
Would love to see your chart! Embaressed to post mine from today.
Quote from bmwhendrix:
Monti.
Would love to see your chart! Embaressed to post mine from today.
Time to change sleeping schedule for lovely afterhours.
What a treat.
Forming a wedge now.
Anek
Quote from Anekdoten:
Time to change sleeping schedule for lovely afterhours.
What a treat.
Forming a wedge now.
Anek
Quote from monti1a:
May need to investigate AH.....a master trader once told me to stay away from the ES market when the US traders are not participating......the liquidity that US traders provide enables the predictability of their actions....
Quote from Anekdoten:
Tell the master trader, times change, slaves predict, kings react.
Just kidding ;)
Anek
Hi, this is my first post, but I have been a lurker on ET and many other
forums for a LONG time. I have researched all aspects of futures trading for
about 6 years now but haven't done live trading yet. (did couple years ago and
lost 10k due to fruadulant broker mimicking backoffice executions, long story,
lessoned learned) Anyway, the first method I was introduced to years ago was
same as this, very simple.... with the trend, swing highs/lows, and S/R. This
thread has brought me back to this simple method and I am GRATEFUL. I am now at
a point to get serious about trading. I have opened 15k account and recently was
layed off at my IT job and took a 2nd shift factory job so I have time to trade
during the day. Of course I intend to sim trade for about 6 months first.
MONTI1A,
Is 17 trades average for you? I have using 210 and 89 tick on ym which can give
lot of trades. Can system be just as consistent using small tick, etc. chart
that gives 20+ trades vs. using higher charts giving 5-10 trades per day? The
latter requires larger stops, but a lot say its better to be sniper than
gunslinger.
Quote from farscape105:
Hi, this is my first post, but I have been a lurker on ET and many other forums for a LONG time. I have researched all aspects of futures trading for about 6 years now but haven't done live trading yet. (did couple years ago and lost 10k due to fruadulant broker mimicking backoffice executions, long story, lessoned learned) Anyway, the first method I was introduced to years ago was same as this, very simple.... with the trend, swing highs/lows, and S/R. This thread has brought me back to this simple method and I am GRATEFUL. I am now at a point to get serious about trading. I have opened 15k account and recently was layed off at my IT job and took a 2nd shift factory job so I have time to trade during the day. Of course I intend to sim trade for about 6 months first.
MONTI1A,
Is 17 trades average for you? I have using 210 and 89 tick on ym which can give lot of trades. Can system be just as consistent using small tick, etc. chart that gives 20+ trades vs. using higher charts giving 5-10 trades per day? The latter requires larger stops, but a lot say its better to be sniper than gunslinger.
Wedge below the high, broke to the upside, come on baby pay for kid's college
tuition!
Anek
BTW, if anyone is interested prior to this thread I have been trying to
develop my own style of retracement trend trading learned from various sources
such as Wattstrading.com and sling setups from dacharts.com The methods
basically boil down to trading with trend, but they use lots of indicators which
just get too complex. I think successful trend traders that use lots of
indicators are basically using price action subconsciously to filter which
setups to take and not blindly following indicators.
Anyway, this thread has reinforced to me to use no more than 1 or 2 indicators
along with trendlines and swings for intraday S/R.
I am also looking into using market profile for S/R as alternative to calculated
pivot points. Keeping it simple, just using previous days TPO charts and using
ends of the bell curves as S/R. Not sure which is better. Calculated pivots I
think become self fulfilling prophesies, but MP is based on price action. Don't
want to get too much in trap of having a bias for the day though, just let price
action lead me.
Quote from Anekdoten:
Wedge below the high, broke to the upside, come on baby pay for kid's college tuition!
Anek
Far,
Stay away from any indicator that is not 100% based on price action.
Anek
Quote from Bingoking:
Spike up on low volume. My guess is the pros will short the heck out of this tomorrow.
Quote from Anekdoten:
Bingo,
Not a critique but don't guess, if it's shortable we will see the downtrend in the making.
Got a feeling you are thinking short because it went up a lot very fast. Now don't forget this market is trying to reverse a downtrend that came from all time highs.
There is no such thing as too much or too little. Let price action guide you, the rest is up to you.
Anek
A. Only sim, but holding this long. Trying the afterhours. I'm afraid this could lead to sleep deprivation!
File here now?
Forgot to change file type. Here we go.
Quote from bmwhendrix:
A. Only sim, but holding this long. Trying the afterhours. I'm afraid this could lead to sleep deprivation!
Quote from bmwhendrix:
A. Only sim, but holding this long. Trying the afterhours. I'm afraid this could lead to sleep deprivation!
Jimmy,
My 6 year old must learn to scalp the ER2 successful by 9 or she's out of the
house.
We sleep on Saturdays, rest is for hard work!
Only traders allowed.
![]()
Kidding aside, I'm in my 30s, soon enough I will need to slow down.
On a separate note, I've been doing intensive studies and backtesting on
automation without success. Needless to say I'm not giving up until I reach my
goal. Successful scalping automation is in a different league, I have failed
miserably there, for now.....
Point well taken, very logical and very human.
Anek
Quote from Anekdoten:
Jimmy,
The 6 year old here must learn to scalp the ER2 successful by 9 or she's out of the house.
Only traders allowed.
Kidding aside, I'm in my 30s, soon enough I will need to slow down.
Point well taken.
Anek
Why do you guys always reply when I'm editing my messages
![]()
Anek
50's here. Only part time now but anxiously awaiting full time status. This
thread has brought me closer to that goal. Thanks again Anek.
It's been said here before but trading is the perfect occupation: no boss, no
customers, no employees. And I anxiously await Monday mornings.
Trading full-time would be a dream come true. I'm going to be 30 in a week.
And I wish I can have the same passion and dedication as our friend Anek. And
want to have the mentality like Jimmy. (after making a couple of bucks) For
those that are successful out there what could be better. Where else can work in
your boxers. Put your feet up and rip a wicked fart, and still make a G by lunch
time ? A career this good has to have its risks and dues must be paid. But I
think there's potential for all of us that trade with a plan and not like its a
video game.
Keep up the great work guys !!
The contributions have been awesome.
Hi,
Anyone seeing a long here on YM in the 13360 area ? 11:50pm est
Cheers ![]()
Hi guys,
Just want to drop by to say Great Job with the Thread. The initial strategy
posted by Anekdoten is very informative, so THANK you. I’m only on the 3rd page
but I will catch up to all the 128 pages posted so far. Once again, great job,
keep up the good work.
KiwiRoo.![]()
Quote from Razor:
Hi,
Anyone seeing a long here on YM in the 13360 area ? 11:50pm est
Cheers
Quote from KiwiRoo:
Hi guys,
Just want to drop by to say Great Job with the Thread. The initial strategy posted by Anekdoten is very informative, so THANK you. I�m only on the 3rd page but I will catch up to all the 128 pages posted so far. Once again, great job, keep up the good work.
KiwiRoo.
Tip of the Week
Learn about Ross Hooks.
More info can be found here:
http://www.trade2win.com/traderpedia/Ross_Hook
Highly recommended and it's nothing but Price Action.
Anek
Quote from Anekdoten:
Tip of the Week
Learn about Ross Hooks.
More info can be found here:
http://www.trade2win.com/traderpedia/Ross_Hook
Highly recommended and it's nothing but Price Action.
Anek
Quote from MoveTimer:
Do you use Ross Hook as confirmation signal?
I've been working long hours the last two days ... No trading, only studying
charts.
So this morning there was some time to trade, and here are my 2 trades ... on
the sim ...
I'm using price, volume and bollinger bands as indicators, and try to add some
patience, which is difficult for me.
Trade 1: Some more patience on the entry would have been nice. I wonder if the
exit would have worked in real life - right at the end of that tail ...
Trade2: The patience part of the entry was ok. Wish I had more patience for the
exit ... but hey, no greed involved.
+ 387,5 so far ...
Next days, I'll be working on improving my initial stop, which is 5 points now
...
I also have some notes/ideas on the DAX which I will maybe post later, if
there's any interest ...
__________________
PM
PaxMax the Dax,
Good stuff, I like it.
Notice how 9:04 - 9:11 did not have a red bar signalling weakness so no "failed"
short there.
Anek
Hi Anek,
Thanks for your comments. You're absolutely right about the missed
opportunities.
I should have taken the trade on your 2nd green circle indeed!
At the time the first suggested trade occurred, I was 'feeling' the market' ...
As a matter of fact, there is another thread on trends, animated by
'spydertrader'. The term 'failure to traverse' is explained there. It might be
an early signal of trend change ...
Boy, I like trends ...
+700 exactly at this moment ... in the sim...
The best of my trading is done on the sim!
![]()
Should work my exits also ...
PM
__________________
PM
Pax,
You did great.
Anek
Re: what other index can be followed
Quote from billdobson1972:
Hi Anek,
thanks a lot for this great post...what other index can be traded from IB which are liquid enough to bet < 500$ per trade, but are traded after hours..
i get only 3 hrs to trade...from 9.30 to 10.30 and then 1.30 to 2.30...
I concur, the DAX.
Anek
Nice downtrend, pretty stuff.
![]()
Anek
ES PP today is 1462.50-.25
YM is solid as a rock today, hasn't moved in a long time
![]()
technical problems at ECBOT
I swear they run YM off a Commodore 64. CBOT is always crashing.
Anek
Sorry, mistakenly posted here. I usually post in ES journal, but I started
reading this thread (from the beginning) a couple of days ago.
Anekdoten,
I did a trial at Puretick back in Feb?, Jan? and marvelled at your trading.
Thank you for starting this thread and for being so generous with your comments,
and the other traders who have unselfishly posted there own observations.
may all contributors show respect to all.
Thank you.
Welcome bud, YM still dead or as you say solid as a rock due to blue screen
crash ![]()
Anek
Did someone call Winnie the Pooh today ?
Nothing but blood, very nice downtrend.
To think afterhours were more bullish than Rodeo tournaments.
Trend is your friend!
Anek
That was a short that was begging to be taken. On the 10k I had four bars that could not take out 1471.25 creating a small double top in a downtrend. Doesnt get much better than that.
Anek, thanks again for the journal. The ross hook, eh?
Well, interlibrary loan, here I come:
ISBN-10: 9768108274
Trading the Ross Hook, by Joe Ross
Anyhoo, after the antics at cbot today, I think I'm gonna head on over to the
ES. I pulled up a 5000 constant volume bar chart and it looked so much better
than anything I've seen on the YM in a while. Smooth, little dimple ups in a
nice downtrend, alot like what you are describing.
Covered the shorts on trend reversal, rode the change of a trend to around
1467 while doing several averaging ups.
Very friendly day to trade. If you understand AHG and you lost money today then
something really disturbing is going on with your trading. Can't get an easier
day to trade.
Off to get some rest, I have a date with afterhours, word is, it might a be sexy
one ![]()
Anek
Welcome to Kindergarden....
![]()
Anek,
Are you back to trading off tick bars?
B
Bog,
Working on a new system that requires multiple timeframes (3) so been mixing
them up.
610 tick and 5000 are fairly similar.
Now that I feel more familiar with ES been doing some serious scalping on 233
ticks too.
Anek
Quote from Anekdoten:
Covered the shorts on trend reversal, rode the change of a trend to around 1467 while doing several averaging ups.
Very friendly day to trade. If you understand AHG and you lost money today then something really disturbing is going on with your trading. Can't get an easier day to trade.
Off to get some rest, I have a date with afterhours, word is, it might a be sexy one
Anek
Bill,
233 ticks
377 ticks
610 ticks
987 ticks
1597 ticks
5000 volume bars
10000 volume bars
....and I adjust depending on the type of day. If extremely choppy, then I just
have to use 233.
In general I wait for a confirmed downtrend or uptrend unless I see higher highs
and higher lows after a double bottom or lower highs and lower lows after a
double bottom.
Before I enter I need some sort of confirmation, green/red bars, ross hooks,
etc. Many ways to approach this.
Anek
Who caught that symm ?
Come on , raise your hands!
Anek
I did on NQ ![]()
Quote from Anekdoten:
Who caught that symm ?
Come on , raise your hands!
Anek
Anybody know which index is most used for financials? They keep saying "the financials are leading market up/down". Id like to track them for awhile but not sure which index is best to watch.
Quote from GaryN:
Anybody know which index is most used for financials? They keep saying "the financials are leading market up/down". Id like to track them for awhile but not sure which index is best to watch.
Quote from Anekdoten:
Bill,
233 ticks
377 ticks
610 ticks
987 ticks
1597 ticks
5000 volume bars
10000 volume bars
....and I adjust depending on the type of day. If extremely choppy, then I just have to use 233.
In general I wait for a confirmed downtrend or uptrend unless I see higher highs and higher lows after a double bottom or lower highs and lower lows after a double bottom.
Before I enter I need some sort of confirmation, green/red bars, ross hooks, etc. Many ways to approach this.
Anek
Hi all,
Net Loss -$2 should have made money I guess but NQ was kind of choppy and I
found good entry points tricky....
Did well on some GOOG, AAPL and SPY trades, lost a bit on QQQQ trade...
Cheers ![]()
Hi again,
Here's what wanted to tell this morning about the DAX:
Its day range today was +/- 120 points, this represents 3000 Euro or +/- 4000$.
The range of the mini YM was 180 points, representing 900$.
My point is: to make the same amount of money, you need only one fourth the size
of the mini YM if you trade DAX futures, (DAX is not a mini sized contract ...).
I hope that some time in the future this becomes an issue for me ...
This also puts things in the correct perspective when talking about gains on the
DAX or gains on YM or ES or NQ or whatever ...
This is also the reason why the DAX can be rewarding, but also dangerous. On
fast moves it also slips ... Last week I did some tests on different order
types. I sent an order which issues a stop and a target automatically when
executed. As I clicked the 'OK' button, I heard two beeps ... and I had no
position. Stop was 5 points, target 10 points. It was the target being hit on
the second beep ...
The DAX went crazy in the afternoon here. My stops got hit 3 times ... nothing
but longbars ... I didn't know what was going on, but it was around Wall Street
opening hour ... I'd better remember that!
Anek, if I can manage to have 5 successive days of profit in the real account,
I'll send you some exotic beers from over here ...
Closed the day 760 net on paper ... (and I missed the nice downtrend because of
a visit to the dentist...) High of day was 900 ...
PM.
__________________
PM
Quote from mikehbeck808:
Try XLF.
Hi again,
Here's what wanted to tell this morning about the DAX:
Its day range today was +/- 120 points, this represents 3000 Euro or +/- 4000$.
The range of the mini YM was 180 points, representing 900$.
My point is: to make the same amount of money, you need only one fourth the size
of the mini YM if you trade DAX futures, (DAX is not a mini sized contract ...).
I hope that some time in the future this becomes an issue for me ...
This also puts things in the correct perspective when talking about gains on the
DAX or gains on YM or ES or NQ or whatever ...
This is also the reason why the DAX can be rewarding, but also dangerous. On
fast moves it also slips ... Last week I did some tests on different order
types. I sent an order which issues a stop and a target automatically when
executed. As I clicked the 'OK' button, I heard two beeps ... and I had no
position. Stop was 5 points, target 10 points. It was the target being hit on
the second beep ...
The DAX went crazy in the afternoon here. My stops got hit 3 times ... nothing
but longbars ... I didn't know what was going on, but it was around Wall Street
opening hour ... I'd better remember that!
Anek, if I can manage to have 5 successive days of profit in the real account,
I'll send you some exotic beers from over here ...
Closed the day 760 net on paper ... (and I missed the nice downtrend because of
a visit to the dentist...) High of day was 900 ...
PM.
__________________
PM
I apologize for posting twice.
Went beackward with explorer and refreshed the screen...
Sorry!
__________________
PM
Hey,
Anek and others, viable short here on ES after hours ? thoughts ?
Chart:
http://i14.tinypic.com/63ws1eg.png
Cheers ![]()
![]()
fast chart
i must be old and slow
Only for after hours it is this fast due to less volume
![]()
Quote from BigBubba:
fast chart
i must be old and slow
Bingoking and booyah:
I cannot wait for it to be monday either, it is a rewarding job when done full
time. Yes you can rip a good one whenever you want but i'll tell you some things
I consider that make a difference between getting there and not.
One
Working from home is not as easy as it may seem. Yes, you dont have to commute
to work, you dont have to dress, you can watch tv while you work, but there is a
downside. This downside can be controlled a bit with dicipline. Too many cannot
handle working from home, instead of waking up at 9:30 to be at the market open
they get up at noon. So a good idea is to get up and dress even if casually as
if your going to work.
Two
This comes even before one. Worry about getting to know yourself. I have always
said that anyone can learn the necesary technical analysis for trading in a day.
You can gain some experience in what you learned in that day in a couple of
months. Getting controll of yourself and your emotions can take a lifetime and
this is where most fail. Its not easy but interestingly it can also change your
life not only your trading. Therefore invest a lot of time in yourselves cause
you have NOTHING to loose and a lot to gain.
Three
Find your own trading path. What works for Mr. Anek might not work for you. Why?
Well, perhaps his style of trading may be too fast for your personality, or you
may be too impatient cause it takes too long for trades to develop. Please do
not take it as if I am saying it does not work. I can assure you that a method
this simple works and works wonders. The beauty of technical analysis is that it
works in all time frames. If Anek trades 233 or 610 tick its because it suits
his personality. Find what suits yours!!! Take from any good traders you find
what serves your trading style best and develop your own trading style.
Hope this tidbits of experience help you guys achieve your dream. Good trading
to all
Would have had to taken some heat on this if you shorted the 40% level (50%
would have been better) but then the downtrend continued nicely
![]()
Quote from Razor:
Hey,
Anek and others, viable short here on ES after hours ? thoughts ?
Chart:
http://i14.tinypic.com/63ws1eg.png
Cheers
Piscuy,
I agree with you, trading can be and is very personal.
For instance, swing trading does not work for me. Even with all the tools at
hand, even with knowing exactly what I must do, it's just not my style.
Scalping is where I'm at and it also allows me to sleep at night or is it day
now? with peace of mind.
I like close stops, keeps me in control. It does not take me 30 min to know if
I'm right or wrong, if I'm right, boom it worked. If it did not, next play.
Anek
Pisguy,
Thanks for your words of advice. I am still demo trading on IB but I feel I am
getting warmer. Paid some tuition last year which was a good learning
experience. Experience with a real account is probably the best teacher. I'm
sure I'm not done there yet either (just ask Boib - he's been trying to beat
some sense into me for quite a while now).
Bing
Quote from Anekdoten:
Piscuy,
I agree with you, trading can be and is very personal.
For instance, swing trading does not work for me. Even with all the tools at hand, even with knowing exactly what I must do, it's just not my style.
Scalping is where I'm at and it also allows me to sleep at night or is it day now? with peace of mind.
I like close stops, keeps me in control. It does not take me 30 min to know if I'm right or wrong, if I'm right, boom it worked. If it did not, next play.
Anek
Quote from Bingoking:
Trading with a live account is a whole different animal. Hopefully when I start I will have a system I know I can trust when I am in the heat of battle.
tradng in direction of 10000 v bars on Es
Hi A,
I am trying to see if we can sucessfully trade in direction on 10K bars, but
trade would be kicked off after watching 1K bars.
Stop 1 pt , half target 1 pt and rest can ride the wave.
I wonder how you plan to scalp ES. Also 1ok stochastice has to be
overbaught/oversold for maximum winning rate...
Bill,
Looking for entry on a smaller chart in relation to your big chart is ideal.
This I have said all along in the journal.
Nevertheless your 1.0 stop in this volatility will kill you more than often
unless your entry is superb and the market always in your side, highly
unrealistic.
Usually when I do intense scalping I mostly concentrate on Time and Sales.
Unfortunately I can't teach you that here, that's just screen time experience.
Anek
Zero plays during Afterhours, pretty much dead for now. Oh well, got to
sleep.
Anek
While I agree with the idea of looking at a smaller timeframe for entry you have to be careful not to go too small. I kept going to smaller and smaller timeframes in order to get my stop as tight as possible but found myself getting stopped out far too often. Now I decide what is a reasonable stop in the present volatility and look to get in as long as I am within its limits but not within the lower half of this limit as it usually leads to getting stopped out.
Should be able to do any sort of trade from the price action alone. Anything else would be a bonus.
Another tip for those who are trying to make it. This one comes with a
certain contradiction but im sure more than one of the experienced traders will
agree. Even though one of the perks of trading is the amount of money you can
make, you will start to make it when you stop worrying about making money. I
know this is a contradiction but it has its truths.
Thinking in terms of money blinds you from your setups, your entries your exits.
Instead of focusing on the amount of money you make why not view it in points?
Or even better (when you have a certain track record) dont keep track at all.
Trading is a game to an extent, a game of calculated risk. The more calculated
your risk the better you do, the more of a game it is the better you do as well.
Try this little experiment to view first hand what im talking about. You all
know a kid around you who owns play station or a similar console. Ask them what
is their record on a game. Offer them 100 dollars if they break it while you
watch them. If not 100 dollars something they desire ( a bike, a game or
whatever). This new dimension in their game (prize) adds pressure and this added
pressure takes away from their abilities to play (Trade). Even more, tell them
that for each attempt they dont make it to new records you will take away 100
dollars. Even more pressure. Im sure few would earn the initial 100 dollars
after a few trials.
Good trading to all.
Imho, the goal of trader is to make a series of correct decisions based on his edges, or what Mark Douglas said, flawless execution of reliable trading setups. Money will take care of it in the long run.
Well I have a different opinion.
As a trader, my goal is to challenge smart money and let them know, that I'm
also here to squeeze some profits, it won't be just them.
Death to the big boys ![]()
Anek
Quote from Cxinvest:
Should be able to do any sort of trade from the price action alone.
NQ sym triangle, 10:35 am est
![]()
Careful with this choppiness, have taken only two trades, on the sidelines
now.
Anek
10-4, thanks ![]()
watching market internal
do we need to watch market internal along with price action to fine tune your
entry.
i think its better to watch Tick and advance decliners to be on the right side.
I am still not able to come up with you indicator for dynamic support
resistance.
Anek what other indicator are you using now. can you post a latest screen shot
when you get some time.
i was rereading first 30 pages and was watching how good your dynamic support
indicator indicates.
I find market internals quite useless.
Price action, don't complicate things.
You are looking for crystal balls that do not exist. Everything lags but price.
If it's an uptrend, buy retracements.
If it's a downtrend short pop ups.
If congested, play Pac Man.
Tell you what, go back to my first post in the journal, it's all in there.
Anek
PS: I think the S/R indicator is on page 14
bill
The dynamic s/r is not an indicator. It is simply an application for marking the
swing highs and lows. You can do it with short trend lines or some other mark
yourself if you cant use the coded model.
Bill,
Here you go.
Quote from Anekdoten:
I find market internals quite useless.
Price action, don't complicate things.
You are looking for crystal balls that do not exist. Everything lags but price.
If it's an uptrend, buy retracements.
If it's a downtrend short pop ups.
If congested, play Pac Man.
Tell you what, go back to my first post in the journal, it's all in there.
Anek
PS: I think the S/R indicator is on page 14
Good to hear it's not just me. 2 trades, two small losses.
Wish there was some way to display my chart on the inside of my
eyelids...........zzzzzzzzzzzz
Jimmy,
Good point about jumping the gun and diving into the chop. I'm trying to stick
with the clear trends. I'm sure im not the only noob with the problem but in an
uptrend with strong HH's and HL's (im using green and red bars, simple price
bars I believe) In the strong uptrend if you dont see a pull back (red bar) do
you guys chance it and jump in based on the fact that its progressing quickly,
or do you wait no matter what for a pull back (retracement) and if so you do you
jump on after the first red bar ?
Thanks Guys.
Morning was choppy but the afternoon has presented opportunities.
Plenty of retracements in an uptrend and a symm.
Anek
Friday's afternoons are usually extremely dull so calling it a week.
Anek
Anek,
Stumbled onto this thread, and I really appreciate all those logical rules that
I always seems to break.
Just starting with the your basic concepts.
Going with the current gives a much more confident feeling. And I feel I'm more
in touch with what's going on. A good trend does hurt either.
Quote from Techdoodle:
Anek,
Stumbled onto this thread, and I really appreciate all those logical rules that I always seems to break.
Just starting with the your basic concepts.
Going with the current gives a much more confident feeling. And I feel I'm more in touch with what's going on. A good trend does hurt either.
Quote from jimmygold:
If you feel like you are getting over anxious to trade in choppy conditions
or you feel you are getting trigger happy with buy button, then take a break and go watch some funny videos at Youtube or take a jog
Quote from booyah:
Jimmy,
Good point about jumping the gun and diving into the chop. I'm trying to stick with the clear trends. I'm sure im not the only noob with the problem but in an uptrend with strong HH's and HL's (im using green and red bars, simple price bars I believe) In the strong uptrend if you dont see a pull back (red bar) do you guys chance it and jump in based on the fact that its progressing quickly, or do you wait no matter what for a pull back (retracement) and if so you do you jump on after the first red bar ?
Thanks Guys.
I would like some input on what kind of S/R levels you guys use and how. I
know Anek has the dynamic indicator and of course double tops/bottoms work
great.
But what about calculated floor pivots, previous day/week high/low, intraday
major/minor pivots, etc. Do you use these actively for entries and targets? Or
just aware of them and if for example a retracement meets a major support level
in uptrend, then it is just an extra signal for good entry.
Far,
I mark the daily pivot and watch for key S/R levels in the multi day's chart.
That's it.
Anek
Poor Oscar Carboni, shorted a clear uptrend, got stopped out, geez I wonder
why.
25 years of trading for the win!
That guy cracks me up.
Anek
![]()
e
Quote from Anekdoten:
Far,
I mark the daily pivot and watch for key S/R levels in the multi day's chart.
That's it.
Anek
Quote from jimmygold:
e
BTW, Anek you still using that one indicator you had mentioned at the beginning of this thread ?? That being Stoch crossover for entry points ??
Quote from Anekdoten:
Poor Oscar Carboni, shorted a clear uptrend, got stopped out, geez I wonder why.
25 years of trading for the win!
That guy cracks me up.
Anek
Thanks. Anek, what is your opinion on market delta and on using ACV from this
thread:
Scalping_My Way with ACV
I have never used tape reading before and I know that would be whole other
thread, just want your opinion if you deem it to be a very important skill one
should learn.
Far,
Might or might not help. Not experienced enough to form an opinion on Market
Delta.
What I do know is that keeping it simple works. You can slice price in so many
ways, after all it's the same thing with a different package. Some, might even
take you a long time to open, aka lag.
Now, if it's based on Time and Sales, it's probably a good thing.
Anek
Quote from Anekdoten:
Morning was choppy but the afternoon has presented opportunities.
Plenty of retracements in an uptrend and a symm.
Anek
Hi,
Net $150, did about $75 after hours last night and about $75 intraday today.
Lost a small amount on AAPL.
Cheers and have a great weekend all
![]()
Quote from booyah:
Hey Anek,
I had a question about this chart titled afternoon opportunities with the 4 arrows.
In particular the first and third arrow. What gave you the indication that this retracement was just a brief pull back and not a total trend reversal. Did you wait for that retracement to start to turn back to uptrend, and if so, how many up bars did you wait to see. ?
Its a tremendous entry point number 1 and 3. Something I would wait longer to take part of so I was just curious.
Thanks dude.
Quote from jimmygold:
(Note- Just be sure look for low volume in these temporary sideway movements.)
However, I have found the longer the sideways stairstep pattern the more probability for a breakdown. Which is a risk. This is just from my personal experience.
Quote from Anekdoten:
My indicator going from neg/0 to positive. Signaling the end of weakness, the return of strength, with of course, a minimal stop.
Anek
Boo,
Yes, it's based on high lows and trendline computations.
I exited after the symmetric triangle breakout on all positions.
Usually, I would keep adding until a change of a trend presents itself as a
threat.
However, I made a mistake, I called a top, thinking the Friday Afternoon would
convert it into consolidation and closed them all prematurely when the correct
play was to close it at 4PM EST because the uptrend never slowed down.
Anek
Quote from booyah:
Jimmy,
I see what you mean about longer sideways movement but what is the correlation with high / low volume during that sideways period what would either one typically indicate to you.
Thanks for the info. I'm sure you AHG traders made a few bucks today
Quote from Razor:
Hi,
Net $150, did about $75 after hours last night and about $75 intraday today.
Lost a small amount on AAPL.
Cheers and have a great weekend all
Quote from Anekdoten:
Boo,
Yes, it's based on high lows and trendline computations.
I exited after the symmetric triangle breakout on all positions.
Usually, I would keep adding until a change of a trend presents itself as a threat.
However, I made a mistake, I called a top, thinking the Friday Afternoon would convert it into consolidation and closed them all prematurely when the correct play was to close it at 4PM EST because the uptrend never slowed down.
Anek
Quote from booyah:
Thanks Anek,
I need to study the symm triangles more. You guys can definitely spot them a lot faster. I know you believe purely in price action, but do you guys use other TA tools for trading or maybe just testing purposes ?
Quote from jimmygold:
Side ways movement with dwindling Volume is an indication the Market is taking a breather with not much activity. Metaphorically speaking kind of like the calm before the storm. Getting ready for the next move up on heavier vol , in a strong HH HL trend that is !!
Quote from booyah:
I see Anek circled the low volume during the sideways movement which led to a continuation of the uptrend.
Quote from Anekdoten:
That is not volume that is strength/weakness in price action.
Anek
Thanks for the thread, Anekdoten.
There is a lot of good information and advice here.
Quote from jimmygold:
Side ways movement with dwindling Volume is an indication the Market is taking a breather with not much activity. Metaphorically speaking kind of like the calm before the storm. Getting ready for the next move up on heavier vol , in a strong HH HL trend that is !!
__________________
"Stay ahead of the curve"...
Quote from booyah:
oops.
is that indicator available through trade station or is that something you had to put.
I know Im a noob.
Quote from booyah:
Thanks Anek,
I need to study the symm triangles more. You guys can definitely spot them a lot faster. I know you believe purely in price action, but do you guys use other TA tools for trading or maybe just testing purposes ?
Quote from no. 22:
Thanks for the thread, Anekdoten.
There is a lot of good information and advice here.
Thanks Anek, that is the plan ![]()
21 trading days so far on this, 12 winning days, 9 losing days, biggest winning
day +$333, largest losing day -$441 (don't think this will be an issue anymore
since about day 10 or so when I made the commitment to stop fighting the trend
![]() .....Net Gain trading 1 NQ for
21 days = $556
.....Net Gain trading 1 NQ for
21 days = $556
That is about a months worth of trading and to have a net gain trading only 1 NQ
car (only $20 a point) with some large losing days at the beginning when I was
still fighting the trend at some points has me feeling pretty good and gaining
confidence ![]()
Thanks again Anek and others for the support and help.
Good weekend all, cheers ![]()
Quote from Anekdoten:
Good stuff, keep the consistency.
Then add 1 car as you go by, progressively, responsibly, then you become filthy rich.
Anek
Quote from Razor:
Thanks Anek, that is the plan
21 trading days so far on this, 12 winning days, 9 losing days, biggest winning day +$333, largest losing day -$441 (don't think this will be an issue anymore since about day 10 or so when I made the commitment to stop fighting the trend
That is about a months worth of trading and to have a net gain trading only 1 NQ car (only $20 a point) with some large losing days at the beginning when I was still fighting the trend at some points has me feeling pretty good and gaining confidence
Thanks again Anek and others for the support and help.
Good weekend all, cheers
Quote from booyah:
Hey Raz,
I think you owe Anek a beer.
Plus we all know you can afford it
Very impressive month for you dude, keep it up !
Quote from PaxMax:
Hey Boo,
You can easily spot triangles, just by connecting the latest (2 or 3) highs and the latest lows.
You can do it with trendlines, or just imagine these lines.
At least, that's how I find them.
PM
Quote from booyah:
Thanks Pax that helps. I've actually been reading a lot in my down time. For other noobs out there I recommend checking out the site stockcharts.com they have a section called chart school and very detailed explanations. Also they explain all of the important TA tools very nicely, so far all of the info I've needed has been free from their site.
Have a great weekend guys.
LOL.....no doubt, as things progress I will be sending him cases of fine wine
![]()
Quote from booyah:
Hey Raz,
I think you owe Anek a beer.
Plus we all know you can afford it
Very impressive month for you dude, keep it up !
I agree with this 100%, trust me I have tried just about all of them over the
many years I have been at this and having zippo on my charts has always given me
my best results....just my 2 cents....
Quote from Anekdoten:
Don't let them corrupt you with indicators though, very important.
Anek
Quote from Paulds11:
Dude please.... sideways movement with diminishing volume?.. Im shorting that action all other variables aside
Paul
Thought this doc might be helpful, been posted many times on ET. This is one
of the first things I read when I was introduced to futures years ago. Very
similar to AHG method.
http://www.trading-naked.com/FloorTraderMethod.htm
I don't want to get in trouble here.
![]() By similar, I mean using PA and
with trend trades.
By similar, I mean using PA and
with trend trades.
trading Naked
Quote from farscape105:
I don't want to get in trouble here.
No, I haven't backtested anything. Just sim trading right now. The doc just
further illustrates that KISS and with trend is definetly way to go.
First let me say Anek is right that everything is just rehashing of price, so it
is best to learn to trade with "naked" charts.
So, now please don't anyone beat me for posting following link and mentioning
indicators, but prior to this thread my workspace was price and the Bline and
20ema. Buffy is famous for her insane number of indicators. I was just using a
35/10 stoch and a 5/3 stoch and using what they call Slingshots to help find
retracements with trend.
The thing I am fighting is trying to trade on higher timeframes so I don't get
like 30 trades a day.
http://www.ensignsoftware.com/tips/tradingtips38.htm
BTW, this is one of the few ET threads I have read with over 100 pages of
great info and no negativity, bashing, or egos.
It is quite refreshing. I just want to add that I think with DISIPLINE, there
are many methods to take money out of the market, but PA and trends has to be
the easiest. It is how it was done long before computers and indicators.
Thanks again Anek for this thread.
Anek, if you could comment on topic of "trend within trend" topic which is
talked about in last doc I posted. It is something I struggle with, using
multiple timeframes.
A retracement in higher timeframe is a trend in a lower timeframe which can be
conflicting if you switch around a lot.
For example if higher timeframe isn't showing much in trends, I will move down
to a lower timeframe which then shows clearer trends. Of course you then have to
change targets/stops.
Comments please on whether it is best to just stick to one or if it is ok to
change occasionally during the week, etc.
Another question using last doc. In the 5 min chart at the area marked with
Black #8, if you were just trading that chart, I would read at that point to be
in down trend. But if one looked at 15 min chart at same point #8, then one
could read it as a retracement of uptrend. (These aren't best examples, but you
get idea)
So one timeframe gives buy signal and other gives potential sell. Of course on
smaller timeframe would have smaller target/stops.
So in addition to last post question on swithing timeframes to use for
entries/exits, can you guys comment if anyone blends multiple timeframes
together to enhance trading.
Edit
This probably answers my winded question:
"While you may trade the trends on the smaller time frame, waiting for price
action to show it is going to move in the same direction as the larger time
frame is trading with the trend."
"The trend is your friend!"
Hi Far,
Good stuff there at that site. Thanks.
Its simple trend trading with HH HL !! Its timeless and with correct and proper
execution it will make you rich over time.
No question !!!
Your Timeframe question I will save for Anek to address
Anek, what is it again you use for definition of change in trend, I think it
is 2 swing high/lows have to occur? Some places define it when price exceeds
last swing.
Sorry for all the questions. I have gone from 0 posts in 3 years to 10 in couple
days. ![]()
Quote from farscape105:
Anek, what is it again you use for definition of change in trend, I think it is 2 swing high/lows have to occur? Some places define it when price exceeds last swing.
Sorry for all the questions. I have gone from 0 posts in 3 years to 10 in couple days.
Quote from farscape105:
Anek, what is it again you use for definition of change in trend, I think it is 2 swing high/lows have to occur? Some places define it when price exceeds last swing.
I have to tell a familiar story. I started out with KISS method and spent
long time going through indicators, cycles, etc. etc. and now journey has come
back to beginning.
The only system I paid for was 5 years ago, it was tapes of live trading ES
using ONLY Keltner channel and one moving average. Just retracements of trends
on 1 minute trading with trends on higher timeframes and using S/R of major
swings and high/low.
I didn't think it could be that easy. Like I said, gone full circle back to
KISS!
The best traders don't have any super secret methods, they just use:
1) Simple method
2) with Discipline
3) and lots of screen time
Far,
You want to use lagging indicators, that's your right and choice. Especially if
you can use them properly.
NEVERTHELESS, I assure you, without them, I will always be faster than you.
Anek
Thanks, trying to ween off them, might go into shock if I go cold turkey all
at once. ![]()
Would you advocate on slower days moving to smaller timeframe to find trend
setups?
Of course you then can get into habbit of doing that out of impatience and
forcing trades.
Quote from Razor:
LOL.....no doubt, as things progress I will be sending him cases of fine wine
Quote from farscape105:
Would you advocate on slower days moving to smaller timeframe to find trend setups?
Of course you then can get into habbit of doing that out of impatience and forcing trades.
Anek, when averaging up, do you have anything you look at that trend might be
ending? Like after 3 or 4 retracements, it gets riskier trend will continue,
etc.?
Do you ever try to anticipate a trend change using 123 reversal or 2B top/bottom
patterns to get into the first retracement of new trend or do you consider it
best to wait for a defined trend?
As Trend traders, it is easy sometimes to think, oh I have missed the move,
better not take this retracement, but I think Gann is quoted as saying
"market is never to high to buy or to low to sell".
(unless you are near major S/R) ![]()
Quote from Anekdoten:
Good porn will do
I got everything I need right here man, happiness and health can't be bought, everything else is just one click away.
The one thing I ask to anyone who makes it with my help is to help out those in need with whatever you can when you finally reach the skill to milk the market consistently and obscenely. There is a lot of hunger and suffering in the world. Believe me when I say giving is always more powerful than receiving.
You will NEVER catch me selling anything unless one day I decide to write a book, not even in the plans, too lazy.
However, making it almost obligates you to pay it forward to those in severe need. You should not have a problem with this as the money incoming is just disrespectful to the working class once you truly make it.
All you need is right here on this journal, add screen time, experience, solid discipline and I'll say, welcome to the 1%
Anek
Quote from Anekdoten:
I got everything I need right here man, happiness and health can't be bought, everything else is just one click away.
The one thing I ask to anyone who makes it with my help is to help out those in need with whatever you can when you finally reach the skill to milk the market consistently and obscenely. There is a lot of hunger and suffering in the world. Believe me when I say giving is always more powerful than receiving.
You will NEVER catch me selling anything unless one day I decide to write a book, not even in the plans, too lazy.
However, making it almost obligates you to pay it forward to those in severe need. You should not have a problem with this as the money incoming is just disrespectful to the working class once you truly make it.
All you need is right here on this journal, add screen time, experience, solid discipline and I'll say, welcome to the 1%
Anek
Far,
Time and sales helps. What is big volume doing, who's selling, where at, etc.
How hard of a time is price having to make a new high, how easy to go back to
support, etc. All these tips helps.
However, make sure you don't actually call a top until a downtrend forms or a
double top followed by a ll and lh is in place.
Of course none of this is infallible, sometimes market will fake you out but if
you do it correctly risk should be minimal while the odds are always in your
favor.
It's always about the odds. Think of it as trying to be the casino and not the
player when gambling ![]()
Hope it helps.
Anek
Quote from farscape105:
Anek, when averaging up, do you have anything you look at that trend might be ending? Like after 3 or 4 retracements, it gets riskier trend will continue, etc.?
Do you ever try to anticipate a trend change using 123 reversal or 2B top/bottom patterns to get into the first retracement of new trend or do you consider it best to wait for a defined trend?
As Trend traders, it is easy sometimes to think, oh I have missed the move, better not take this retracement, but I think Gann is quoted as saying
"market is never to high to buy or to low to sell".
(unless you are near major S/R)
Anek, I hear a lot say they use volume, for example enter retracement on
falling volume and not rising because that might indicate reversal.
I have never been able to effectively use volume. Since you don't have that on
your chart, I assume it is not something you look at much?
Quote from farscape105:
Anek, I hear a lot say they use volume, for example enter retracement on falling volume and not rising because that might indicate reversal.
I have never been able to effectively use volume. Since you don't have that on your chart, I assume it is not something you look at much?
Thanks, I will start watching the tape more. Do you filter it out for larger contracts? Do you use DOM?
Quote from farscape105:
Thanks, I will start watching the tape more. Do you filter it out for larger contracts? Do you use DOM?
Thanks, Anek.
Just saw this thread. I have spent whole day to day on this thread, and I am on
page 37 now.
I will finish up the whole thread. Just want to say thanks for now.
Quote from freewilly:
Thanks, Anek.
Just saw this thread. I have spent whole day to day on this thread, and I am on page 37 now.
I will finish up the whole thread. Just want to say thanks for now.
*TECH QUESTION*
Your opinion is appreciated.
I'm currently using Windows Vista and aside from multimedia and some gaming my
only real applications are Firefox, Office and Tradestation.
Now, this Vista OS it's just slowing down my system, that's with state of the
art hardware, whenever something faster/better comes out I always get it off
Newegg. I think it's a vice now.
Anyway, I'm considering going back to XP Pro to get my speed back, there's
really nothing in Vista I will miss, not even the Aero crapola.
Question for you tech savvy trader geeks out there is this....
Should I install XP 64 bit or regular XP Pro ?
I hear since Tradestation is still a 32bit application that I should just go
with the regular XP Pro but still wanted to ask for second opinions.
Thank you for help as I plan to use Sunday to do the installation on all the
workstations at "mission control".
Anek
I use both x64 and xp pro. For what we do x64 benefits are limited/minuscule.
http://www.microsoft.com/windowsxp/...acts/top10.mspx
Most if not all drivers need to be compatible with x64. This is a big pain in
the ass, since a lot of vendors don't support x64 with older hardware.
You also can't upgrade x64 to vista... at least for now. Not to say I would for
a couple years. ![]()
Keep it simple, stick with regular xp pro, I wish I had.
Quote from Anekdoten:
*TECH QUESTION*
Your opinion is appreciated.
I'm currently using Windows Vista and aside from multimedia and some gaming my only real applications are Firefox, Office and Tradestation.
Now, this Vista OS it's just slowing down my system, that's with state of the art hardware, whenever something faster/better comes out I always get it off Newegg. I think it's a vice now.
Anyway, I'm considering going back to XP Pro to get my speed back, there's really nothing in Vista I will miss, not even the Aero crapola.
Question for you tech savvy trader geeks out there is this....
Should I install XP 64 bit or regular XP Pro ?
I hear since Tradestation is still a 32bit application that I should just go with the regular XP Pro but still wanted to ask for second opinions.
Thank you for help as I plan to use Sunday to do the installation on all the workstations at "mission control".
Anek
__________________
Dinoman
Agree, go back to XP Pro. Just put Vista on another harddrive to be able to
play upcoming Crysis game. ![]()
Quote from Anekdoten:
Couple of years ago I taught a close friend of mine how I trade and illustrated to him the AHG methodology.
Long story short he has been at it ever since and eventually found out about this journal via another friend. He now uses it the very same principle to trade Forex with very good success.
Here is a copy of his email, some of you might find it useful.
"
I read your journal in the ET forums. Lots of props for maintaining your cool in that place, I always thought of it as Jurassic Park after the beasts escaped.
Sadly, the great majority of them will not put enough effort into it or the discipline monster will derail them after something unexpected happens. Nevertheless, I'm sure it won't be in vain and a few will actually get how this can change their life. The very same way you changed mine.
Perhaps the highs and lows is a bit complicated for them. Why not just tell them to use Trendlines ? You know that's how I do it. Less precise but less confusing and works as well.
Feel free to post this in the jungle, say it's from Tarzan!"
There you go guys, use trendlines instead if it's easier to spot the trend.
Anek
Yes, Anek, I was going to ask too how you use trendlines realtime. There are whole threads on the subjectivity of them.
Jack,
This is a great thread and you wont get flamed for being a noob.
This subject is straightforward but can be confusing for a noob, but this will
really help.
1. Read the first several pages of this thread a few times. Look at the charts
posted and the comments about them a couple of times.
2. Check out stockcharts.com go to chart school section, its nicely organized
and explains all the topics relevant to us.
3. If you're a super noob and not ashamed go to your bookstore and check out
Technical Analysis for dummies. They really "dumb" it down but for a super noob
its really useful.
Consider this a new major in college, and you have to start with the 101 level
courses.
Good Luck.
Quote from jack411:
Anek,
and everyone else who has contributed - thank you! I just read through this entire thread. YES, every single page! It took me a few hours last night and a couple this morning.
I a complete noob to the concept of using trend lines. Systems I've used in the past never dealt with them. Could someone point me in the direction of how to properly draw trend lines? I googled a few pages and I'm still a little confused on them.
1. Do you have to wait until you're in a trend to start drawing them?
2. If so, after spotting a swing high or swing low, you have to have another swing high or swing low to connect to correct?
3. Do you begin drawing trend lines the moment you see a swing high or swing low? Yes right? Because they are constantly changing creating different points of support/resistance throughout the day?
Sorry, I know this is a newbie question, thanks again for any help and thanks again for everyone who's contributed to this thread.
Quote from booyah:
Jack,
This is a great thread and you wont get flamed for being a noob.
This subject is straightforward but can be confusing for a noob, but this will really help.
1. Read the first several pages of this thread a few times. Look at the charts posted and the comments about them a couple of times.
2. Check out stockcharts.com go to chart school section, its nicely organized and explains all the topics relevant to us.
3. If you're a super noob and not ashamed go to your bookstore and check out Technical Analysis for dummies. They really "dumb" it down but for a super noob its really useful.
Consider this a new major in college, and you have to start with the 101 level courses.
Good Luck.
Here's a sample of using a trendline with an uptrend. They are VERY
subjective.
Hope it helps.
Anek
Jack,
I think that is where the difficulty can lie. As Stealth Trader had said on
another Thread identifying strong trends with the eye and drawing trendlines is
more of an art than a science.
Thru time and hardwork you refine your technique in finding them . And your
"artwork " soon transforms into Masterpieces !!
![]()
Jack or anyone else,
Don't feel the slightest hesitation when you have a question. No matter how
basic it sounds.
In fact, the less experience you have trading the more this journal will help
because you won't start with bad habits. Otherwise known as calling tops and
bottoms WITHOUT SUBSTANCE and using stupid slow ass indicators as crystal balls.
I usually visit, although not very active, other threads and sometimes public
channels and the things I see confirm why most people fail at daytrading.
On strong uptrends, you see a marathon of shorting here, shorting there, this
must be a top! Followed by massive amount of stop losses or the devil himself,
averaging downs (omg, I can't take a small loss, I must get it back! Then they
lose even more).
On strong downtrends, you see the opposite.
Hell I see it in the mighty "Elite Trader" forums all the time, just funny
stuff. Wonder how long it will take them to get it. The biggest attitudes the
shittiest trading. ie WE GOING UP MONDAY, NO IT WILL BE BLACK MONDAY, etc etc,
hilarious.
Anyway....
Don't call yourself a noob you are probably WAY ahead of the rest without even
starting, and that's no joke.
Anek
Quote from jimmygold:
Jack,
I think that is where the difficulty can lie. As Stealth Trader had said on another Thread identifying strong trends with the eye and drawing trendlines is more of an art than a science.
Thru time and hardwork you refine your technique in finding them . And your "artwork " soon transforms into Masterpieces !!
For simple drawing of trend lines, see the following link for some basic,
generally accepted guidelines (I believe this approach follows what is put forth
in Sperandeo's book).
Also, this is applicable to any time frame, beyond what is mentioned in the post
- one can use it for tick charts if desired. Remember that the slope of trend
lines (especially intraday) can change due to reports, time of day, etc, so
don't hesitate to redraw to most closely follow the current pace of the mkt.
http://www.elitetrader.com/vb/showt...311#post1311311
Good luck ...
Anek, great tip on giving line some room.
Razor or anyone else, do you still use Heikan candles for exits?
I have been using normal candles for entries and switch to Heiken chart for
exits, helps keep 1st and 2nd target longer.
Thanks for confirming that XP Pro is the way to go for now.
Got work to do now ![]()
Anek
A.
Anek, you just too cool. No response necessary.
Ahhh,
you guys are all awesome! What a great thread.
Ok, so trend lines ARE pretty subjective. That was the main thing I was trying
to figure out. Just didn't want to be doing something completely wrong and screw
up everything I've learned from this thread.
Also Anek, thanks for posting that picture with your commentary. It helped a
lot!
Thanks Anek
Hi Anek,
Just wanted to say thanks for the thread and all the helpful information with
one question that is bugging me. Say an uptrend has been established, and you
see a double top or even triple top instead of a HH, how do you treat that? Is
the trend still valid as long as you have a LH LH?
Thanks in advance,
Eric
Eric,
If the last high was not a HIGHER HIGH be very cautious. Also be very suspicious
of higher highs by only 1 or 2 ticks. Especially as it approaches the trendline.
A good example is the trendline chart I posted today.
Trendline breaks are usually more aggressive when the last high was not a higher
higher. Especially if it was a LOWER high.
Technically, if a higher high was not achieved it is NOT an uptrend.
Anek
Look at the difference, see how there are signs of less conviction in making
new highs?
All those hints help.
Anek
Quote from jack411:
Ahhh,
you guys are all awesome! What a great thread.
Ok, so trend lines ARE pretty subjective. That was the main thing I was trying to figure out. Just didn't want to be doing something completely wrong and screw up everything I've learned from this thread.
Also Anek, thanks for posting that picture with your commentary. It helped a lot!
Hey,
Yea I am still using the Heiken Ashi bars to help with exits.
Cheers ![]()
Quote from farscape105:
Anek, great tip on giving line some room.
Razor or anyone else, do you still use Heikan candles for exits?
I have been using normal candles for entries and switch to Heiken chart for exits, helps keep 1st and 2nd target longer.
Quote from Razor:
Hey,
Yea I am still using the Heiken Ashi bars to help with exits.
Cheers
I enjoy a nice Guinness myself
![]()
Quote from Anekdoten:
Heineken here
Anek
Ditto, also Bully Porter or IPA's, hophead here.
Mission accomplished, piece of crap Vista wiped from all systems. System
seems 4x faster now.
Clean OS (XP Pro)
Clean Tradestation
Due to upcoming holiday will probably hit Monday - Wednesday hard and take the
last two days off due to low volume.
Attached trading view before Vista got wiped out but kept the same Workspace.
Anek
Interesting Daily ES Chart for Swing Traders.
The bullish scenario is not complete but it's halfway there.
Double Bottom - Check
Bullish hammer at the bottom - Check
Break of a Downtrend line - Maybe, one body close above it is too premature.
Needs a higher high with or without a higher low then things might get
interesting. Has been a while since my indicator plotted two blues in a row,
only one confirmed for now, current bar still open of course. A solid red body
has not been since in over a week, check the micro price action, higher lows,
higher lows.
That 1492-1510 is an important area.
Needless to say Im not touching swing trading with a 10 foot pole
![]()
Just not for me, I love my 3-10 tick stops just fine
![]()
Anek
love your trading page, i've got a t4 screen and go back and forth to bar chart andbig chart,what does an interactive chart and trading page in one cost per mo. and who has it
Hi,
Net Loss -$28, on about 8 trades, made net +1.50 points but the commish put me
slightly negative, did OK but missed a couple of nice trend trades...overall
happy with performance.
Did very well on GOOG today and small win on AAPL.
Cheers ![]()
Dont feel bad. 3 trades here and down commissions. One breakeven, one winner, one loser. Volatility has certainly dried up for the moment. I have a feeling it will be back before long.
One can only hope....little annoyed that I shut down a little early, perfect
NQ short for over 10 points around 3:30pm EST....oh well, such is life
![]()
Quote from GaryN:
Dont feel bad. 3 trades here and down commissions. One breakeven, one winner, one loser. Volatility has certainly dried up for the moment. I have a feeling it will be back before long.
I did not trade today, could not get my butt out of bed so slept all day long
like a log.
![]()
Anek
Quote from Anekdoten:
I did not trade today, could not get my butt out of bed so slept all day long like a log.
Anek
__________________
PM
Quote from PaxMax:
Trader's block ?
ROFL ![]() gotta love it !
gotta love it !
Quote from Anekdoten:
I did not trade today, could not get my butt out of bed so slept all day long like a log.
Anek
is it just me or did you guys have a really tough day after 12pm est. after initial downtrend. and by any chance does anyone here have a dell 22 inch lcd im considering gettiing one and the price is very good right now.
Yep, some conflicting setups.
Anek, here is your quote from original post.
"As you get more experienced you can profit off consolidation by fading
support/resistance but for now, stick only to
the meaningful trends."
Can you comment how often you do range plays and some techniques. Besides using
triangles for congestion.
And do you ever make countertrend trendline break trades? Or is this an absolute
no no?
Or should one avoid all of the above until say year of consistent trend/PA
trading.
Far,
I think it would add too much confusion if I discuss countertrend and profiting
off consolidation when AHG is exactly the opposite.
For that matter I think it's best that I don't discuss such topics.
The one exception is symmetric triangles.
Anek
Quote from farscape105:
Anek, here is your quote from original post.
"As you get more experienced you can profit off consolidation by fading support/resistance but for now, stick only to
the meaningful trends."
Can you comment how often you do range plays and some techniques. Besides using triangles for congestion.
And do you ever make countertrend trendline break trades? Or is this an absolute no no?
Or should one avoid all of the above until say year of consistent trend/PA trading.
That fine, getting ahead of myself. Would another exception be Double top/bottom going back into longer term trend?
Far,
I usually say an uptrend is composed of at least two higher highs and two higher
lows but if I see a solid double bottom followed by only one higher high/higher
low I might take the play depending on S/R and price action.
Same with double top and ll/lhs.
Anek
Use extra caution this week, low volume due to upcoming long weekend may
cause you to over trade.
Only trade optimal looking setups or take the week off.
I'm taking Thursday and Friday off and already skipped Monday so it looks like
I'm following my own advice, for now
![]()
At the very least, it should be choppy and boring.
Anek
08.27.07
Personal analysis for my records, posting in case it's helpful.
Anek
Anek,
Do you take trades based on your oscillator? You have arrows that point to it.
I know it's super secret, so Yes/No will do.
![]()
That chart doesn't look so bad. A few nice setups that would have made the day
worth it.
B
Quote from Bogwaluth:
Anek,
Do you take trades based on your oscillator? You have arrows that point to it.
I know it's super secret, so Yes/No will do.
That chart doesn't look so bad. A few nice setups that would have made the day worth it.
B
ES Multi Day analysis
TL Test coming from a LOWER HIGH preceded by a double top.
Keeps getting interesting.
Anek
Hi Anek,
8/26 date on that chart ?
Cheers ![]()
Quote from Anekdoten:
ES Multi Day analysis
TL Test coming from a LOWER HIGH preceded by a double top.
Keeps getting interesting.
Anek
Quote from Razor:
Hi Anek,
8/26 date on that chart ?
Cheers
Cool thanks ![]() [
[
I am waiting on a retrace of this down move ah to try a short....we shall see,
not gonna stay up all night for it though
![]()
UOTE]Quote from Anekdoten:
End of 08/26 ?
Anek [/QUOTE]
Are you reading HH/HL's or LH/LL's per every new bar that is formed or per
pivot / wave? Looks like bar to bar from the charts but just wanted to be sure.
A little different for me because i'm not used to volume/tick charts yet.
~Cx
Cx,
Single and multiple bars at the same time.
Anek
A. on your chart, what was the basis for the short around 14:50?
Quote from bmwhendrix:
A. on your chart, what was the basis for the short around 14:50?
Sayonara HA Bars.
Anek
Are you talking out loud or did you stop using the HA bars? ;)
Weren't you just using those to help you decide whether or not to stay in a
trade?
Quote from Bogwaluth:
Are you talking out loud or did you stop using the HA bars? ;)
Weren't you just using those to help you decide whether or not to stay in a trade?
How? What have you replaced them with?
Quote from Bogwaluth:
How? What have you replaced them with?
last third of that chart was today ,yesterdays low was 60 and change
Ya the chart has the whole data.
Anek
Saw a high probability short in AH....
And the outcome, time for bed.....
Quote from Anekdoten:
08.27.07
Personal analysis for my records, posting in case it's helpful.
Anek
__________________
Lets all drink to the death of a clown.
Babe,
That's 5000 shares too right ?
Anek
Quote from jimmygold:
Shorting on sideways consolidation or shorting a slight pullback on moderate Vol. in a very strong HH HL uptrend will be one quick way to the poor house !!!
You might want to go back and reread this Thread from the beginning.
You will surely blow your account out in no time trying to counter trend trade !!
Keep it simple
Quote from Anekdoten:
Poor Oscar Carboni, shorted a clear uptrend, got stopped out, geez I wonder why.
25 years of trading for the win!
That guy cracks me up.
Anek
Quote from Stealth Trader:
Tsk, tsk. Not nice to poke fun at those who are less fortunate!
You know, instead of taking the path of deceit by becoming a snake oil salesman, if he would have just asked, I'm sure you could have helped him succeed in his trading!
st
Quote from babe714:
your posted charts are very informative and helpful , thanks
my charts had a higher high where you had a double top, that HH was confusing to me at that point .
Quote from Anekdoten:
It takes quite a bit for me to make fun of a fellow trader, pro or newbie but deleting my posts when I was simply trying to make sense out of his trading was a bit disrespectful.
Funny guy though, can't take that away from him.
Anek
A quick hello and checking progress of the thread.
I have been taking a few days off each week during this low volume period and
will gear up around the second week of September and hit it hard through the
best trading season coming upon us.
Just taking a little time this morning to scan through the thread and am pleased
to see there are actually a few people following your methodology and seeing the
light so to speak. I also see many jumping from thread to thread on ET and other
boards seeking answers about other methods and trying to follow anyone who is
running a journal. To each there own, but I can assure those who are doing this
there is no future in doing so. They need to pick their poison, and stick with
it. If they don't have the discipline to master one tried and true method,
trying to mix various others into the fold will only cause them to fail and
cause you to spend precious time answering questions they have no intent of
following. No disrespect to anyone intended, just an observation.
To piggyback on this post, I have received numerous PM's from this thread and
others. Anek has laid out the plan in great detail. There's really not much else
to add. As soon as Anek is weaned from those colored HA bars, candles, and
indicators, he'll be a master guru!
![]()
![]()
![]() Seriously though, asking me
what I think about hersey's method, or bubba's method, or why I don't trade a
certain way, or what I think about a certain indicator, etc., etc. is
counterproductive. And what's with all the one and two post posters????
Seriously though, asking me
what I think about hersey's method, or bubba's method, or why I don't trade a
certain way, or what I think about a certain indicator, etc., etc. is
counterproductive. And what's with all the one and two post posters????
![]()
This is most likely one of the best threads to ever grace ET, if not the best.
It is very difficult to post throughout the day and stay on top of your your
game trading. I won't do it because it distracts me. As such, I wonder how many
truly appreciate the effort Anek is putting forth sharing a very simple method
to extract money from the markets on a daily basis, or are just here cruising
through for the human interaction/BS session until the next journal comes along.
Enjoy the long weekend, rest up, get ready for the last quarter and the upcoming
election year. I am not one to predict, but I would venture to say we have not
seen the last of the volatility, will revisit the highs, make new highs with
severe pullbacks, and as such, we will be pulling in quite a few days of 20-30
ES points or equivalent using HH/LL trends. Follow the money and the money will
flow into your account, not out.
st
Nice downtrend, "love is in the air!, la la la "
Anek
Quote from Stealth Trader:
This is most likely one of the best threads to ever grace ET, if not the best. It is very difficult to post throughout the day and stay on top of your your game trading. I won't do it because it distracts me. As such, I wonder how many truly appreciate the effort Anek is putting forth sharing a very simple method to extract money from the markets on a daily basis, or are just here cruising through for the human interaction/BS session until the next journal comes along.
st
__________________
Boib
Its easy to make a small fortune if you start with a big one
I agree as well; however, I also will admit that this can be a personal thing
because finding a method that works for you and your personality / emotional
make-up is the key....some others may have found another thread with another
method more adaptable to them.....IMHO ofc
Cheers ![]()
Quote from Boib:
Very very true.
Best ever.
Definitely a great thread.
I've learned the most from this one.
What a great day for the AHG system.
Today I made a commitment to trade with the system only and not like I'm playing
Halo on XBOX. Discipline and the mental aspect is definitely the hardest part in
my opinion. Today I wish this paper money was real money because I definitely
would have made a good chunk !
I hope a lot of you system following guys made some serious loot today.
Keep up all of the great posts and contributions. The best thread in all of ET !
Ok that was free money, literally, not even a worthy fake to the upside, sick
and I love it.
Thank you, hmmm contrarians ? ![]()
Off to bed trailing stops in place in all positions.
This trader needs to rest.
Good trading guys.
Anek
Quote from Anekdoten:
Babe,
That's 5000 shares too right ?
Anek
__________________
Lets all drink to the death of a clown.
Chalk up another killer day for the trend followers. Slight lull through
lunch but we needed a rest.![]()
I hope none of you guys got up to go to the beach in the afternoon.
Man I wish I had real money on the line today. Today was a kick ass day.
I hope you guys made some serious dough. Today was a trend traders dream.
By the way, does anyone else use OEC (open e cry)
Hi,
Net Gain $156 trading 1 NQ. Was happy with the day but left way too much on the
table....oh well... work in progress
![]()
Did not do too well on GOOG, SPY and about breakeven on AAPL.
Cheers ![]()
Here is a VERY tricky scenario that I'm posting for observation.
Remember that to jump long, and most important after massive downside, you need
2 HHs and 2 HLs or a Double B followed by a HH and HL.
I think this situation is peculiar and merits discussion.
Anek
Needless to say, react to price when a Double B or a Double T fails. The
action can be brutal, as it was this afternoon.
Even if the reversal fake out took your small stop the market gave you an even
better opportunity after the scenario failed providing massive gains with very
little effort.
This system protects you from big losses and encourages big wins.
Keep studying and learning. Don't let a small stop or a failed scenario get rid
of your concentration. We are not shooting for accuracy but for disciplined
reaction towards logical price movements.
Always readjust, always. Follow price like if it was a girl with a great ass, up
and down, wherever "she" goes.
Sorry ladies, not sure how to apply to the female point of view
![]()
Anek
Depends how many bars you require for a swing. After the HH there are a
couple of lower bars and a possible move up that would have caught the attention
of many for a long entry based on those 2 lower bars
Looks like something I may have fallen for.
Quote from bmwhendrix:
Depends how many bars you require for a swing. After the HH there are a couple of lower bars and a possible move up that would have caught the attention of many for a long entry based on those 2 lower bars
ST,
If the indicator is home brewed and 100% based on price action, I'll have to
disagree with you.. Needless to say you must pay the price and do massive
research even learn how to code them for the chosen platform.
"Kill them all except your own" that's what a very respected trader once told
me. Took me years to follow his advice. Why are we so stubborn ? I suppose
that's a whole new discussion.
It's the common crapola that is worthless.
Here is how mine keeps me out of trouble and gives me the best entries even when
action gets tricky.
Anek
Quote from Cxinvest:
Yeah, that's kind of what I was asking about a few pages ago. You can run HH HL bar per bar or look at it from each swing/pivot standpoint.
Quick question. If you are using indicators that are developed 100% from
price action, why not just let the price action show/tell you what is happening
instead of referring to an indicator to try and tell you what is allready
happening as price moves/develops itself. Confuses me...but just seems redundant
or extra.
~Cx
Somehow in those past posts I forgot to mention this.
When looking for entry, say a long or even re-entry, you want strength to return
in the pullback and when that happens make sure price did not violate the
current highs and lows.
At this point this might sound trivial but sometimes in the heat of the moment
we forget this.
Extremely important and how in the world do I make stuff bold in this forum ?
![]()
Anek
Quote from Anekdoten:
Cx,
Give those waves similar frequency, it will help you determine the meaningful pivots.
Anek
Quote from Cxinvest:
Quick question. If you are using indicators that are developed 100% from price action, why not just let the price action show/tell you what is happening instead of referring to an indicator to try and tell you what is allready happening as price moves/develops itself. Confuses me...but just seems redundant or extra.
~Cx
Quote from Cxinvest:
Do you need to see the HH HL or LH LL in waves following a big trend up or down? The example I think of that makes me ask this is when you get those nice bounces straight up or down in the other direction causing alot of the new move to occur and lose juice before you get a shot at it. Probably has to do with where you set your Tick/volume charts...but just curious. Thanks!
~Cx
Quote from Anekdoten:
Cx,
At first I never revealed my home brewed stuff because I did not want to do exactly what Im doing now, confusing traders like yourself.
Cx,
Happy to help.
Anek
Hi Anek
This is how i see the chart patterns. My comments are in red font. When I wrote
DT(double top), i meant resistance not DT
Quote from Anekdoten:
Here is a VERY tricky scenario that I'm posting for observation.
Remember that to jump long, and most important after massive downside, you need 2 HHs and 2 HLs or a Double B followed by a HH and HL.
I think this situation is peculiar and merits discussion.
Anek
The larger wave pattern
Ab,
Good stuff, logical reasoning.
Anek
Memorize this pattern, it will pay for a vacation trip one of these days.
There is nothing in trading like a major failure giving birth to a new powerful
trend or continuation.
It is the most important lesson of 08.28.07
Anek
Quote from abaker:
The larger wave pattern
Thanks Anek.
Thats a good point jimmy. When ive traded this scenario ive always sweated
buckets lol and been uncomfortable. As i was always aware, that i was shorting
close to a potential triple or double bottom
Quote from jimmygold:
To me this tricky scenario is too much congestion for most to trade. I say stay out unless your Anek or some of the other very expert, nimble traders here !!
Quote from abaker:
Thanks Anek.
Thats a good point jimmy. When ive traded this scenario ive always sweated buckets lol and been uncomfortable. As i was always aware, that i was shorting close to a potential triple or double bottom
Quote from Anekdoten:
Extremely important and how in the world do I make stuff bold in this forum ?
Anek
Thank you! ![]()
Great journal Anek, awesome contribution to ET
Just curious if you trade various products and markets, or do you stick to stock
index only?
S,
Thanks glad you like it.
Just equity indexes, if you ever find something that trends better with good
liquidity and similar tax system please let me know.
I've looked at FOREX but it's not for me.
Anek
I was thinking other futures markets ie commodities, bonds, etc.
Sponger,
Never really examined, should I ?
On a side note, terrible internet connection today
![]()
Anek
If the strategy works on stock index....why wouldn't it work on any other
product or market? Just making an observation, that's all.![]()
S,
Yes agree, as long as it's trendy it should not be a problem.
Anek
Choppy today, no trend, no play.
Except a hero type of scalp where I lost a point
![]()
Anek
The grains trend a lot but you don't have near the liquidity you have in ES.
Bingo,
Thanks, I will check them out.
ES Update - Small uptrend formed out of the symm breakout.
Anek
Corn has the most volume.
$50 a point and $12.50 per tick in the grains like ES.
If you are in to spread trades the grains are good for that.
Just an observation. on the 125,000 vol chart we are now making a first pullback after a clear double top. FWIW.
bmw,
here is what I got...
Anek
Yep, It will be intersting to see how the 60-65 area reacts.
We buy a pullback in an uptrend !
Yeeeeehah breakout baby!
Anek
Quote from Anekdoten:
ST,
If the indicator is home brewed and 100% based on price action, I'll have to disagree with you.. Needless to say you must pay the price and do massive research even learn how to code them for the chosen platform.
"Kill them all except your own" that's what a very respected trader once told me. Took me years to follow his advice. Why are we so stubborn ? I suppose that's a whole new discussion.
It's the common crapola that is worthless.
Here is how mine keeps me out of trouble and gives me the best entries even when action gets tricky.
Anek
ST,
You are of course entitled to your opinion. The fact of the matter is I make the
same decisions faster with my stuff and so do those that were part of the
project. That is undisputed, not a single member of the project disagrees.
On top of that you are incorrect about the concept that is was based on when in
fact the real concept is exactly what you and I do (I think) but in an automated
form.
As far as stochs, ha bars etc, you could not be more right there.
Do not confuse an Apple Pie from Burger King from one that was cooked by a sweet
"grandma", there is a big difference.
Anek
ST,
See those highs and lows bar calculations you do manually ?
Well I do them automatically in multiple depths in a historical form.
I'm sorry but my brain cannot keep up with all that at the same time, the
computer can.
Anek
Anekdoten and Stealth Trader,
How do you guys handle trading in the "dead zone" (12-2 est)? Do you avoid it or
allow the charts to tell you whether or not to trade?
Thanks in advance.
MDT
MDT,
A chart is a chart, if I I see an opportunity I take it. Just need to avoid the
chop.
Obviously the higher the volume the easier it gets which is why some people
avoid lunch hour but still plenty of opportunities can be found in such time
frames.
Anek
Wow,
YM providing NO Pulbacks for buying of recent HH HL trend. Impressive uptrend in
last 30 minutes or so but no good entries. YET.......................![]()
Quote from jimmygold:
Wow,
YM providing NO Pulbacks for buying of recent HH HL trend. Impressive uptrend in last 30 minutes or so but no good entries. YET.......................
Quote from Anekdoten:
ST,
You are of course entitled to your opinion. The fact of the matter is I make the same decisions faster with my stuff and so do those that were part of the project. That is undisputed, not a single member of the project disagrees.
On top of that you are incorrect about the concept that is was based on when in fact the real concept is exactly what you and I do (I think) but in an automated form.
As far as stochs, ha bars etc, you could not be more right there.
Do not confuse an Apple Pie from Burger King from one that was cooked by a sweet "grandma", there is a big difference.
Anek
Quote from Anekdoten:
ST,
See those highs and lows bar calculations you do manually ?
Well I do them automatically in multiple depths in a historical form.
I'm sorry but my brain cannot keep up with all that at the same time, the computer can.
Anek
ST,
I never said I could be faster than price, only that I can summarize all
relevant aspects of price action FASTER with a computer than manually.
When I joined Pure Tick I did so looking for guidance as I had no real
experience with futures, although I had been daytrading equities for nearly half
a decade. No shame in that.
On top of that there was not single day during my stay in there where I did not
out-trade the head trader of the room.
There is plenty of evidence about that, why do you think I quit their service.
Now, I'm not sure if I can out trade you ST, but one thing is for sure, I can
definitely out class you as your attitude stinks.
So you don't like indicators, neither do I, but don't speak about what you don't
know.
And last but not least my work is not for sale or will it ever be, do I look or
sound like a salesman to you in this thread ?
Who's the insinuator now huh?
Anek
Quote from Stealth Trader:
My most sincere apologies. I didn’t realize that someone who recently subscribed to a fee-based trading room seeking help would be so privy to owning a secret indicator that is faster than price itself. Given the tens of thousands of people before you creating market algorithms and studies, many of whom hold doctorate degrees with access to huge budgets, I am in awe that you and a couple of buddies were able to write the holy grail in easylanguage over a few beers. Those little neuro induced red dots are simply amazing, and I now bow humbled before you. I await your forthcoming book with baited anticipation. I only hope you can find it within yourself to honor me with a signed copy.
Again, my humble apologies. With tongue in cheek, I remain
Sincerely,
st
P.S. If you should ever decide to sell your indicator, does it come in green?
__________________
If at first you don't succeed ...
Quote from Anekdoten:
When that happens, go to a smaller chart.
Anek
Quote from jimmygold:
Wow,
YM providing NO Pulbacks for buying of recent HH HL trend. Impressive uptrend in last 30 minutes or so but no good entries. YET.......................
Quote from jimmygold:
Two nice trades to end the day with pullback buys on HH HL....... Very nice volatile day with some lucrative intra day trends
Hi,
Net Gain $95 NQ's.
Nice gain on AAPL, about breakeven on GOOG.
Happy with the day, tried to ride a few positions for longer holds but came back
to hit +4 and +3 gains, they went as much as +6 and +7 in my favour before my
trail stop hit, no worries though because hey could have easily turned into +10
gains if the trend would have stayed intact.....I will get um
![]()
Cheers ![]()
PS: Had one awesome trade today where I knew I could get in and have only .75
risk with potential for a +3.00 gain, well got in and ended up with +4.25 on the
trade with only .75 initial risk.....gotta love trading with the trend
![]()
Razor,
Good job!
Cheers Professor ![]()
Quote from Anekdoten:
Razor,
Good job!
Well after years of trading equities, I am now putting that to rest for the
time being as my ES account has been validated and is up and running now. Also I
am trying the tick/volume bars now instead of timing increments. So yeah... new
to ES or futures in general thought I do have experience of them, and new to
volume/tick charting. Anyway I'm excited to begin applying this system that I
have been trying to apply in equities and have had no such luck with. So if Anek
or any of you guys want to give any advice right out the start that would be
cool. I'll probably be asking some things that seem simple to you, so bear with
me. More than anything the tick/volume charting is throwing me off a little just
because i've always used time frames. Anyway enough rambling, got to get this
new setup completed ![]()
![]()
On a side note, not sure what you are trying to prove StealthTrader but what
Anek is doing here is quality. I guess if you can't appreciate the effort and
time he's put into this thread, maybe it's just a better idea that you troll
somewhere else. Should just accept that you guys agree on a bottomline basis as
far as price goes and leave it at that. Don't get me wrong I'm not doing
personal attacks, but I think the others that have been following his thread
since the beginning feel the same way.
~Cx
P.S. I plan on alternating between paper trading and 1 ES for now. Does that
seem reasonable at start?
Anek and Stealth are both good guys. Glad they are around.
Quote from JimmyJam:
Hey man, we're all making money here if we're even remotely as good as we present ourselves to be on Elite Trader.
Let'em run his thread helping the guys who can't see what is obvious to us (although point-in-fact, we may not see exactly the same things ...) and stop trying to run into the ground a thread, which heretofore, had been a very clean place, someplace to just come and read about trading, a profession and discipline which we all profess to LOVE.
And FTR, it's quite possible for Anekdoten, myself, or anyone else to come up with a trading methodology which has escaped the purview of all the quants under the sun.
Good trading,
Jimmy Jam
Cx,
Even if you use tick/volume bars you still got time in the bottom as reference,
maybe that helps.
As much as it kills the excitement I would follow this path first:
- Paper/Sim
- Minimal Car Size
- Minimal Car Increment
Only take the next step if you see profitability, if profitability fades away,
go back a step, no exceptions.
I know it is now what you want to hear but it's what I wish someone had told me
when I first started daytrading.
Anek
Quote from Anekdoten:
ST,
I never said I could be faster than price, only that I can summarize all relevant aspects of price action FASTER with a computer than manually.
When I joined Pure Tick I did so looking for guidance as I had no real experience with futures, although I had been daytrading equities for nearly half a decade. No shame in that.
On top of that there was not single day during my stay in there where I did not out-trade the head trader of the room.
There is plenty of evidence about that, why do you think I quit their service.
Now, I'm not sure if I can out trade you ST, but one thing is for sure, I can definitely out class you as your attitude stinks.
So you don't like indicators, neither do I, but don't speak about what you don't know.
And last but not least my work is not for sale or will it ever be, do I look or sound like a salesman to you in this thread ?
Who's the insinuator now huh?
Anek
Quote from Cxinvest:
Well after years of trading equities, I am now putting that to rest for the time being as my ES account has been validated and is up and running now. Also I am trying the tick/volume bars now instead of timing increments. So yeah... new to ES or futures in general thought I do have experience of them, and new to volume/tick charting. Anyway I'm excited to begin applying this system that I have been trying to apply in equities and have had no such luck with. So if Anek or any of you guys want to give any advice right out the start that would be cool. I'll probably be asking some things that seem simple to you, so bear with me. More than anything the tick/volume charting is throwing me off a little just because i've always used time frames. Anyway enough rambling, got to get this new setup completed
On a side note, not sure what you are trying to prove StealthTrader but what Anek is doing here is quality. I guess if you can't appreciate the effort and time he's put into this thread, maybe it's just a better idea that you troll somewhere else. Should just accept that you guys agree on a bottomline basis as far as price goes and leave it at that. Don't get me wrong I'm not doing personal attacks, but I think the others that have been following his thread since the beginning feel the same way.
~Cx
P.S. I plan on alternating between paper trading and 1 ES for now. Does that seem reasonable at start?
Quote from Stealth Trader:
The thread was supposed to be a helping hand teaching HH/LL based on pure price action. Unfortunately, it's been everything except that
st
Quote from bmwhendrix:
Anek and Stealth are both good guys. Glad they are around.
Alright everyone,
No need to have this thread start to sound like the rest of them on this site.
Anek I still think you're the man for doing what you're doing, and ST you're
probably a better trader than most of us, but no need to break the guys balls
lets all just move on, and focus on making some loot !
Razor,
Question for you. You said you risked .75 for a potential upside of 3 points and
you ended up making 4.25, How did you figure this potential upside, would you
mind showing on a chart or possibly explaining.
Thanks Man.
Quote from Anekdoten:
Cx,
Even if you use tick/volume bars you still got time in the bottom as reference, maybe that helps.
As much as it kills the excitement I would follow this path first:
- Paper/Sim
- Minimal Car Size
- Minimal Car Increment
Only take the next step if you see profitability, if profitability fades away, go back a step, no exceptions.
I know it is now what you want to hear but it's what I wish someone had told me when I first started daytrading.
Anek
Prepare yourself psychologically for when a failure pattern, fails.
When this happens you adapt FAST and you do not let go. Small loss, adapt, ride
the new trend/winner to kingdom come.
Explanation attached.
Anek
And the mud starts flying.....I knew it eventually would...just didn't know
from whom....![]()
Stealth Trader:
It's not what you said...it's how you said it.....
Anek:
The "secret indicator" on your chart has also been bothering me as
well.....fwiw..it's probably not a good idea to post on your chart an indicator
which you can not share...it's just causing confusion....
Other than that...let's get this thread back on track......
Let's KISS and make up ![]()
Quote from Anekdoten:
Take a poll, ask the readers.
Personally, I think you are full of it. I use personal tools to enhance the trading. I've always said it will never be a requirement.
Tell you what, please leave my journal, I no longer welcome you here.
Anek
Quote from monti1a:
Stealth Trader:
It's not what you said...it's how you said it.....
Looks like this thread is going the way of all threads here on ET.
Signing off. It was good while it lasted.
Bing
Yo,
Absolutely,
I will post one a little later tonight showing exactly what I did and my
reasoning, I look for these everyday though I don't get um all the time
![]()
Cheers ![]()
Quote from booyah:
Alright everyone,
No need to have this thread start to sound like the rest of them on this site.
Anek I still think you're the man for doing what you're doing, and ST you're probably a better trader than most of us, but no need to break the guys balls lets all just move on, and focus on making some loot !
Razor,
Question for you. You said you risked .75 for a potential upside of 3 points and you ended up making 4.25, How did you figure this potential upside, would you mind showing on a chart or possibly explaining.
Thanks Man.
ST,
Here is your chart with one of my PA tools.
You want proof of efficiency, here it is big guy.
Now, are you still more efficient than that ?
Anek
Ok,
Here is my .75 risk and 4.25 gain trade that I did today. Of course they don't
always work but the r/r is awesome and
you have lots of things going in your favour:
1) trading with the trend
2) at a 40 - 50% retrace area
3) Prior pivot support area (resistance if it was a short)
Hope it helps, cheers ![]()
http://i1.tinypic.com/5zekok6.png
Note: This went .50 agains't me which is the most I would want the support area
violated before it turns up, hence the .75 stop. I do this with most of my
trades. Where I think there is support or resistance I will usually set my stop
.75 above or below this area just incase they do a little stop run .25 - .50
Razor,
Nice play there on the chart, good stuff.
Anek
beautiful razor.
![]()
Cheers guys ![]()
To all those who are trashing this thread, please move on. The intention on
the thread is not to see whos more accurate and whos got what trading style. If
your style works for you then GREAT for you. Let everyone else learn from those
who are trying to teach something to those who are starting their journey. There
is a THOUSAND right ways to trade and THREE thousand ways to do it wrong.
If you have nothing good to contribute in a polite way, we would appreciate if
you be quiet and move on to other threads. Your method is not the only one that
works, there are plenty of methods that do. This is a thread for struggling
traders so allow them to evaluate some usefull tools so that each of them can
find the method that works for them.
Its people like this who really screw up interesting threads and that is the
reason the most experienced ones dont wish to share. People put your EGOS in
your pocket, this is a place to learn and teach not argue. Dont turn an
interesting thread into something disgusting.
People who followed this journal from beginning know, that Stealth Trader
contributed, and participated in this journal from the beginning. He had been
nothing, but supportive of this journal.
The only thing ST was complaining, was about Anek's flip flopping remarks about
canned TA indicators, the same indicators that Anek had started the journal
with. But in the course of communication, the two misunderstood each other.
Happy following highs, and lows ![]()
Schaefer
__________________
Easy does it, one stick at a time!
Quote from Anekdoten:
ST,
Here is your chart with one of my PA tools.
You want proof of efficiency, here it is big guy.
Now, are you still more efficient than that ?
Anek
ST, It was nice to hear that you have had the same chart setup and
methodology for several years without change, very inspirational. I like most
others tend to take a look at various ideas and experiment all the time. Not
that I would trade those changes, just taking a looksee for that better
mousetrap. On the 10000V chart, I find myself getting itchy, but I trade while I
do my "real" job and miss a lot on faster charts. The way you and A trade is
fractal in nature and the timeframe should not matter, just having the right
mindset, which I am working dilligently on.
Thanks to all.
ST,
I feel like I'm being judged, kind of sucks, after all the work in the journal.
I will try to answer all your questions to the best of my abilities.
- Determine the trend, enter on 1st row of dot that agrees with it, exit on
change. Vertical line is entry, change of color is exit, very simple.
- Efficiency, you said an indicator could not improve PA analysis, I said a
computer could help you analyze this faster due to speed and memory. You
demanded proof, I presented it, if you can do better than that, my hat is off to
you.
- I joined a fee based futures only room because I knew nothing about futures.
My background had been equities, although successfully for many years. My
performance and contribution to the room was pretty obvious. As far as the fees
due to countless referrals, I ended up receiving payments from the service
instead of making payments, I still do, without even being a part of it anymore,
very nice of them. I realized I had no business left in the room, was clearly in
another league and decided to leave, easy to verify this. At some point I was
even hinted if I was somehow interested in assisting even joining the team, I
respectfully refused as I chose daytrading as a profession for many reasons. Who
the hell wants customers, rigorous schedules, etc.
- I stopped using "canned" indicators a long time ago but before the proprietary
stuff was finished, that's what I used. If I made it a mistake by introducing
them, it was not intentional. Notice how slowly I have been "deleting" them
myself to see if subconsciously, readers to the same. I still fee HA bars are of
value to them but in the end, it's not yours or my choice, it's theirs.
- With Price Action, I get killer entries and killer exits, with PA indicators
even better, I felt I had some explaining to do which is why I decided to reveal
them. Got numerous PMs due to this. Again, if I made a mistake by revealing them
it was not intentional. Somehow I knew this would lead to confusion but I hated
"hiding" stuff.
- Anger, I did not get angry but I sure did not appreciate your "tone" when
voicing your opinions. I'm not charging here, I'm not Oscar Carboni you know,
thank God.
Once again I remind you that EVERYTHING I use is a summary of Price Action and
Price Action alone, computed in a way that is more efficient for the naked eye.
It is by no means a requirement, something I said all alone since the
introduction, it just makes you faster (not faster than price, just faster in
terms of reactions), more efficient.
This thread is not about if Anek can trade, this thread is about Anek helping
people become better traders and I believe I have accomplished that with a lot
of people, judging from the dozens of PMs I get on a daily basis. Funny enough I
have yet to read from someone say "hey man my trading is worse now, you evil
man".
Now, that I have explained everything to the best of my abilities I respectfully
request that you stop breaking my balls and lay off the personal attacks and
suspicious assumptions. Stick to trading.
Thank you.
Anek
Re: AHG - Profitable Strategy for Struggling Traders
Quote from Anekdoten:
STEP 6 CHART TYPES
Longbars are evil, therefore I highly recommend tick/share charts so
you can split that data and examine it with care.
Re: Re: AHG - Profitable Strategy for Struggling Traders
Quote from Cxinvest:
Wow, after studying this tonight I see exactly what you mean by 'evil longbars' heh.
~Cx
price action analysis
hi st and anek,
can you please point me to some websites or books where we can see more example
of this PA.
i looked at surinotes , some what helpful will see if i can get a copy of his
book...
also tradethemarket does lot of PA stuff like trend indicators which are price
action based and good stuff..
will check puretick to see if i can get anything..
Bill,
Save your money and invest time instead of dollars into screen time.
I'm not joking either ![]()
Anek
Just caught up on recent posts. Just wanted to say I appreciate Anek's
honesty and can understand ST's attitude. A person can get pretty jaded with all
the BS threads and egos on ET.
I have read all of Anek's and ST's posts on ET and they have really changed my
thinking and attitude and I respect both of them.
So some may disagree on things like using an indicator or two which supports
trend retracements or using different charts, exits, etc. , as long as we all
agree that PRICE ACTION is KING!!!! and we strive towards that, then we are
light years ahead of most on ET.
As one of the people alluded to by Stealth, I am a one or two post guy who
pmmed him. In my defence Ill post more when I think I can add value but
unfortunately I am not that skilled yet.
I would like to say that what Anek has shared is of value and some solid ideas
can be taken from it. But I have been a little stumped by the rapid use and
throw of indicators.
As for Stealth while he might be annoyed with people who pm him he was more than
generous in sharing his market internal detailsl. His style is harder without
indicators but i guess its less tweaking in the end once your brain gets good at
pattern recognition.
BTW stealth why changing 10k bars to 5k in your example? I guess you get more
swing highs and lows to enter. Also I am curious what are the number of bars you
use to get your pesavento labels. I am fiddling with 3.
I think its a great thread. After going through most of Stealth's public posts
it looks like he finds it tough to let go.
![]()
The one good thing about an anonymous thread is that your name isnt really
attached to your handle so ego shouldnt even exist.
cheers
SS
Taking a break from the journal, not sure how long.
Good trading.
Anek
Hey,
Got some things to take care of, won't be posting till next week. Good luck all.
Cheers ![]()
Quote from Anekdoten:
Taking a break from the journal, not sure how long.
Good trading.
Anek
__________________
If at first you don't succeed ...
Anyone else make the same dumb rookie mistake ?
Looking at a tick chart too small and focus on "trends within a trend" and lose
focus of the big picture ?
Man what a boner.
Quote from booyah:
Anyone else make the same dumb rookie mistake ?
Looking at a tick chart too small and focus on "trends within a trend" and lose focus of the big picture ?
Man what a boner.
__________________
PM
I know its been mentioned before but on a regular basis what size charts do
you guys use ?
I was using 5 minute / 15 minute charts and some tick charts but most people are
advising against it.
So Im curious on a normal day what kind of charts would you guys have open ?
250 tick / 500 tick ?
or do you guys look at the volume of contracts ?
400 volume / share bars on NQ....I used that same chart everyday.....fwiw
Cheers ![]()
constant change of charts not good,
but i plan to have a n anchor chart of 5 min and 5000 volume chart for ES.
also apply TTM indicator very helpful..
anybody else pointing me to some good website to get free info on Prica action
analysis...
Quote from Anekdoten:
Taking a break from the journal, not sure how long.
Good trading.
Anek
This is a great thread . Probably the best I've ever followed here in my many years of struggle trying to become profitable. Much valuable input from many different people . Naturally there will be disagreements , but thats not an unhealthy thing . Its good to here differing views and draw our own conclusions. Hope this thread can continue.
__________________
Lets all drink to the death of a clown.
3 bar reversal
Stealth ,
From earlier today, am I seeing this 3 bar reversal correctly? The swing low (2)
consists of 3 separate lines. Would you consider this a valid set up to go long
?
__________________
Lets all drink to the death of a clown.
enjoy and comeback
Quote from Anekdoten:
Taking a break from the journal, not sure how long.
Good trading.
Anek
Is that a symmetrical on the ES?
__________________
PM
Re: 3 bar reversal
Quote from babe714:
Stealth ,
From earlier today, am I seeing this 3 bar reversal correctly? The swing low (2) consists of 3 separate lines. Would you consider this a valid set up to go long ?
2 questions for the pros/experts here on trading the ES intraday:
1. Is it ok to trade the ES using the SPX charts? I have been studying the SPX
intraday for almost a year now and am more familiar it's pattern.
2. Does it make sense to use a 2 point risk (stop loss) for a 1 point pre-set
gain? I can manage several (3 or 4) quick 1 point moves reasonably well with a 2
point stop loss, but don't feel comfortable upping the target. I understand the
RR should be the other way round (risk 1: reward 2), just wondering if any
pros/experts feel it is ok to go with (risk 2: reward 1) if I feel comfortable
with the probability of success.
Re: Re: 3 bar reversal
Quote from Bingoking:
Stealth,
Here's your chance to shine and show your stuff.
Bing
This thread is going to be rather awkward without Anek's posts and charts.
Let's see how long this can you carry on otherwise.
How did everyone do today ?
Didn't trade today (apparently lucked out because it seems TS had quite the
nasty day). How did you do sir?
~Cx
Quote from billdobson1972:
also apply TTM indicator very helpful
Quote from booyah:
This thread is going to be rather awkward without Anek's posts and charts. Let's see how long this can you carry on otherwise.
How did everyone do today ?
__________________
PM
Nice job Pax! Man, had for me to read that chart, what is all that stuff?!
~Cx
Quote from Cxinvest:
Nice job Pax! Man, had for me to read that chart, what is all that stuff?!
~Cx
__________________
PM
Great job Pax.
I think he's asking (or atleast I am) what those 2 bands are (bollinger ?)
Pax how fast do you think the Dax moves relative to the ES ?
Quote from booyah:
Great job Pax.
I think he's asking (or atleast I am) what those 2 bands are (bollinger ?)
Pax how fast do you think the Dax moves relative to the ES ?
__________________
PM
I do not trade every hh, hl, lh ll series as I have found when price moves
back inside the daily range the odds go down, so I was basically done after the
double top played out but it was a nice morning.
Afternoon gyrations inside the range established in the morning are pretty
random, imo. There were some nice swings this afternoon but how do you play
them? If you drop down on your timeframe or volume size you can see lots of hh's
and hl's, lh's and ll's but as you reduce time/volume noise increases and you
get stopped out more often. I find it less stressful to stick to one chart and
avoid afternoons unless we are making new highs or lows.
I have read a few times that it's good practice to trade a maximum of 1 ES
per 10k in the account.
Anybody know of a similar guideline for the DAX (or YM )?
__________________
PM
thanks pax,is that 8pm german local time ? good point gary I got screwed on a few hh hl. so gary you ,re staying within the days s/r levels ?
Quote from booyah:
thanks pax,is that 8pm german local time ? good point gary I got screwed on a few hh hl. so gary you ,re staying within the days s/r levels ?
__________________
PM
ok cool. I was told the less liquidity afterhours would make it less tradeable ill definitely checkit out, pax are you still paper trading
Quote from booyah:
ok cool. I was told the less liquidity afterhours would make it less tradeable ill definitely checkit out, pax are you still paper trading
__________________
PM
I did not do well today. Missed a couple of good setups and was distracted while in a couple of others, making poor exits. Working while trading sucks. I'm thinking about going to bed when I get home from work about 5, sleeping till about 2, then trading ES in overseas hours for me, till I to go to work at 7:30. Life is short, might as well. Glad others did well today.
Quote from booyah:
Bill can you explain what this is and how to implement.
I'm using OEC (open e cry) how can i use this.
I think the more experienced guys did well today, but I got my ass kicked. I still have a lot to learn, just when I think I'm ready to use real cash, I have a day like this. I'll stick with the sims for a while.
Quote from GaryN:
Thats not the only thing screw up tho. My trendlines keep moving too. That doesnt happen on time charts. Weird.
Quote from booyah:
Bill can you explain what this is and how to implement.
I'm using OEC (open e cry) how can i use this.
I think the more experienced guys did well today, but I got my ass kicked. I still have a lot to learn, just when I think I'm ready to use real cash, I have a day like this. I'll stick with the sims for a while.
traderslaboratory.com has it.. in the indicators section. i dunno if they have the code specifically for QT tho...
Quote from Anekdoten:
Taking a break from the journal, not sure how long.
Good trading.
Anek
you can almost hear the crickets chirping in here, its so quiet.
How did you guys do today ? There were some easy trades for system followers.
Enjoy the long weekend.
Yeah hope Anek rejoins journal soon. Crickets better to be holiday than his
absence. Noone else putting up ES charts heh.
~Cx
Quote from booyah:
you can almost hear the crickets chirping in here, its so quiet.
How did you guys do today ? There were some easy trades for system followers.
Enjoy the long weekend.
fwiw I have found it helps to watch both time and volume charts. I look for entries off those swing highs and lows and sometimes it is much clearer on one chart over the other.
Quote from GaryN:
fwiw I have found it helps to watch both time and volume charts. I look for entries off those swing highs and lows and sometimes it is much clearer on one chart over the other.
Volume or sometimes called share bars are set to print a bar everytime a pre
determined volume is reached ie trading ES with 5000 volume bars a new bar will
print each time 5000 contracts have been traded.
Advantage over time ( minute ) bars is that they can often give a much clearer
indication of trading patterns that are developing in the market, pullabks that
do not clearly print on minute bars are often much clearer with volume bars.
Quote from One Eyed Shark:
Volume or sometimes called share bars are set to print a bar everytime a pre determined volume is reached ie trading ES with 5000 volume bars a new bar will print each time 5000 contracts have been traded.
Advantage over time ( minute ) bars is that they can often give a much clearer indication of trading patterns that are developing in the market, pullabks that do not clearly print on minute bars are often much clearer with volume bars.
__________________
PM
absolutely.
Volume bars negate the time element to an extent, when time and price do come
together many would consider the trade a higher probability.
Thanks guys.
I can see how volume bars my show other types of 'trends'.
Right, there is no real solution. Right now I have a bit of deception on timing,
so volume might help.
Thanks.
Looking at the 5000 and 10000 share vol charts for friday , saw some trends
but no entrys for AHG style trade. Dropped down to a 2500 vol chart and there
was a clear trade around noon.
What are you guys thoughts on watching multiple charts like this during the
trading day ?
__________________
Lets all drink to the death of a clown.
Good idea. Could also use the 2500 constant volume as another signal chart, as it looks like entries and exits could sometimes be seen more clearly on that chart. Inaddition to that charts use on days, when the 5000 constant volume chart isnt giving clear signals
Everything about trading is a compromise, imo. You have to be careful about looking for a trade. If you drop down far enough in either volume or time charts you will find pullbacks in a trend but chances are you will get stopped out far to often to be profitable.
Quote from babe714:
Looking at the 5000 and 10000 share vol charts for friday , saw some trends but no entrys for AHG style trade. Dropped down to a 2500 vol chart and there was a clear trade around noon.
What are you guys thoughts on watching multiple charts like this during the trading day ?
10000 vol ES chart for the period in question
__________________
Lets all drink to the death of a clown.
5000 vol es chart for the period in question
AHG setup shows up, kind of
At about 11:58 there is a white bar higher than the rest with a straight line
above it (are those straight lines just marking a swing high/swing points?)
exactly , I just drew them in (little green horizontal lines)
--------------------------------------------------------------------------------
How would you know not to go short there?
Now I probably wouldn't have gone short because the overall trend was long
__________________
Lets all drink to the death of a clown.
Quote from babe714:
5000 vol es chart for the period in question
AHG setup shows up, kind of
At about 11:58 there is a white bar higher than the rest with a straight line above it (are those straight lines just marking a swing high/swing points?)
exactly , I just drew them in (little green horizontal lines)
--------------------------------------------------------------------------------
How would you know not to go short there?
Now I probably wouldn't have gone short because the overall trend was long
but how do you recognize pullbacks vs trend change?
Thats the $64k question , Maybe just visually look at it and make a judgement .
To help some use fibs , T/L breaks, indicators of all sorts, 123 reversals etc.
Never know for sure , thats why we have stops . Note in the yellow box , there
was a 123 reversal that would have put you long off the 2500 vol chart.
__________________
Lets all drink to the death of a clown.
Quote from billdobson1972:
could you please help us in explaiig what those white vertical bars are..seems like u r using QT ..do u have some paintbar logic for that..would you mind sharing the code ...would like to create simmilar chart and compare...thanks
could you please help us in explaiig what those white vertical bars
are..seems like u r using QT ..do u have some paintbar logic for that..would you
mind sharing the code ...would like to create simmilar chart and
compare...thanks
Bill ,
I am using QT with IB feed and IB backfill . Different feeds and backfills will
produce slightly different charts .
the white vertical lines are obviously dojis , ( bar open price = bar close
price ) Not using any special paintbar logic to get them .
Right click on chart > chart type > vollume OHLC is all I did to get current
configuration .
You may want to try > options > edit preferences>charts> miscellaneous> candles
color ohlc bars using prev close,neither intraday or historical is checked .
__________________
Lets all drink to the death of a clown.
On the pullback vs trend change question. Just read the beginning of the
journal. Trend change needs two LL or two HH.
Unless double top or double bottom, then just one.
Quote from bmwhendrix:
On the pullback vs trend change question. Just read the beginning of the journal. Trend change needs two LL or two HH.
Unless double top or double bottom, then just one.
The way I see it, if the trend changes, I will be stopped out. No ifs, ands
or buts. If I am in a trade already, I will be stopped out of it. If I just
initiated a trade, my stop will be hit on that.
Then, I wait for confirmation in the form of another HH and HL (or vice versa),
and enter on the pullback (I use Stealth Trader's nifty 3 point reversal shown
earlier in the thread, or I use stochastics and stochastics momentum because I
am partial to Buffy's BLine - it's what I'm most familiar with, and I don't have
Anek's nifty circle graph).
Then, if I am stopped out of that, I know that we are in chop, and another type
of pattern is forming, or something is happening that I'm not familiar with...
Anyhoo, that's how I see it so far...
Quote from Anekdoten:
Kiwi,
Thanks, btw my favorite fruit
Anek
if you change the setting of the "number of posts a page" to the maximum value, then you will have only 28 pages to read.
Pax asked me about Double Bottoms via PM. It's a common question so decided
to attach a simple explanation on how I play them so others can benefit from it.
It is very important that you understand this is not a scalp this is a massive
reversal type of intraday swing offering one of the best risk vs rewards in
trading. When you play one, don't shoot for 3 ticks
![]()
Hope it helps and Happy Labor Day to those in the US.
Anek
PS: Reverse for Double Tops
EDIT: Attachment bombed, see next post
Attachment misbehaving, one more try.
ES Daily........
Anek ![]()
Anek, for a failed double top/bottom, how do you enter into reverse?
Quote from farscape105:
Anek, for a failed double top/bottom, how do you enter into reverse?
Hi,
Hope you guys had a great holiday weekend. Anek it's good to hear from you
again.
Quick question for you guys, I know the majority don't use fancy indicators but
I need to know what to use in this situation.
Lets say there's a strong trend and during the retracement I'd like to enter.
and I want to see the volume being low during the retracement to know the trend
will likely continue. Ok so what volume indicator should I use. I'm using OEC
(open e cry) so my choices are:
Volume Oscillator
Price Volume Trend
Regular Volume Bars.
Do you guys prefer any type. I dont want to use too many indicators. I tried RSI
but it contradicted what the Price Action/Trend was saying too many times. so I
didnt want to confuse myself anymore.
So I'd like to know what is the volume indicator you guys look at to get a
better idea if the retracement is going to lead to a trend continuation or
reversal. and if you can configure it, what parameters do you guys set for
Volume bars ?
Thanks Everyone !
Here is a new question I saw posted not long ago.
How can you tell the difference from a retracement and a possible reversal ?
Well, in theory it's a "bet", which is why it's hard for some people to trade
this way, they see price going down, even if the support is not taken and they
shit their pants, or worse they want to short a support that has yet to be
broken.
Anyway, one way to tell that helps is that retracements usually happen on lower
volume where reversals usually start on increasing volume. If you using volume
bars you will see them print very rapidly in comparison to when price action was
calm.
Hope it helps.
Anek
Booyah,
Trendlines, the more the better.
Support/Resistant Pivots
Time and sales
Custom Price Action (learn to code Easy Language), sometimes you just gotta make
this stuff yourself.
Everything else will place you at a disadvantage due to lag.
Do not give up on price action, highs and lows is all you really need.
Anek
Quote from booyah:
Hi,
Hope you guys had a great holiday weekend. Anek it's good to hear from you again.
Quick question for you guys, I know the majority don't use fancy indicators but I need to know what to use in this situation.
Lets say there's a strong trend and during the retracement I'd like to enter. and I want to see the volume being low during the retracement to know the trend will likely continue. Ok so what volume indicator should I use. I'm using OEC (open e cry) so my choices are:
Volume Oscillator
Price Volume Trend
Regular Volume Bars.
Do you guys prefer any type. I dont want to use too many indicators. I tried RSI but it contradicted what the Price Action/Trend was saying too many times. so I didnt want to confuse myself anymore.
So I'd like to know what is the volume indicator you guys look at to get a better idea if the retracement is going to lead to a trend continuation or reversal. and if you can configure it, what parameters do you guys set for Volume bars ?
Thanks Everyone !
I hope my question doesnt seem repititive I know you guys spoke about it this
week. I know volume is the key to helping clarify what the retracement will lead
to but,
Is there any particular type of volume indicator you guys look at or just the
bars ?
also can you configure it in any particular way ?
if you guys are using volume oscillators please advise what your experience has
been with them.
Thanks Guys !
Im really curious to know what type of volume bar,oscillator, indicators you
money making pimps are utilizing.
Have a great trading week fellas !
Booyah,
I use the "printing speed" of the volume bars, also time and sales to see how
hard those cars are being sold/bought and last but not least consider a small
3-5 min chart, in a small corner, with a regular volume indicator. Nothing too
distracting but visible enough for confirmation. Study it before depending on
it, some cannot make sense out of volume and will claim it is useless when in
reality it's the trader him/herself. I don't depend much on it but on KEY areas
it can be very revealing.
Anek
Quote from booyah:
I hope my question doesnt seem repititive I know you guys spoke about it this week. I know volume is the key to helping clarify what the retracement will lead to but,
Is there any particular type of volume indicator you guys look at or just the bars ?
also can you configure it in any particular way ?
if you guys are using volume oscillators please advise what your experience has been with them.
Thanks Guys !
Im really curious to know what type of volume bar,oscillator, indicators you money making pimps are utilizing.
Have a great trading week fellas !
Thanks Anek. I'll keep an eye on it.
Here's a dumb question is Time and Sales the info you referring to thats on a
DOM (depth of market). Please excuse my newbiness.
I dont think the broker im using (Open E cry) has time and sales option.
Thanks.
Quote from booyah:
Thanks Anek. I'll keep an eye on it.
Here's a dumb question is Time and Sales the info you referring to thats on a DOM (depth of market). Please excuse my newbiness.
I dont think the broker im using (Open E cry) has time and sales option.
Thanks.
Sweet charts Anek. This question might be semi-repetition, but typically you
are always talking about double bottoms (either that or I missed your posts on
double tops). Was just wondering if you play the DT's the same way you play the
DB's like you explained on the new charts? Probably, but can never be to sure...
~Cx
P.S. Keep posting charts heh.
Quote from Anekdoten:
PS: Reverse for Double Tops
Tuesday was an optimal AHG day, no doubt about it.
Unfortunately I could not trade it due to family matters but if you been reading
this journal and you did not absolutely milk it, I don't know what else there is
to say to help your trading.
The solid uptrend ended on a beautiful calm trendline break which was held by
50-61.8% retracement, the infamous ambush play.
I sincerely hope someone here went against the trend today or called a top
before the TL broke, because there could not be a better slap in the face to
help you wake up.
Anek
Question for readers, more like food for thought.
50% retracement vs TL break
![]()
Anek
Yeah. Still trying to distinguish between some of these chart variations.
Time charts were actually smoother today take the couple long bars. Anek, can
you draw up one of your charts on how you would have played today? Just curious
to see if it similar to what I traded. Looks like a few of the smaller time
charts would have kept me in where I might have been out on my volume charts
(running 5000ES btw). How'd everyone else do today??
~Cx
well, I for one did not absolutely milk it..
![]()
I did however recognize the trend as UP, but that wasn't 100% clear to me until
the 1478 high was taken out by a HH at around 9:45 am. From that point on, the
problem I am still having is finding entry points. I guess I should just close
my eyes, widen my stops and buy, but that is the area I am having the most
trouble with.
As for volume information, I like to glance at a 5 minute chart with volume
bars. This is today's price action with volume, and I think the volume bars tell
a lot.
Quote from Anekdoten:
Question for readers, more like food for thought.
50% retracement vs TL break
Anek
It was quite a trend day!
Balance was positive, just a little more than the loss I had yesterday ...
![]()
I should learn to adapt the stop to the volatility of the day, though. I had
problems yesterday (too large stop) and today (too small).
Have a nice evening over there!
PM.
One of the things I am still trying to "fine-line" is the bar-bar vs.
wave-wave. If you traded ES today and stuck with the waves should have done very
well. Likewise with each bar, but if I had traded just per that I would not have
done as well as looking at the bigger pivot/wave picture. Maybe it just depends
on one's style... maybe looking more for a scalp per bar and more of an
intra-day swing in waves. Kind of confusing, but surely refined through
experience. Any thoughts?
~Cx
Cx,
Ok here you go.
Several things that were VERY apparent.
- Very strong uptrend
- Several resistant levels in the big picture were taken out.
*We had bars closing above 1484-85
*We had bars closing above 1490
- There were plenty of double bottoms to take.
- Choppy action at some points but nothing remotely close to reversals. Lower
highs is not bearish, lower highs and lower lows is. Most entries, if not all,
did not have a subsequent lower low until the trend reversed, most I saw were
double bottoms, support holding very well. This is imperative for running the
winners, now and in future trending days.
- Significant TL break at the end with a pretty aggressive sell off. Just
like Friday afternoon, nasty stuff.
Anek
Quote from Anekdoten:
Cx,
Ok here you go.
Several things that were VERY apparent.
- Very strong uptrend
- Several resistant levels in the big picture were taken out.
*We had bars closing above 1484-85
*We had bars closing above 1490
- There were plenty of double bottoms to take.
- Choppy action at some points but nothing remotely close to reversals. Lower highs is not bearish, lower highs and lower lows is. Most entries, if not all, did not have a subsequent lower low until the trend reversed, most I saw were double bottoms, support holding very well. This is imperative for running the winners, now and in future trending days.
- Significant TL break at the end with a pretty aggressive sell off. Just like Friday afternoon, nasty stuff.
Anek
Hi, Anek,
Thanks for the plots. I got few questions marked in red.
Freewilly
Jack,
You are welcome.
Freewilly,
Good questions.
If you look back at how I enter double bottoms, I enter when the middle swing is
taken out by a close above the high bar.
However, these double bottoms are not at the LOD so it's up to the trader to get
a crazy good entry at the support level and risk a few ticks or wait for
confirmation of the breakout.
On a Double B that appears a the LOD I would definitely wait for confirmation as
the trend is very strong, if it's at the LOD, you definitely want the HH/HL as
confirmation.
In todays' case, I would have definitely risked some ticks for a massive risk vs
reward play, which is btw, the right mindset.
As far as jumping long into a strong trend with fears of buying the top, that's
definitely more logical than shorting it. Nevertheless I see where you are
coming from and I will show you a small trick, just don't tell anyone
![]()
Anek
Quote from Anekdoten:
Cx,
Ok here you go.
Several things that were VERY apparent.
- Very strong uptrend
- Several resistant levels in the big picture were taken out.
*We had bars closing above 1484-85
*We had bars closing above 1490
- There were plenty of double bottoms to take.
- Choppy action at some points but nothing remotely close to reversals. Lower highs is not bearish, lower highs and lower lows is. Most entries, if not all, did not have a subsequent lower low until the trend reversed, most I saw were double bottoms, support holding very well. This is imperative for running the winners, now and in future trending days.
- Significant TL break at the end with a pretty aggressive sell off. Just like Friday afternoon, nasty stuff.
Anek
Quote from Cxinvest:
P.S. Will you short on those initial trend line breaks or do you typically shy away from the first burst through and catch the first pullback out??
Hi, Anek,
Thanks for taking tiem to answer my questions.
1. What is LOD?
2. I don't see your entries. Usually you have green and red vertical bars that
show your entries.
3. 2 dbl bottoms on your chart can also be looked as dbl tops. How do you handle
that? For me, those areas only mean consolidation. They could break out either
way, but once they breaks out, it signifies a trend(either down or up). Am I
right?
4. Thank you very much for the tip. You use small time frame consolidation areas
as pull backs, that makes sense. I can't get those fine resolution charts. (I
don't eevn know what ES you guys are trading is)
freewilly
Quote from freewilly:
Hi, Anek,
Thanks for taking tiem to answer my questions.
1. What is LOD?
2. I don't see your entries. Usually you have green and red vertical bars that show your entries.
3. 2 dbl bottoms on your chart can also be looked as dbl tops. How do you handle that? For me, those areas only mean consolidation. They could break out either way, but once they breaks out, it signifies a trend(either down or up). Am I right?
4. Thank you very much for the tip. You use small time frame consolidation areas as pull backs, that makes sense. I can't get those fine resolution charts. (I don't eevn know what ES you guys are trading is)
freewilly
Hi, Anek,
As for the pure gold. Do you mean by your experience rectangle usually means
trend continuing other than reversal.
I am not really trading anything, but some paper trading. I study hundreds stock
intraday charts everyday, trying to get a feel of market. It looks to me,
rectangle only means consolidation. It can go either way, but once breaks out,
it is a trend. Am I right? Do you set you entry in the rectangle or out of
it(after break out)?
If I had traded the chart you provided, that's how I probably would have done
it. Please comment if you have time.
Thanks,
freewilly
Quote from freewilly:
Hi, Anek,
As for the pure gold. Do you mean by your experience rectangle usually means trend continuing other than reversal.
I am not really trading anything, but some paper trading. I study hundreds stock intraday charts everyday, trying to get a feel of market. It looks to me, rectangle only means consolidation. It can go either way, but once breaks out, it is a trend. Am I right? Do you set you entry in the rectangle or out of it(after break out)?
If I had traded the chart you provided, that's how I probably would have done it. Please comments if you have time.
Thanks,
freewilly
Hi, I only read the first 100 pages of this thread, so you'll have to excuse me if I made mistakes, but I found it difficult finding good entries this morning on ES, which should be a crying shame on a day like today. I circled in yellow a few possible entries, but my charts don't look the best on QT in my opinion. 5000CV still seems to give noise and my charts arent as sexy as Anek's.. Curious what a few of you think of these charts. I know the DB and trendline trades as Anek was kind enough to show on that other chart, but I am trying to find good entries (pullbacks) on this chart with the original idea of getting a pullback in a trend. I believe CX may have a similar problem, today's trend was just too damn trendy. Any input would be appreciated. Sorry to bring the level of general understanding back to a lower level...
Quote from Anekdoten:
Still, you are failing to see why I would have taken the Double Bs at support and not the Double Ts. Keep looking and read my explanations.
S,
When the trend is VERY strong as it was today, considering using a smaller chart
on top of what you have.
Here is a suggestion, 5000 for trend direction, 2500 for entries.
This was suggested in the journal already but considering how monstrous this
thread has become it might be time to consolidate everything into an AHG FAQ or
something.
Any volunteers?
Hope it helps.
Anek
Quote from freewilly:
I went back to look up your answers. Maybe I am missing something. When you say support, do you mean the trend line you drew that connects the lows?
When you say LOD, do you mean the lower trend line that connects the lows? Not really absolute the low of the day?
Hi, Anek,
Thanks for the explanation. I guess we are on the same page. (I probably didn't
express myself well). Sorry for being so buggy. Just want to confirm that, so i
know I got your method right.
When I say it could be dbl B or dbl, it all depends on where you look at it,
purley depends on how the price action develops afterwards.
Here is the chart how I make my judgement along the price action develops. Can
you see price action before I do?
Yes, i feel better now. I think I got your idea.
Let's free willy, literally ![]()
One thing to notice is that on the first double bottom the second support area
had dual confirmation, hl support + trendline.
Anek
Thanks, makes perfect sense to me!
Good night.
freewilly
Great thread Anekdoten. Very informative and has helped me in my trading.
Good trading,
Dvst8
__________________
Edge: new trader mentality
Quote from dvst8:
Great thread Anekdoten. Very informative and has helped me in my trading.
Good trading,
Dvst8
Hi ![]()
Back from vacation today, got in at 3pm, made one trade +$45 net on the day on
NQ. No equity trades.
Ready for tomorrow and Sept ! ![]()
Cheers ![]()
Welcome back Razor! ![]()
~Cx
Cheers ![]()
Quote from Cxinvest:
Welcome back Razor!
~Cx
Made this for a friend that struggled today. It illustrates how DBs and DTs
were supposed to be played today to kick the market's ass.
Hope it helps.
Anek
Looking for a volunteer to create an AHG FAQ
Only requirements I ask for are:
1) You must have a solid understanding of the journal and have read it multiple
times from beginning to end or are willing to do so before starting the FAQ.
2) That your writing skills are decent. Not looking for the next Edgar Allan
Poe, just an educated person ![]()
3) Finish it in approximately one week.
This should minimize a great deal the numerous repetitive questions we've been
getting.
When finished we can make it a PDF and attach it to the journal with perhaps
some basic illustrations.
Send me a PM if you are interested, first to do so, gets the job.
Thank you.
Anek
Hope you guys did well today.
Thanks. CX as far as I know Open E cry doesnt have Time and Sales.
Anek thanks for the chart, I think I'm not seeing the same thing as you guys are
because of my chart sizes/configurations.
I noticed this chart is 5000 volume and you recommend 2500 volume chart for
entries, earlier I used to see your charts had 233 tick and 500 ticks or 610.
and some I think had 89 tick for smaller ranges.
Did you change for any particular reason or do you go between both chart types.
Quote from booyah:
Hope you guys did well today.
Thanks. CX as far as I know Open E cry doesnt have Time and Sales.
Anek thanks for the chart, I think I'm not seeing the same thing as you guys are because of my chart sizes/configurations.
I noticed this chart is 5000 volume and you recommend 2500 volume chart for entries, earlier I used to see your charts had 233 tick and 500 ticks or 610. and some I think had 89 tick for smaller ranges.
Did you change for any particular reason or do you go between both chart types.
Well, here is how I read the ES today. There were a few other plays but as
you can see the chart was getting pretty congested with my analysis hehe.
Anyway, looking for commentary and hope it helps others out. Let me know what
you guys think.
~Cx
ok cool.
im no where near ready to do scalping, (i'd end up being the one getting
scalped)
I'll stick with the bigger frames.
I read your review of suri notes. Do you think thats appropriate for someone
starting out ? or for people with a little more experience. I found it odd that
no one had anything negative to say, is it really that good ?
Thanks, dude.
Quote from Cxinvest:
Well, here is how I read the ES today. There were a few other plays but as you can see the chart was getting pretty congested with my analysis hehe. Anyway, looking for commentary and hope it helps others out. Let me know what you guys think.
~Cx
Quote from booyah:
ok cool.
im no where near ready to do scalping, (i'd end up being the one getting scalped)
I'll stick with the bigger frames.
I read your review of suri notes. Do you think thats appropriate for someone starting out ? or for people with a little more experience. I found it odd that no one had anything negative to say, is it really that good ?
Thanks, dude.
Quote from Anekdoten:
CX,
Except the long entries on the TL break/test everything looks great and I must congratulate you on the analysis.
I will let you decide on your own why I do not approve of the TL break/test longs. Especially the second one.
Anek
Quote from Cxinvest:
Were you just referring to the two that I have placed near the symm triangle at around 12:00??
~Cx
Whoops. Fixed a typo but it won't let me re-attach on my old post so going to
throw my chart up again.
Anek, not quite sure what is wrong with them. Perhaps a short signal at the
break down of that symmetrical for a BE or small loss even though it failed? Not
sure what is wrong with the second one. Bulls broke a bigger downtrend line for
the day and closed above it. Perhaps you are not ok with the Risk - Reward on
the trade? Or because the last bar before the break did not make a new HH?
Stumped so far on this one. Anyone else? Haha.
![]()
![]()
~Cx
If you waited for a close above the the TL that's great but I still have a
problem with the other three points.
Open for discussion, perhaps you saw something I'm failing to see.
Anek
Quote from Anekdoten:
If you waited for a close above the the TL that's great but I still have a problem with the other three points.
Open for discussion, perhaps you saw something I'm failing to see.
Anek
Quote from Cxinvest:
Whoops. Fixed a typo but it won't let me re-attach on my old post so going to throw my chart up again.
Anek, not quite sure what is wrong with them. Perhaps a short signal at the break down of that symmetrical for a BE or small loss even though it failed? Not sure what is wrong with the second one. Bulls broke a bigger downtrend line for the day and closed above it. Perhaps you are not ok with the Risk - Reward on the trade? Or because the last bar before the break did not make a new HH? Stumped so far on this one. Anyone else? Haha.
~Cx
Well that's not good news. Anek or anyone else using TS know of this problem
or how to fix it??
And I think I see what you mean now after finally taking a second to look at the
chart you put up today. Maybe that fading trend line wasn't ok for the points i
connected it. Perhaps had the trend continued downward from where price touched
my trendline last that line would have made more sense.
~Cx
There is no way to fix it. I went through weeks of talking with them and their response was its just the way it is. That is why I left them. Just something to keep in mind.
Quote from Trader273:
There is no way to fix it. I went through weeks of talking with them and their response was its just the way it is. That is why I left them. Just something to keep in mind.
Multicharts. You can use all your EL scripts so it saves the time of trying to convert them. You can also choose from a number of data providers so you are not tied to TS.
It's true but it does not seem to affect my trading.
Anek
Quote from Trader273:
Multicharts. You can use all your EL scripts so it saves the time of trying to convert them. You can also choose from a number of data providers so you are not tied to TS.
Interesting. Do you trade the ES using Multicharts Trader273? Would be
curious to compare the 5000V chart from TS to a 5000V chart from MS. If that is
the case, it would be cool if you could post an intra-day 5000V chart of the ES
today if that is not a big task for you. Either way, thanks for the heads up!!
![]()
![]()
~Cx
I use MC to trade ES, CL, and 6E. I don't use any automated strategies which
I guess some people don't think MC is so great for. But for the trader looking
for just for charts MC is great.
Here is a pic of what i got for a 5000v chart. I put a volume histogram to show
that every candle is capped at 5000. If you compare that to TS you will see that
you get spikes where the candle should have stopped but didnt.
Nobody seemed to mention this double top and trend break today?
Quote from bmwhendrix:
Nobody seemed to mention this double top and trend break today?
273,
Thank you for the sample, looks very clean.
Actually difference is like night and day.
Anek
Hi, just wanted to say that in my opinion, AHG Higher Highs and Higher Lows
are not as sensitive to the size of the bar to me, as long as the length of the
bars are approximate...
What's a few contracts here or there?
![]()
But I'm also using Ensign, so I don't really have a good perspective...
Quote from bmwhendrix:
Nobody seemed to mention this double top and trend break today?
Tradestation inability to do this correct on the chart.
Anek
Quote from Anekdoten:
That is funny, go buy it before I kick your ass
Anek
Quote from xiaodre:
What's a few contracts here or there?
Here is a nifty indicator that plots the following:
- Higher Highs
- Higher Lows
- Lower Highs
- Lower Lows
- Double Bottoms
- Double Tops
- Porn
Anek
PS: Kidding about porn, that would be a perfect ELD !
![]()
Screenshot of previously attached ELD.
Anek
Quote from Anekdoten:
2) You were buying a falling knife, in fact your second entry was actually a short AHG entry, it did not work
but that's due to an unfortunate reversal, but rules are rules.
Anek [/B]
Quote from Jaxon:
Glad to see you mention that.
That is exactly where I shorted it! Market briefly looked like it was going to head lower, then continued up, I got stopped out for -1 point.
KiWiRoo I use IB for data. If your source charts differently, and you are trying to check your trades and charts against Anek's, you may just want to vary your volume untill you get a reasonable match. It's all relative.
Anek,
Just found your great thread last night. Glad you like the price action ELD. It
was inspired by a pure price action trader that's been changing my paradigm
about trading. I haven't had time to read all the posts (probably won't) so
would love to see the cliff notes version.
I see when you trade a double top, you wait until price penetrates the low
between the peaks before entering, is that correct? How do you handle exit?
Thanks in advance,
Marsh....
Forgot to mention regarding the price action ELD. Due to the TS way of doing things, the HL, etc. markers get attached to the first bar in the minute in which the HL occures. So, on lower tic charts, the markets are charted way off the actual bar which creates the marker. Sometimes increasing the left and right strength (10-25) helps to align the marks better.
Quote from ksungela:
Anek,
Just found your great thread last night. Glad you like the price action ELD. It was inspired by a pure price action trader that's been changing my paradigm about trading. I haven't had time to read all the posts (probably won't) so would love to see the cliff notes version.
I see when you trade a double top, you wait until price penetrates the low between the peaks before entering, is that correct? How do you handle exit?
Thanks in advance,
Marsh....
Quote from ksungela:
Forgot to mention regarding the price action ELD. Due to the TS way of doing things, the HL, etc. markers get attached to the first bar in the minute in which the HL occures. So, on lower tic charts, the markets are charted way off the actual bar which creates the marker. Sometimes increasing the left and right strength (10-25) helps to align the marks better.
Quote from bmwhendrix:
KiWiRoo I use IB for data. If your source charts differently, and you are trying to check your trades and charts against Anek's, you may just want to vary your volume untill you get a reasonable match. It's all relative.
How do you set your entry and stop for this chart?
Thanks,
freewilly
Is there another double T? do you utilize that or just let it go?
Thanks,
Freewilly
Quote from Trader273:
I use MC to trade ES, CL, and 6E. I don't use any automated strategies which I guess some people don't think MC is so great for. But for the trader looking for just for charts MC is great.
Here is a pic of what i got for a 5000v chart. I put a volume histogram to show that every candle is capped at 5000. If you compare that to TS you will see that you get spikes where the candle should have stopped but didnt.
Free,
Your first arrow is a great play with a mini stop, even better if the trend was
up ![]()
Your third arrow is a great play and yes you miss some of the run but that is
the price you are paying for CONFIRMATION.
Your second arrow, that's gambling.
As far your other top found, i did not even pay attention to it, looked like
noise to me.
Anek
Thanks, Anek,
Where would you get in? The first arrow or the third arrow? That's what I'd like
to know.
I'd like to get in at the first arrow with a tight stop. If it goes the way I 'd
hoped, it is likely to be a big winner. If it fails, get out soon, it will be a
small loser. and may kick in a short position.
Free,
I did both, the confirmation was my second average up. (Note: Doing first
against the trend is not AHG so got to be careful here not to confuse the
readers)
If the trend had been up, the first arrow on a very aggressive size, if I'm with
the trend, the smaller the stop the bigger the size, for me anyways. In
contrast, the bigger the stop, the smaller the size.
Anek
"If the trend had been up, the first arrow on a very aggressive size, if I'm
with the trend, the smaller the stop the bigger the size, for me anyways. In
contrast, the bigger the stop, the smaller the size."
Bingo! That's exactly what I am doing now.
This method will keep the loss at a constant amount. For any entry, I'd like to
calculate how much loss I'd like to take first. That's why I like first arrow,
because I can set the stop better. The stop will be few points below the
previous low. If the price goes below that, that means the double B failed. Get
out immediately, and keep the loss in the control. After that, either looking
for a short position or waiting for another opportunity.
By doing that, I can bet on larger size9because the stop is tight), and with
potential huge ride(maybe a full ride). The gain will be much bigger than the
loss.
Freewilly
Haha. Well Trader273, let's just say after comparing the two I don't know
what to think. What a mess of wicks I have on my chart compared to yours from
today. The entrys still seem relative, but that is just a comparison of today's
action (afraid I might cry if I backstudied alot more between the two). Oh well,
we'll see what happens and whether or a swap is needed soon enough.
Since I am new to anything but time frame charts... what about tick charts? Or
is that data all relative with volume too? Tick charts have the credibility and
consistency to trade price like the volume charts do in the intraday index
futures charts?
Any and all input appreciated on the above.
~Cx
Anek,
(and others)
What are your thoughts on daily trading goals using this type of method? Before,
I'd have predetermined amounts I would be prepared to make or lose for the day.
Points-wise I mean. So if I was up x amount of points, I'd close down for the
day, or if I was down x amount of points I'd close down for the day.
That was using technical analysis/indicators systems though. Do you have any
daily goals you set, or do you just take every set-up that comes your way since
this is based on price action? Just curious...
Quote from jack411:
Anek,
(and others)
What are your thoughts on daily trading goals using this type of method? Before, I'd have predetermined amounts I would be prepared to make or lose for the day. Points-wise I mean. So if I was up x amount of points, I'd close down for the day, or if I was down x amount of points I'd close down for the day.
That was using technical analysis/indicators systems though. Do you have any daily goals you set, or do you just take every set-up that comes your way since this is based on price action? Just curious...
Once you hit your daily target trade smaller size so there is less chance you
will give it back.
That's what most good traders I know do.
Quote from version77:
Once you hit your daily target trade smaller size so there is less chance you will give it back.
That's what most good traders I know do.
Hey Anek I have a few questions.
1) You say you 'reverse' DTs & DBs if they fail. At what point do you consider
the failure to be intact?
2) When looking to enter on pullback of a solid trend up or down, do you look to
be in on something more along the lines of a Ross Hook rather than needing 2+
bars of HH/HL ??
*For clarification, entering on a Ross Hook out of a pullback would mean taking
an entry once a new 1 bar high is made following the first 1 bar failure to
create a new high/low in a trend with HHs/HLs or LH/LLs .*
^Sorry if that is confusing, might have to read a few times, otherwise I can put
up a chart later visually describing my Q.
Thanks.
~Cx
Hi you all, just wanted to chime in on how I determine the swings in Ensign
Windows. I'll post a screenshot of the study when I get home:
By the way, Stealth Trader already posted about this I think. I remember he
posted something...
Study - Pesavamento Patterns, turn off all the confusing lines, set the minimum
number of bars to 0, set the minimum number of points to 2 (or 2.5 or 3, the
lower the number, the more swings. I scalp primarily so I am comfortable seeing
more swings plotted), set the labels to LBL.
Because I'm stupid, I also need this:
Study - Auto Trends, keep the lines if you want, turn them off if you only want
the swing points, minimum number of bars to 0, minimum number of points to 2 (or
2.5 or 3). Set the labels to whatever you want (LBL if you want HH and HL
printed).
It seems to be working out pretty well for me, but it doesn't do the nifty DB
and DT - that's pretty cool...
As always, I could be doing things like a monkey with 4 asses, and if anyone has
a better way of doing it, I'm all ears. I'm here to learn too of course...
Hi,
Net Gain +$156 on 5 trades, 1 lot each NQ. Not a bad day trading the NQ.
Made some AAPL and GOOG trades that were not so hot but finished positive on the
day NQ + equity trades.
Cheers ![]()
Quote from Razor:
Hi,
Net Gain +$156 on 5 trades, 1 lot each NQ. Not a bad day trading the NQ.
Made some AAPL and GOOG trades that were not so hot but finished positive on the day NQ + equity trades.
Cheers
Cheers ![]()
Quote from Cxinvest:
Nice.
~Cx
Well folks, today was not too good, got stopped a couple of times, small gains on a couple of others. Inside day. Overall negative. Considation leads to expansion, maybe tomorrow will work better for me.
Quote from bmwhendrix:
Well folks, today was not too good, got stopped a couple of times, small gains on a couple of others. Inside day. Overall negative. Considation leads to expansion, maybe tomorrow will work better for me.
Anyone trade anything else then the ES. Today the euro and crude oil had some good moves. Also, might want to take a look at bonds. Probably best to stay with markets that don't move together. That way when one market (like the ES today) is choppy perhaps another market will be a nicer trading environment.
Quote from Cxinvest:
what about tick charts? Or is that data all relative with volume too? Tick charts have the credibility and consistency to trade price like the volume charts do in the intraday index futures charts?
~Cx
Not counting AH plays, those are just bonus plays, I ended up the regular
trading day in the red.
Did well in the morning but the choppy action and indecision of the afternoon
fooled me several times.
This is the first time I end up in the red since I began the journal.
It had to happen sooner or later, I was simply not compatible with today's
action but I was waiting for such day to post it.
Market today kicked my butt, tomorrow is another day.
Hats off to those on the other sides of my trades, job well done
![]()
Anek
A. I tried this as a double top short. Was it a trade you would have taken? It just did not work our unfortunately.
Quote from bmwhendrix:
A. I tried this as a double top short. Was it a trade you would have taken? It just did not work our unfortunately.
Quote from bmwhendrix:
A. I tried this as a double top short. Was it a trade you would have taken? It just did not work our unfortunately.
Quote from Anekdoten:
Not counting AH plays, those are just bonus plays, I ended up the regular trading day in the red.
Did well in the morning but the choppy action and indecision of the afternoon fooled me several times.
This is the first time I end up in the red since I began the journal.
It had to happen sooner or later, I was simply not compatible with today's action but I was waiting for such day to post it.
Market today kicked my butt, tomorrow is another day.
Hats off to those on the other sides of my trades, job well done
Anek
Quote from Trader273:
Anyone trade anything else then the ES. Today the euro and crude oil had some good moves. Also, might want to take a look at bonds. Probably best to stay with markets that don't move together. That way when one market (like the ES today) is choppy perhaps another market will be a nicer trading environment.
Quote from Trader273:
Never have used tick charts so I can't really comment on them. But, nonetheless, i attached a 233 tick chart for today for you to compare.
A. Breakdown bar had a low below the previous swing low but closed above it.
So I guess I jumped the gun. You would generally wait for the trend break bar to
close, and enter only if it closed below that swing low?
Say in the case of a trend line break that took a couple of lower bars to break
the previous low. Would you consider it valid at that point, or require the new
low to be coincident or prior to the trend line break?
Quote from Anekdoten:
Not counting AH plays, those are just bonus plays, I ended up the regular trading day in the red.
Did well in the morning but the choppy action and indecision of the afternoon fooled me several times.
This is the first time I end up in the red since I began the journal.
It had to happen sooner or later, I was simply not compatible with today's action but I was waiting for such day to post it.
Market today kicked my butt, tomorrow is another day.
Hats off to those on the other sides of my trades, job well done
Anek
__________________
PM
In the future, I'm going to calculate (moneywise) the 'brass balls factor'.
How much if I had them?
![]()
__________________
PM
Wish I had held that first short of today ...
__________________
PM
Beautiful beautiful day.
After market closes I'm off to the pub.
Anek
Anek ,
if you get a chance could you post some charts on todays action
want to compare with how i saw it . Thanks for everything .
__________________
Lets all drink to the death of a clown.
friday afternoon
friday afternoon
__________________
Lets all drink to the death of a clown.
Hi,
Net Gain $216 on two NQ trades, 1 car each.
Did a couple of SPY trades and GOOG trades as well and basically went breakeven
overall on these trades.
Nice day ![]()
Cheers ![]()
Babe,
I think I understand them, but can you explain how your 3 bar reversal should
look like?
Thanks,
-tech
Quote from Techdoodle:
Babe,
I think I understand them, but can you explain how your 3 bar reversal should look like?
Thanks,
-tech
__________________
Lets all drink to the death of a clown.
Thanks Babe.
Got it.
I have not heard from a single person that wants to volunteer for the AHG
FAQ.
Perhaps with this second attempt I get lucky.
Anek
I will get to all the pending questions in the weekend.
Wife and kids with inlaws, time to get wasted.
Anek
Quote from babe714:
Anek ,
if you get a chance could you post some charts on todays action
want to compare with how i saw it . Thanks for everything .
Well, the cry for help worked. Got some volunteers for the AHG FAQ, I gave
the "honors" to the first person who messaged me.
This is great news, we should have some form of system consolidation in the near
future.
Thanks for helping guys.
Anek
Quote from Anekdoten:
Well, the cry for help worked. Got some volunteers for the AHG FAQ, I gave the "honors" to the first person who messaged me.
This is great news, we should have some form of system consolidation in the near future.
Thanks for helping guys.
Anek
Quote from Razor:
Hi,
Net Gain $216 on two NQ trades, 1 car each.
Did a couple of SPY trades and GOOG trades as well and basically went breakeven overall on these trades.
Nice day
Cheers
Quote from Razor:
Hi,
Net Gain $216 on two NQ trades, 1 car each.
Did a couple of SPY trades and GOOG trades as well and basically went breakeven overall on these trades.
Nice day
Cheers
Quote from jack411:
Ok Babe, Anek, others,
Also, was there a reason not to take the 11:30 1-2-3 reversal and go long? It looked like a good one also. Just wondering.
__________________
Lets all drink to the death of a clown.
Current update, been studying NQ in great detail.
Never paid much attention to it but lately I've been noticing it's quite
trending nature and explosive breakouts. Even took some trades today and loved
the action.
The only problem is the bang for the buck in comparison to ES as far as
commission.
Anek
Quote from babe714:
Anek ,
if you get a chance could you post some charts on todays action
want to compare with how i saw it . Thanks for everything .
Pax,
Learn to spot congestion which leads to chop.
The plays look good but need to work on the letting those runners run.
It's not just trading with a well formed trend you must learn to play momentum.
Study how bars act when price breakouts or breakdowns, it has distinct behavior,
it respects past bars highs/lows, micro analyze this.
Trading with a well formed trend will help your accuracy but it also allows you
to catch some good runners, if you don't ride the runners you are missing out on
half of the advantage of this system.
Anek
Pax,
Maybe this helps with letting those winners run.
Little sample.
Anek
Pax,
That's part of my winning formula, I just got easier to spot visuals but at the
end of the day price action however sliced or represented, is where the gold is.
Anek
Well, after 8 Stouts I'm off to bed.
Don't forget your best skill in trading, discipline.
This is so important it's worth mentioning a thousand times.
Without it, not even the best stuff works.
Anek
Almost forgot.
I'm looking for a slightly more "intelligent" automatic trendline indicator to
replace the one that comes with TS.
If anyone has a better alternative, free or commercial, please let me know.
Thank you
Anek
Quote from Anekdoten:
Almost forgot.
I'm looking for a slightly more "intelligent" automatic trendline indicator to replace the one that comes with TS.
If anyone has a better alternative, free or commercial, please let me know.
Thank you
Anek
A. Is this first sell from Friday's chart one you would have taken
even though it was not off two lh and two ll?
Quote from Anekdoten:
Pax,
That's part of my winning formula, I just got easier to spot visuals but at the end of the day price action however sliced or represented, is where the gold is.
Anek
Great Thread!
Anek,
I stumbled upon your thread a few days ago and it is truly one of the best I
have read, Thank you for your efforts.
I have read through the entire thread and I believe I have a basic understanding
of your methods. I plan to read through it again to get a better understanding.
In the mean time I was wondering if you could answer a question. I have posted a
borrowed chart from babe (hope you don't mind babe).
I have indicated 3 buys that would have failed, but seemed to meet the basic
criteria of an entry.
Am I seeing something wrong? Would you please comment?
Thanks again.
Do you think every setup that meets the criteria is going to work? I wish.
Quote from GaryN:
Do you think every setup that meets the criteria is going to work? I wish.
Quote from Cxinvest:
On a side note I have 8 Stouts topped by a good distance so it is time to call it a night :-). Hope you guys had a good trading week & enjoy the weekend.
~Cx
Quote from bmwhendrix:
A. Is this first sell from Friday's chart one you would have taken
even though it was not off two lh and two ll?
Quote from Jaxon:
Thanks for the peak at your homebrew.
So, do the dots represent bar close > prev bar high? I was looking at some of TRO's indicators on kreslick.com and (if I am translating the Greek correctly, because it's all Greek to me!) I believe he has one template that lets you plot whatever you want as dots below the chart.
Re: Great Thread!
Ed,
Thanks, glad you enjoy it.
I need to know exactly which chart so I can answer your question correctly.
Point me to it and I'll reply with what I see.
Anek
Quote from edpolton:
Anek,
I stumbled upon your thread a few days ago and it is truly one of the best I have read, Thank you for your efforts.
I have read through the entire thread and I believe I have a basic understanding of your methods. I plan to read through it again to get a better understanding.
In the mean time I was wondering if you could answer a question. I have posted a borrowed chart from babe (hope you don't mind babe).
I have indicated 3 buys that would have failed, but seemed to meet the basic criteria of an entry.
Am I seeing something wrong? Would you please comment?
Thanks again.
Quote from Anekdoten:
Pax,
That's part of my winning formula, I just got easier to spot visuals but at the end of the day price action however sliced or represented, is where the gold is.
Anek
__________________
PM
Hey Anek I have a few questions.
1) You say you 'reverse' DTs & DBs if they fail. At what point do you consider
the failure to be intact?
2) When looking to enter on pullback of a solid trend up or down, do you look to
be in on something more along the lines of a Ross Hook rather than needing 2+
bars of HH/HL ?? (For clarification, entering on a Ross Hook out of a pullback
would mean taking an entry once a new 1 bar high is made following the first 1
bar failure to create a new high/low in a trend with HHs/HLs or LH/LLs. Sorry if
that is confusing, might have to read a few times, otherwise I can put up a
chart later visually describing my Q.)
3) When a current trend finally concludes its move and has begun heading in the
other direction, what do you need to see from the new trend in its early stages
before you consider any of its pullbacks a valid entry point? (Eh, that seems
mildly confusing too but not sure exactly how to word it. Easier to show
everything on a visual chart. So as I said with the last question if these are
super confusing i'll put up a chart and visually express what I'm trying to ask
here).
Thanks.
~Cx
I just realized I forgot to post the chart.
Thanks.
Pax,
Most of the time swings up or down are not as swift as the chart I posted but
more like zig zag looking waves.
Now, when momentum is strong look for hints like that to know when it "might" be
time to get out or stay alert.
Anek
Quote from PaxMax:
Thanks man,
I'm going to work on a second chart setup, hoping to find a decent exit signal, compare with the chart you've posted, very inspiring.
I'm spotting my entries on a 45 seconds candle chart. After retracement from a HI/LO , there is often a few bars with narrow range. As a matter of fact, this is working OK for me.
(Drawing trendlines for the DAX doesn't work for entries/exits. They get violated both directions, while trend remains intact. Of course, yesterdays AM chart is there to prove the opposite.One thing that works most of the time is HH/HL. )
But the 45 secs chart is definetely not OK for exits in the way you're showing (a bar close price above the previous bar's high).
I'll work on it, and keep you posted.
But right now, I'm going long a few beers as well!
PM
Quote from Cxinvest:
Hey Anek I have a few questions.
1) You say you 'reverse' DTs & DBs if they fail. At what point do you consider the failure to be intact?
2) When looking to enter on pullback of a solid trend up or down, do you look to be in on something more along the lines of a Ross Hook rather than needing 2+ bars of HH/HL ?? (For clarification, entering on a Ross Hook out of a pullback would mean taking an entry once a new 1 bar high is made following the first 1 bar failure to create a new high/low in a trend with HHs/HLs or LH/LLs. Sorry if that is confusing, might have to read a few times, otherwise I can put up a chart later visually describing my Q.)
3) When a current trend finally concludes its move and has begun heading in the other direction, what do you need to see from the new trend in its early stages before you consider any of its pullbacks a valid entry point? (Eh, that seems mildly confusing too but not sure exactly how to word it. Easier to show everything on a visual chart. So as I said with the last question if these are super confusing i'll put up a chart and visually express what I'm trying to ask here).
Thanks.
~Cx
Some of you guys need to memorize these two basic but imperative formations.
Anek
Ed,
Attached please find the buy signals study, some were correct others were not.
Remember that if you do this correctly and you base your stops on support and
resistance the risks are minimal.
Hope it helps.
Anek
Cheers matey ![]()
Quote from Cxinvest:
Nice job Raz.
~Cx
Quote from Anekdoten:
Ed,
Attached please find the buy signals study, some were correct others were not.
Remember that if you do this correctly and you base your stops on support and resistance the risks are minimal.
Hope it helps.
Anek
Quote from edpolton:
Thank you, that was helpful.
I am used to candlesticks and did not notice the wick. At least I know I am on the right track. I plan to read thru the thread again for more insight.
I am currently a S/R -Trendline swing trader and your style of scalping fits in with my mindset. I have been playing with various scalping strategies with mild success. I am hoping your insight helps me to codify a scalping style that works for me.
I appreciate your taking the time to respond to my questions.
Quote from Anekdoten:
Ed,
Knowing when to stay out is possibly the hardest part of AHG aside from discipline.
Anek
Quote from edpolton:
That is what I figured. Thanks.
That is why I posted a few trades that seemed good to me, but did not seem to work out. My first goal is to identify what to avoid.
Quote from Anekdoten:
Ed,
The buys I marked were perfectly valid, there were no apparent reasons to stay out.
Anek
\
Quote from Anekdoten:
1) Say a DB fails if I see a lower low and a lower high forming after the failure I usually jump short on the next pop failure. On friday afternoon the market took down support and broke the double bottom that formed at the lod, this was against the trend so the buy point was after taking the middle swing high and not underneath support. As far as riding the failure a lower low and lower high aka swing low below that double b was never actually formed, because it was all a fake. Then the market returned and took the middle swing high exploding to the upside for a very nice target.
Conventionally people go long when resistance is broken and go short when support is broken. The question is what exactly does "broken" mean, well when support actually becomes resistance and when resistance becomes support. In other words a swing confirming the action after the s or the r were taken. Why is all this confirmation necessary ? Because it increases accuracy decreases fakes and allows you to trade with confidence.
2) I look for many things but the key is waiting for some evidence in those bars and/or the tape.
3) For me to call a reversal assuming the previous trend was long I need to see a double top followed by a ll and a lh or 2 lls and 2 lhs.
Major trendline failures are extra confirmation. Make sure you look at the big picture to understand how important or unimportant those areas really are.
The more important the more it will be fought by the defending side.
Anek
Quote from Cxinvest:
\
You think TS's inability to produce constant volume is going to cause charting problems affecting AHG style down the road?? Just wanted to hear your opinion.
~Cx
Quote from Anekdoten:
I'm not worried been using TS for a while now. In fact, I would rather use tick charts than learning a whole new platform at this point.
Would be nice to see TS get their act together though. Posting on the forums might help.
Anek
Cx,
I have a friend who is a EL engineer in their team. Let's see what kind of
response I get, and will report.
Anek
Quote from Anekdoten:
Cx,
I have a friend who is a EL engineer in their team. Let's see what kind of response I get, and will report.
Anek
This week I continue my studies in NQ and slightly deviate from ES but only
temporary unless the results merit a permanent change.
Eventhough I wil pay a premium in commissions I expect some of the brutal
breakouts/downs to make up for it.
I noticed a peculiarity of the NQ that is very compatible with my style, this
includes AHG and non AHG setups.
I used to trade the Qs on a daily basis a long time ago, should be familiar
territory.
Tomorrow marks my 10th consecutive month of strictly e-mini trading (did YM, ER2
and obviously ES), can't say I miss equities.
Conclusion to come at the end of 1 or 2 weeks. To leave ES my performance has to
increase by a minimum of 20%, no less. For what it worth my performance
increased from YM to ES by a margin of a stunning 32%.
Needless to say, goggles are on, off to the laboratory, the experiment begins
today ![]()
Anek
Quote from Anekdoten:
This week I continue my studies in NQ and slightly deviate from ES but only temporary unless the results merit a permanent change.
Eventhough I wil pay a premium in commissions I expect some of the brutal breakouts/downs to make up for it.
I noticed a peculiarity of the NQ that is very compatible with my style, this includes AHG and non AHG setups.
I used to trade the Qs on a daily basis a long time ago, should be familiar territory.
Tomorrow marks my 10th consecutive month of strictly e-mini trading (did YM, ER2 and obviously ES), can't say I miss equities.
Conclusion to come at the end of 1 or 2 weeks. To leave ES my performance has to increase by a minimum of 20%, no less. For what it worth my performance increased from YM to ES by a margin of a stunning 32%.
Needless to say, goggles are on, off to the laboratory, the experiment begins today
Anek
Anek,
Given your propensity for after hours trading, why not try the Hang Seng?
B
Quote from Bogwaluth:
Anek,
Given your propensity for after hours trading, why not try the Hang Seng?
B
Got a few PMs regarding chart types I'll be using for NQ so decided to just
screenshot the main workspace.
Disregard what looks unfamiliar.
Anek
Welcome to NQ, bro! Show everybody it's the best place to be!
__________________
Hypostomus Plecostomus (Not an alias)
Hypostomus enthusiastically endorses the products and services offered by
E-Signal and Interactive Brokers, and will continue to do so until they pay me
to stop.
I just finished reading a personal story revealed via PM that was quite
touching.
In the end the person absolutely begged for a hint as to what the holy grail is
and if it exists.
It depends on what it means to you. If it's something that works all the time,
the answer is no, at least I don't think so.
If it's constant profitability with low drawdowns then the answer is yes,
absolutely.
Anyway, here is, in all honesty my thoughts on it....
Holy Grail =
Only adding to Winning Positions
+
Mastering a simple working strategy
+
Solid Discipline
+
Trading only what you see with zero bias.
Sorry, can't think of a better answer thought the question was highly unusual
even if it's mentioned all the time.
...but if you know the answer by all means, feel free to post it,
![]()
Anek
Quote from Anekdoten:
I just finished reading a personal story revealed via PM that was quite touching.
In the end the person absolutely begged for a hint as to what the holy grail is and if it exists.
It depends on what it means to you. If it's something that works all the time, the answer is no, at least I don't think so.
If it's constant profitability with low drawdowns then the answer is yes, absolutely.
Anyway, here is, in all honesty my thoughts on it....
Holy Grail =
Only adding to Winning Positions
+
Mastering a simple working strategy
+
Solid Discipline
+
Trading only what you see with zero bias.
Sorry, can't think of a better answer thought the question was highly unusual even if it's mentioned all the time.
...but if you know the answer by all means, feel free to post it,
Anek
NQ Update
So far, cake.
Double top, broke support, nothing but selling and rectangular formations to the
downside.
Anek
Quote from Anekdoten:
NQ Update
So far, cake.
Double top, broke support, nothing but selling and rectangular formations to the downside.
Anek
Daily target reached.
Do I stop ? Nah.
If it chops I'll stay out, if reversal small price to pay.
![]()
Anek
Quote from Anekdoten:
Daily target reached.
Do I stop ? Nah.
If it chops I'll stay out, if reversal small price to pay.
Anek
Post it, very relaxing market now.
Anek
Cx,
Your job is not to ride the whole trend, a good portion of it will do just fine.
In fact, it's how it is supposed to be done.
I say make an effort to ride the winners not ride it all, big difference.
Anek
Quote from Anekdoten:
Cx,
Your job is not to ride the whole trend, a good portion of it will do just fine. Anek
Ok here is my entry which I was making on what I saw as the first rollover
after the close under that double-top valley. I got out earlier than I normally
would have anyway based on price action (IRL distractions), but that wasn't my
concern. The issue is defining when to be out and not jumping out early. Here is
the chart.
~Cx
Cx,
I see nothing wrong with your exit.
Only mistake I see is you did not keep shorting the pop ups as soon as they were
showing weakness.
I had 4 adds on that chart.
Anek
Quote from Anekdoten:
Cx,
I see nothing wrong with your exit.
Only mistake I see is you did not keep shorting the pop ups as soon as they were showing weakness.
I had 4 adds on that chart.
Anek
Cx,
It's up to you, as long as it's based on price action, you will do fine.
In time you will learn peculiar characteristics like the smaller the retracement
below resistance the more strength there is therefore the more brutal the
breakout.
Stuff like that.
NQ has been like kindergarden today.
Downtrend, obvious reversal formation, uptrend.
WTF, thank you market!
Anek
Major newbie loving the thread here.
I missed the initial part of the down trend(ES) and for some reason I could not
back fill the first 45 min of the day. It drove me crazy.
So I didn't see any opps that stood out as the trend progressed.
I then saw chop at around 10:50 est on 10000 volume candle. And then the trend
reversed. On the pullbacks I am very cautious to enter because I have a hard
time seeing indications for a continuation.
But when I look at my 5min candle setup I saw after the fact a 123bar reversal
that would have done nicely. (12:55 est).
Are there signs you see to look at other time frames? Seems I get caught up in
messy candles. If I answered my question I'd say I was at too high resolution.
Something tells me that looking thru a magnifying glass may be a typical
psychological problem.
Tech,
I think using multiple timeframes looking for entry is the right way to do it.
Either that or sit on your hands until you see a convincing setup.
Patience is imperative in trading.
As far as time based charts, some traders use them well, I find very little
value in them so whatever helps your trading.
I just hate long bars, unless you are watching them with time and sales what's
inside them can be very hard to spot.
Anek
Quote from Anekdoten:
In time you will learn peculiar characteristics like the smaller the retracement below resistance the more strength there is therefore the more brutal the breakout. Anek
No, upside.
Anek
Quote from Anekdoten:
No, upside.
Anek
Quote from Cxinvest:
P.S. What size/brand monitor you running? Looking at something along the lines of a 30" LCD pretty soon here from Samsung (Syncmaster 305t or Dell(UltraSharp 3007WFP-HC ). They seem to be two of the best from my research. Anyone else who has had experience with these bigger LCD monitors do share your wisdom.
Quote from Cxinvest:
Ok here is my entry which I was making on what I saw as the first rollover after the close under that double-top valley. I got out earlier than I normally would have anyway based on price action (IRL distractions), but that wasn't my concern. The issue is defining when to be out and not jumping out early. Here is the chart.
~Cx
Sure is a lot easier to look back on a previous chart to find entries than it
is to do it in real time.
I made two trades today, using AHG, based on what I thought at the time were
good entries. I lost 3 points on one and made 3 points on the other, so came out
even.
Looking back it is easy to see my mistakes. I was sitting on the fence for the
whole downtrend, making all the right calls, then decided to jump in at the
exact wrong time.
Cx's chart.
Quote from Anekdoten:
Cx's chart.
No real reason, a matter of preference.
Yes, the pop ups are all opportunities.
Anek
Quote from Anekdoten:
No real reason, a matter of preference.
Yes, the pop ups are all opportunities.
Anek
I think the official name of that pattern is the 2B, although I could be
mistaken.
For what is worth, I play it like a Double B if at LOD.
Anek
Quote from Anekdoten:
Some people feel they need a bigger penis to make love I feel comfortable with my 15" laptop of course more goodies help.
Did that analogy make sense ?
__________________
Dinoman
Confirmed, it's the Trader's Vic 2B pattern.
The reversed version at the top, the M with the second top a bit higher but
still taking the swing in the middle down would be the 2B bearish one played
like a double top.
Anek
Quote from Anekdoten:
Some people feel they need a bigger penis to make love I feel comfortable with my 15" laptop of course more goodies help.
Did that analogy make sense ?
I use an HP2335 LCD with a state of the art PC updated (roughly every 6 months) for trading and a Laptop for chatting/forums/fun/music.
Ironically I have 5 systems in "mission control" and about 8 LCDs but I have traded on the road with the laptop and you know what, I did just fine, maybe harder on the eyes but that's about it.
In fact, I have no idea why I got all these systems, I certainly don't use them all for trading but since I purchase one so often they pile up. Should donate some to local public schools with needs. I know one of them will soon become a movie entertainment system for the kids, convert the DVDs into ISOs. Those little bastards wipe their asses with their discs, must act before they are all ruined.
Sorry for the prosaic post, one too many stouts today on a very profitable trading day
Anek
Quote from jack411:
Cx,
Thanks for posting your chart. I wanted to ask you, what made you enter at that particular point and not a little earlier? Were you just confident by that time that we were in the middle of a downtrend? I'm just wondering if you saw something that I am not seeing, and that is why I ask. Either, way it was obviously a good trade.
Quote from Anekdoten:
Cx's chart.
Quote from Cxinvest:
P.S. <==Huge
<==small but I can daytrade !
Good stuff! Why the line near the end of the chart stating "this is where you should start buying retracements" ? Were you basing that statement on the new swing highs/lows back up or were you actually referring to HH/HL over that level? Seems like once the last swing high was finally taken out in the prior trend that once you had 2 HL/HH swings that you should be ready to rock on any following pullbacks!!
~Cx
FYI, here are descriptions/pics of 123 reversals and 2b reversals:
http://www.dacharts.com/123.htm
http://www.dacharts.com/2b.htm
Cheers matey ![]()
Quote from Anekdoten:
I'm proud of you man.
Anek
Hi,
Took yesterday off, back at it today
![]()
Cheers ![]()
Hi All
I have been following this thread since the start and i love it. Thank you Anek
& everyone else for putting the time and effort into this.
Anek, i am very curious about how you traded AHG today (the trading day is not
done i would like your opinion on the morning session)
thank you in advance!
Quote from bugsbunny:
Hi All
I have been following this thread since the start and i love it. Thank you Anek & everyone else for putting the time and effort into this.
Anek, i am very curious about how you traded AHG today (the trading day is not done i would like your opinion on the morning session)
thank you in advance!
choppy, no?
J,
Extremely, and slow.
In the NQ there was a head and shoulders formation in the 1500 shares chart
that became invalid as the right shoulder was taken out by a closing bar.
After that it formed a clear strong uptrend taking the HOD several times with
conviction and healthy retracements.
Patience is a virtue, in trading, it's a commodity
![]()
Anek
What a mess. I got chopped to pieces today.
~Cx
Yah, me too. First losing day in a long while, but it was a doozy. Welp,
we'll see what tomorrow brings.
And boy do I need to ingraine into my memory when to stay on the sidelines.
Net Gain +$66 on 4 NQ trades, 1 car each. Traded OK today but not pleased
with one of the trades when I sold for +2.50 when I should have just gone to
breakeven at that point as per usual and would have ended banking the typical 4+
points on winners.
Equity trades were good, banked some on GOOG and AAPL.
Cheers ![]()
PS: Came back to edit this, tried a short end of day after that large run down
and got stopped, no worries was a valid short attempt, Net Gain on day now only
$21 on 5 NQ trades, 1 car each.
ok,
So I'm not alone.
Seemed like trend reversals all day.
Anek,
If you decide to, could you look at my chart and maybe give a few words about
it?
I attempted 2 trades that slapped me in the face.
I made some notes on the chart that you may want to contribute to as well.
..... if you like.
-Tech
Crap. Guess that is what I get for leaving early!
~Cx
My NQ daily analysis.
Pay up with a stout!
Anek
Quote from Anekdoten:
My NQ daily analysis.
Pay up with a stout!
Anek
![]()
Keep posting your charts!
I learn so much!
I really see that you take the close of the bars seriously.
I also see that you are patient.
Quote from Techdoodle:
ok,
So I'm not alone.
Seemed like trend reversals all day.
Anek,
If you decide to, could you look at my chart and maybe give a few words about it?
I attempted 2 trades that slapped me in the face.
I made some notes on the chart that you may want to contribute to as well.
..... if you like.
-Tech
Quote from Cxinvest:
Crap. Guess that is what I get for leaving early!
~Cx
Quote from Techdoodle:
Keep posting your charts!
I learn so much!
I really see that you take the close of the bars seriously.
I also see that you are patient.
Anek, I see everything you noted on your chart. The problem is I see it quite
a bit after it happens.. ![]() The end
of the day rally, "WTF I missed this" is there any rule in AHG that would let
you buy into it? At that point the lowest lower high was 1993.
The end
of the day rally, "WTF I missed this" is there any rule in AHG that would let
you buy into it? At that point the lowest lower high was 1993.
Quote from Jaxon:
Anek, I see everything you noted on your chart. The problem is I see it quite a bit after it happens..
Quote from Anekdoten:
Jaxon,
Screen time will give you the speed you are missing, I promise.
Not really anything AHG related on that last furious move. Just a V bottom that stunned me because it worked so fast and so well.
For V bottoms draw a downtrendline, when broken, scalp the price action and stay on the same side of momentum as long as momentum does not fade.
Attaching a small illustration, this is not AHG this is pure scaling.
Anek
Quote from Cxinvest:
Hmm. Problem is on the 5000v or even the 2500v ES, that 'V' reversal started another pivot down before it shot up. I might have shorted on the ross hook and gotten stopped out on that one
~Cx
P.S. Also had earlier single bar HH's on ES in that double top slide. How would you have handled those Anek?
The ES bounced off of the R-1 pivot @ 1467 (almost on the money) and went straight to 1473.75. Maybe it would be a good idea to watch the ES pivots when your trading the NQ.
Quote from Honda:
The ES bounced off of the R-1 pivot @ 1467 (almost on the money) and went straight to 1473.75. Maybe it would be a good idea to watch the ES pivots when your trading the NQ.
Quote from Techdoodle:
Keep posting your charts!
I learn so much!
I really see that you take the close of the bars seriously.
I also see that you are patient.
Quote from Jaxon:
Anek, I see everything you noted on your chart. The problem is I see it quite a bit after it happens..
Agree with Piscuy in all aspects.
Anek
Quote from Anekdoten:
Honda,
I'm not a big fan of one index leading the other or using pivots or using market internals. Simply because I feel faster with price action, has everything I need.
Support, resistance, highs and lows, time and sales, and finito.
Now, if you can help the readers of the journal with a system addendum that's fine by me just try to be descriptive and illustrative.
Thank you.
Anek
I'm reading Malcom Gladwell's book "blink".
He talks of "thin-slicing". which is a way of rapidly detecting a small amount
of specific things to sway your decision. I think both, Anek and Piscuy
understand that concept.
-Tech
I just found out who Piscuy is.
He's actually my partner in trading, did not have a clue until now.
He is not so much a trend follower, more like a scalper who likes to squeeze
every possible drop out of those bars with minimal risk.
Anything he says regarding price action, pay a great deal of attention.
He is a master at breaking the market's ass in a day to day basis yet I've never
seen him take a stop bigger than 1.5 points.
Anek
Anek,
I took two trades today and both reversed before reaching my target. It felt
like the market was choppy so I sat on my hands the rest of the day.
I was wondering if you (or anyone else) would comment on my entries.
On the bright side I had a great day trading gold![]()
For some reason my chart did not show up. Here it is.
Thanks.
Ed,
The morning was very choppy, I only took one scalp myself and before noon ends I
usually have 4-5 trades in the bag.
Now, the afternoon was vastly superior so just because a portion of the day is
choppy does not mean the rest will be as well.
Notice how price was over extended right before your entries. It looks like you
were buying tops and shorting bottoms.
You never gave the the bulls much of a chance to sell or the bears much of a
chance to cover.
There is an attachment from a few days back called holygrail.gif or something
like that. Look at those uptrend/downtrend formations, they got structure. This
morning was erratic.
Anek
Quote from edpolton:
For some reason my chart did not show up. Here it is.
Thanks.
Just coded some paintbars to accentuate price action. Fairly simple stuff,
have not tested it live but should be semi useful.
Screenshot attached.
Anek
Thank you Anek, and Piscuy, for your responses.
I greatly appreciate your taking time to help me on this journey. Your
generosity is remarkable and invaluable.
I will be studying your comments and the charts and will hopefully do a little
better tomorrow.
Please comment on entry
Hi anek & the rest of the gang
can anyone comment on this entry please
thxs in advance
Re: Please comment on entry
Quote from bugsbunny:
Hi anek & the rest of the gang
can anyone comment on this entry please
thxs in advance
Way too extended, minimal retracement, 71.50 was more in line.
You need to let bulls sell and bears cover after such moves.
NQ at kindergarden mode today.
Anek
Hitting the beach at lunch for a run.
Morning was optimal, no heat, no losses, nothing but a sweet uptrend with
obvious entries.
At this pace I don't see myself returning to ES but too early to tell.
Might be back in afternoon for scalps.
Anek
bugs and edpolten, I do the same thing, regularly. I watch and watch and wait
and wait and have the "move" all figured out and by the time I enter into the
trade the move is exhausted.
Anek, coincidentally (or not) I just did the same thing but with dots rather
than paintbars. I modified TROs "PMSM" (that stands for poor mans slot machine)
to indicate:
Top row references highs:
close > prev high = green, equal = yellow, lower = red
2nd row references lows.
close< prev low = red, equal = yellow, higher = green.
Hopefully my dots correspond to your colored bars.
![]()
Jaxon,
Looks good, try it on paintbars, that way yours eyes do not leave price.
A matter of preference of course.
Anek
Anek,
I would imagine that slippage must be an issue for you trading the NQ ?
At what contract amounts do you see slippage and fill issues on NQ ?
Can it handle 20 - 50 cars ?
Cheers ![]()
Razor,
My only heavy contract position is an exit after averaging up. The rest of the
time is just adequate sizing.
When I'm exiting, if the car size is monstrous, it means so are the profits so
no real harm done.
Don't forget NQ is twice as liquid as the YM. It's no ES, but still the second
most liquid emini of the four, including ER2.
Anek
Cheers man for response ![]()
Quote from Anekdoten:
Razor,
My only heavy contract position is an exit after averaging up. The rest of the time is just adequate sizing.
When I'm exiting, if the car size is monstrous, it means so are the profits so no real harm done.
Don't forget NQ is twice as liquid as the YM. It's no ES, but still the second most liquid emini of the four, including ER2.
Anek
Razor,
Now you got an NQ buddy ![]()
Anek
Attached please find my "trivial" but useful paintbars.
If a TS user.
Make positive bars Dark Green
Make negative bars Dark Red
Neutral White
Add my paintbars, make CL bright red and CH bright green.
...or your desired colors of course.
Should help with price action.
Anek
NQ vs. ES this a.m.
Anek,
I traded the ES this am and got chopped. If you would have taken the same trades
(at same time) on the ES vs. the NQ would you have faired as well?
Thanks,
Tyler
Sounds good to me ![]()
Quote from Anekdoten:
Razor,
Now you got an NQ buddy
Anek
I went to NQ since there was the idea that it trended well.
![]() Good place to practice imo.
Good place to practice imo.
![]()
So here is something I'm looking at....
If price retrace is looking a little choppy or weak, I cut resolution in half.
If it still looks questionable, I'll cut down the res by another unit.
1500/3000/4500.
If the 4500V candle looks ok, then I will look for confirmation from that res.
I think this idea is spawning how i would want to treat resolution.
-Tech
TV,
ES was a different chart compared to NQ, as expected.
Use frequency of waves to guide yourself, this has been discussed in the past,
just a reminder for the readers.
Anek
I use the same 400 share / volume bar chart everyday on NQ......fwiw
![]()
Tech,
Nice chart comparison, good timeframes too.
Chart size is extremely personal. Look at Razor using 400 and he likes it just
fine.
Shoot for what best fits your trading style.
Anek
Good mutual funds.
NQ Head and Shoulders at 1500 volume bars.
Watch shoulder for long breakout or neck for downside.
Wait for confirmation, first wave is for the amateurs.
Hope it helps.
Anek
Quote from Anekdoten:
Tech,
Nice chart comparison, good timeframes too.
Chart size is extremely personal. Look at Razor using 400 and he likes it just fine.
Shoot for what best fits your trading style.
Anek
NQ 5000 volume multiday, price bouncing off that trendline.
NQ Daily solid uptrend.
Anek
Loving NQ, hope it's not the sample data I have traded with.
Anek
Nice H&S breakdown the last 50 minutes or so of trading today!!! Sweet
Hey,
Net Gain +$219 on the day, 10 trades NQ, 2 of the trades where I did an add as
per Anek, one hit b/e, one nice gain to basically take me from down $80 on the
day to up $219 on the day ![]()
Did one AAPL trade for a nice gain.
Cheers ![]()
Edit: Just to point out that yes, you can have 10 trades during the day and
basically just catch that one trend that takes you from a loss on all the other
trades to a nice gain on the day. Gotta have the eggs to ride that trend. Lots
of small stops a few breakevens and one or two large trend rides is the way for
this method IMHO.
Quote from Razor:
Hey,
Net Gain +$219 on the day, 10 trades NQ, 2 of the trades where I did an add as per Anek, one hit b/e, one nice gain to basically take me from down $80 on the day to up $219 on the day
Did one AAPL trade for a nice gain.
Cheers
Edit: Just to point out that yes, you can have 10 trades during the day and basically just catch that one trend that takes you from a loss on all the other trades to a nice gain on the day. Gotta have the eggs to ride that trend. Lots of small stops a few breakevens and one or two large trend rides is the way for this method IMHO.
The key to successful trading is averaging small losses and big wins.
It just requires concrete education in technical analysis solid good money
management and the very best of discipline.
Anek
Cheers ![]()
Quote from Cxinvest:
Way to go Razor
~Cx
You seem to be getting pretty consistent lately.
The good news is from here you only get better, up to a point where you
absolutely toy with the market.
Great job.
Anek
Quote from Razor:
Hey,
Net Gain +$219 on the day, 10 trades NQ, 2 of the trades where I did an add as per Anek, one hit b/e, one nice gain to basically take me from down $80 on the day to up $219 on the day
Did one AAPL trade for a nice gain.
Cheers
Edit: Just to point out that yes, you can have 10 trades during the day and basically just catch that one trend that takes you from a loss on all the other trades to a nice gain on the day. Gotta have the eggs to ride that trend. Lots of small stops a few breakevens and one or two large trend rides is the way for this method IMHO.
Cheers ![]()
Quote from Anekdoten:
You seem to be getting pretty consistent lately.
The good news is from here you only get better, up to a point where you absolutely toy with the market.
Great job.
Anek
On top of what Razor said, which is all true.
Never ever should you allow yourself a single trade to become a large loss.
Five small losses in a row, sure, np.
One big loss, never.
Anek
NQ afternoon.
Anek
Market blacked my other eye today heh. Back at it tomorrow.
~Cx
Cx,
Post a chart.
Anek
Quote from Anekdoten:
Cx,
Post a chart.
Anek
Cx,
Some speedy analysis, hope it helps.
Anek
Tip...
The steeper a trendline the higher chances of a TL break, they simply
have much higher chances of losing control of the trend.
Take this very much into consideration.
Anek
Quote from Anekdoten:
Cx,
Some speedy analysis, hope it helps.
Anek
I took 4 trades today. 2 worked out and two did not. I was basically even for
the day.
I posted the chart in case you have time to comment.
I have reviewed your comments on CX's chart. They were very helpful. Thanks.
Quote from Cxinvest:
Ok a couple things then:
1) You only take DT's in downtrends and DB's in uptrends? (or
were you referring strictly to the aggressive entries?)
2) Your last "No short?" box in the upper right... the
Risk / Reward seems a bit tight on that trade too like you
mentioned on one of my earlier trades. Am I not seeing
something right there?
3) Still curious what you thought about my stops statement. I
realize I must avoid big losses, and entering on trend
pullbacks seem to be where i have my more full stops. Been
placing them above / below the pullback i enter on (see as
logical spot), yet 2-3full points doesn't seem like alot in the
scheme of things. What do you think?
Thanks for the analysis. Every chart you mark up helps alot. No exagg.
~Cx
"......If there is one thing consistent in the stories of how good traders
turned themselves around from being bad traders, it is their attitude about
losses. Professional traders accept that losses are part of the game. Since the
markets are mostly random, the best trading methods will always have numerous
losses. Professionals do not equate losses with being wrong.
It is precisely because correct trading methods invariably generate many losses
that it is important to keep the individual losses small in relation to the
overall size of the account. In order to keep trading, you must preserve your
capital. IF YOU CAN KEEP TRADING IN THE DIRECTION OF THE TREND, THE BIG PROFITS
WILL COME. However, if you take too many large losses, your capital will be
wiped out before you can enjoy the big profitable trades.
The laws of probability INSURE that regardless of your approach, you will
inevitably suffer some long strings of consecutive losses. If you are risking
too high a percentage of your account on each trade, before long one of these
unavoidable losing streaks will blow you away. Keeping losses to about one
percent of your account size is optimal. With smaller accounts, the percentage
will have to be larger. Five percent on one trade is probably the highest
prudent level of risk." - Bruce Babcock
If you are struggling, you probably need to make these words your daily
mantra...
Quote from Anekdoten:
1) I only the take miniscule stop types when the DT or DB is inline or with the major trend, otherwise I wait for the middle swing to be taken by a closing bar. You should know this by now
2) Mine is a double top WITH the trend.
3) My stops are usually based on momentum and lows of previous bars, it varies from play to play. Needless to say if the play requires a big stop I will prob skip the play. If stop is bigger than usual, trail manually as needed to preserve capital, always based on price action. Remember the best plays usually work from the start.
Anek
A. If you get a chance, would appreciate comments on todays trades.
D.
Hey,
Just my thoughts.....awesome day, you made roughly 6 points on the ES in one
day. If you could net that a week and build size you could make a very nice
living (ie: 6 points a week x 4 weeks x $50 a point x 10 cars = $12,000, take
away some commish of say something conservative of $4,000 = $8,000 a month x 12
months = $96,000 a year....and 10 cars ain't much to build up to if you have a
solid consistent strategy IMHO)......You could have 2 small losing days, 2 small
winning days and then a nice +6 point day like this per week and still earn a
nice living is my point, which is why gotta keep the losers small in general and
the losing days small as well as compared to the monster trend days which happen
easily 4 - 6 times a month where you make all your gravy.....JMHO..... Good work
today I would say.
Cheers ![]()
Quote from bmwhendrix:
A. If you get a chance, would appreciate comments on todays trades.
D.
Cx,
The "No short?" is really a double top. Look at the two high wicks.
Anek
Quote from bmwhendrix:
A. If you get a chance, would appreciate comments on todays trades.
D.
LOL ![]()
Quote from Anekdoten:
bmw,
winners > stops ?
what do you want a stout too ?
you doing fine!
Anek
Quote from Anekdoten:
Cx,
The "No short?" is really a double top. Look at the two high wicks.
Anek
Basically I had no discipline this morning, none. I forgot the rules and just
averaged down like an idiot (kinda wish I could kick myself in the balls, it's
what I need).
Anyway, Anek please if you would, check your private messages.
Anek,
I see you mentioned programming your ideas for auto trading a while back. Was
curious to know if you have been able to create an automatic system based on the
price action principles discussed on this great thread.
Thanks for all the commentary.
Quote from xiaodre:
Basically I had no discipline this morning, none. I forgot the rules and just averaged down like an idiot (kinda wish I could kick myself in the balls, it's what I need).
Anyway, Anek please if you would, check your private messages.
Quote from ksungela:
Anek,
I see you mentioned programming your ideas for auto trading a while back. Was curious to know if you have been able to create an automatic system based on the price action principles discussed on this great thread.
Thanks for all the commentary.
"it is my trading nemesis"
Mine too.
My only bigger one is discretionary trading.![]()
Quote from ksungela:
"it is my trading nemesis"
Mine too.
My only bigger one is discretionary trading.
I can see and understand all the patterns in the left and middle section of
the chart. Its the right edge I have trouble with. I can always see reasons to
go long or short. When I pick one, I don't have a disciplined exit strategy I
believe in (positive expectancy).
I've changed my screen name to the type of trader I want to be.
I need to go code my ideas and backtest to take the emotional element out of my
trading.
Journal break time, need time to work on a home project so will take some
time off the journal for it.
Good trading.
Anek
Small losses are normal, necessary, and definitely part of SUCCESSFUL
trading.
I could not have said it better.
Piscuy
Quote from xiaodre:
Basically I had no discipline this morning, none. I forgot the rules and just averaged down like an idiot (kinda wish I could kick myself in the balls, it's what I need).
Anyway, Anek please if you would, check your private messages.
Quote from Bbox_trader:
.......I need to go code my ideas and backtest to take the emotional element out of my trading.
Daily Mantra 2
"The amateur assumes that he can conquer the markets through superior analysis.
He spends nearly all his time looking for effective ways to predict where the
markets are likely to go next. Believe me when I say that the markets are not
predictable in the sense most traders use the term. Luckily, it is not necessary
to predict the markets to make money from them.
The professional has had enough experience to learn the limitations of analysis.
While there is a repetitive similarity to market behavior, there is just enough
uncertainty to make predicting the future an impossible task.
The professional knows the importance of a consistent approach to the markets.
He has a concrete plan of attack. He seeks to follow existing trends rather than
predict future trends.
Almost all traders fail to exploit the statistical advantage of following trends
in the futures markets. They do not trade their system religiously, they choose
a poor group of markets to trade or they overtrade their capital and are forced
to quit too soon. An essential thing to avoid is trading with an
over-curve-fitted system. Nearly every system is curve-fitted to some extent.
The minute you test an idea and then change it at all to improve performance,
you have engaged in curve-fitting. The more you bend your system around to
improve performance on past data, the less likely it is your system will trade
profitably in the future. This is very hard for inexperienced traders to accept.
They expect that methods which worked well in the past will probably work well
in the future. Past performance will only APPROXIMATE (and I emphasize
approximate) future performance to the extent the system is not
over-curve-fitted." - Bruce Babcock
Internalize these words folks...
absolutely true.
I spent years coding systems and the observations you express are the reality of
the markets.
thanks for the post
Backtesting is the best thing to come along in a long time, for the brokers. It has sucked a lot of people into the market. It looks so easy.
Nice double top on the ES just now, 2 points below, but it seems to be pretty
muddy down here now at 92.5...
I'M STAYING OUT FOR ONCE! ![]()
I guess Jim Simmons and his people do it properly. Correct me if I'm wrong,
but he made $1B last year system trading.
I believe system trading is possible, that's why I keep trying. Maybe others
gave up to soon or are just better suited for discretionary trading. Everyone
needs to trade the way that fits them. But, it appears logical to be able to put
a set of trading rules to code to yield a profitable system going forward,
taking emotions out of it.
A double bottom repeats itself just like it did decades ago, so why not quantify
it and create a system out of it.
That's my next step.
Disagree with me if you want, I'm not trying to disprove anyone, if you make
money, all the best using your method.
stops
Anek, I'm also trying your method and having good results. The biggest thing
I struggle with is how far must a trade go in your favor before you move your
stop to breakeven. For example, today I entered a trade in the ES that went plus
2.5 in my favor. My stop, based on s/r was below my entry by a 1/2 point. Do you
let the trade go in your favor this much and still take a loss by waiting for
your original stop being taken out? I took 3 ticks profit(exited on a trendline
break), but in the process gave back 1.75 pts. Any help by you or anyone else on
this thread is greatly appreciated.
Billydakid
Re: stops
Quote from billydakid:
Anek, I'm also trying your method and having good results. The biggest thing I struggle with is how far must a trade go in your favor before you move your stop to breakeven. For example, today I entered a trade in the ES that went plus 2.5 in my favor. My stop, based on s/r was below my entry by a 1/2 point. Do you let the trade go in your favor this much and still take a loss by waiting for your original stop being taken out? I took 3 ticks profit(exited on a trendline break), but in the process gave back 1.75 pts. Any help by you or anyone else on this thread is greatly appreciated.
Billydakid
Scaling out works if you are trading more than 1 contract. It doesn't if you
only trade 1, though, and isn't it detrimental to the bottom line, as you say,
since scaling in, then all out once price reaches the stop maximizes the trade?
I think some peeps have mentioned using the end of last bar as a moving stop at
some point...
I'm interested in what happened to price after you exited. Did it go back down,
creating a new LH? or did it go back up through your entry and your stop,
creating a low?
Piscuy, I'm only trading one car for now. Price did not make a lower low, but
did come back to my entry( after I exited) and then continued to the high it is
at now.
Billy
Hey Guys,
Hope all of you are trading well these days. Piscuy its good to have you in the
forum and if Anek speaks highly of you then we can definitely learn from you.
I know its all about price action and trend following. and I know the main
variables are price and volume bars but does anyone use any type of Technical
Analysis for confirmation or just to enhance the trade probability. I know Anek
doesn't since he preaches price,price,price. but anyone else Piscuy ? any other
trader.
For example, at an end of an uptrend to confirm if its gonna head down and you
see and feel it coming, anyone look at the MACD signal line crossing then zero
line crossing. just as an example. or possibly look at some type of oscillator.
Basically does anyone have some sort of companion tool, or something extra
different than the price and volume ?
Please let me know if you guys do have something different. that goes along with
price and volume.
I know Technical Analysis is slow and conflicting and distracting, I've seen
what you guys mean. The trend before everything else. but if there's anything
else for guidance I'd appreciate it.
Thanks to everyone for posting their charts and feedback.
Hi,
Net Loss -$212, not a bad day IMHO, took a lot of legit trades that simply
stopped out. Lots of back filling etc. There will be days like this, no worries.
Took a couple of stops in GOOG as well.
Tomorrow is another day.
Cheers ![]()
Find opportunities that provide very small risks and decent rewards.
Sell and cover at logical places if only using uni-cars.
Until you get that, you won't make it.
Back to errands...
Anek
Two trades, two wins +4.5 pts. About time for a losing day for me the way things usually go.
chart
Nice ! ![]()
Quote from bmwhendrix:
Two trades, two wins +4.5 pts. About time for a losing day for me the way things usually go.
dang formats....chart
Quote from booyah:
Hey Guys,
Hope all of you are trading well these days. Piscuy its good to have you in the forum and if Anek speaks highly of you then we can definitely learn from you.
I know its all about price action and trend following. and I know the main variables are price and volume bars but does anyone use any type of Technical Analysis for confirmation or just to enhance the trade probability. I know Anek doesn't since he preaches price,price,price. but anyone else Piscuy ? any other trader.
For example, at an end of an uptrend to confirm if its gonna head down and you see and feel it coming, anyone look at the MACD signal line crossing then zero line crossing. just as an example. or possibly look at some type of oscillator.
Basically does anyone have some sort of companion tool, or something extra different than the price and volume ?
Please let me know if you guys do have something different. that goes along with price and volume.
I know Technical Analysis is slow and conflicting and distracting, I've seen what you guys mean. The trend before everything else. but if there's anything else for guidance I'd appreciate it.
Thanks to everyone for posting their charts and feedback.
Thanks P.
I already noticed conflicts with the trend and signal, and it was confusing, in
any case I was curious if you guys use anything in conjuction with the basic
price/volume trend model.
I was hoping to find one more tool to assist in increasing probability. For
example in and uptrend during the retracement before the next surge up. If the
volume is falling during the retracement that is a bullish sign. That along with
trendline intact. Is there any other signal/tool/indicator to buy that
retracement. that would help me in this case.
I whole heartedly agree with what you and others are saying, and the Price is
the most important aspect.
So far TA hasnt helped but I try to keep an open mind and learn (trial and
error) since it works for some while others hate it.
Thanks.
Re: Re: stops
Quote from Piscuy:
How about scaling out? When your scaling out you are sacrificing possible future profits for the certainty of locking current profits.
__________________
.....He who knows himself is enlightened.
--Lao-Tzu
Quote from Piscuy:
I'll have you do a little exercise so that you answer for yourself why so many focus on price, price, price. Yes, oscillators can give some entries, yes macd can give some entries. Now what happens when they diverge? Most of the indicators i know have divergences. Also keep in mind that if you find the need to use an indicator (I cant stop anyone from trying) use it as reference, but ALWAYS base your trade on price action.
I am not using any indicators and like everyone else I did at one time. If i had to choose one to use I would go with CCI. Although you would have to learn how to use it and the quirks it has. While you use indicators you will always sooner or later get a conflicting signal, so then you come to the dilemma of which to trust. When your trading with price things are or things are not. It is going up or not, its going down or not.
Everyone enters a trade with the expectancy that it will do something, if it is not doing what its supposed to do exit the trade and look for the next one. Trade with reason, exit with reason, conserve capital and in the end profits will come.
Hope this helps and good trading.
CX its funny you mention that. I had a couple of trades that weren't
moving/working from entry and didnt do what I anticipated. I felt I was gonna
head the wrong way and I exited before it hit my stop. losing a couple ticks
instead of points and then the price ended going past price.
So... It really is true that a winning trade should work from the beginning.
Simple yet so true.
Chris,
Welcome to the journal.
I identify with your post a great deal because when I was struggling in equities
this is exactly what I had to do to turn things around.
If I may, please look into averaging up and study it carefully. The hardest part
of pyramiding into the winners is the amount of small winners that will
eventually become small losers or break evens, at first it produces numerous
psychological hits.
I never thought I could make over 90k off a single signal without using an
absurd starting position until I started using this methodology. Needless to
say, it would be impossible for me nowadays to lose over 1% of that in any
single trade.
Anek
Quote from booyah:
So... It really is true that a winning trade should work from the beginning. Simple yet so true.
Quote from booyah:
Thanks P.
I already noticed conflicts with the trend and signal, and it was confusing, in any case I was curious if you guys use anything in conjuction with the basic price/volume trend model.
I was hoping to find one more tool to assist in increasing probability. For example in and uptrend during the retracement before the next surge up. If the volume is falling during the retracement that is a bullish sign. That along with trendline intact. Is there any other signal/tool/indicator to buy that retracement. that would help me in this case.
I whole heartedly agree with what you and others are saying, and the Price is the most important aspect.
So far TA hasnt helped but I try to keep an open mind and learn (trial and error) since it works for some while others hate it.
Thanks.
Quote from Cxinvest:
Thanks for all your help and input too Piscuy. The information is very helpful. I am finding that your advice about --exiting when your trade does not do exactly as planned-- is becoming a better idea then taking full stops. Looking forward to more quality wisdom and advice.
~Cx
hey guys,
I was wondering has anyone traded the nikkei futures mini contract ? I know some
have traded the DAX, but the Nikkei Mini trades at ideal hours for people live
on the east coast in US. something like 8pm - 2 am. if anyone has any experience
/feedback (positive or negative) on the asian markets index futures. Please
advise.
Thanks
Quote from bmwhendrix:
dang formats....chart
Help identify Technical Indicators for confirmation
Folks,
This site has got lot of useful information. Thanks to each one of you for
making it more valuable to new traders like me.
Btw, I started trading options for the past 2 years. I do short term
trades(mostly 4 or 5 months options). Initially I did very bad(thanks to Jim
Crammer's Daily Mad Money shows).
Then went to VectorVest courses. Now I am confident that am able to pick good
stocks(options) using their search startegies. That takes care of the
fundamental part of it.
But I have no knowledge about Technical Analysis.
So, I have a tough time figuring out the entry/exit points.
I heard someone say that we need to choose two contradicting Indicators(one
volume based and one price based) to get confirm signal for buy or sell.
Just wondering if anyone could tell me any two TA indicators which are good for
confirmation on buy/sell signals.
Looking for guidance from the gurus.
Thanks in advance.
-Suresh
Price and Price? ![]() Seriously
though.
Seriously
though.
~Cx
Suresh,
I'll give you five indicators, most charting software got them.
- Price
- Support
- Resistance
- Momentum (bars/candle euphoria not the indicator per se)
- Trendlines
I'm not joking either ![]()
Anek
Hi Suresh,
The journal advocates using Volume based bars, so that you can use price based
studies and indicators, and so, volume will always be a component of any chart
study you try. It makes things that much easier for those of us who cannot
concentrate on 5 things at once, and it means that you will not have to deal
with incredibly long bars, which are not good to try and figure.
If you need to see the change in volume, I believe Anek mentioned something
about keeping a very small time-based chart open in the corner of your screen
somewhere with volume bars for reference.
Jack411, I am trying to base my trades on Anek's methods. The ma and keltner channel are just filters. Not sure they help, but just reminders. For example unless I see a really good reason to sell, such as a dt, I am hesitant to do so if price is above the ma. KC just keeps me aware of where price may have a predisposition to stall or reverse in addition to s/r, & tl. Trades all based on price.
Good or Bad trade?
What is the difference between a good or a bad trade for you people?
Re: Good or Bad trade?
Quote from Piscuy:
What is the difference between a good or a bad trade for you people?
A good trade does what I expected it to, and reaches the profit potential I
originally intended and I am relaxed while this happens.
A good trade does the opposite of what I expected it to, but I recognize this
quickly and get out with a minimal loss.
A bad trade does what I expected it to, but I for whatever reason (usually get
nervous about it reversing) get out before it reaches my original profit target,
even though it eventually hits my original profit target.
A bad trade does the opposite of what I expected it to, but instead of getting
out with a very small loss (several ticks), I let it hit my stop in the hope
that it will turn around. (My stop is not large < 15 YM but usually around 10
YM, so I don't take large losses, but large enough to be annoying when hit)
A good trade is one that I've anticipated and waited for the right setup to
occur and only acted on when the market was doing what I expected it to do.
(kind of like a surfer on his board waiting for that wave he sees coming and
starts paddling getting ready to jump on it, but only acting on the right wave
at the right time) How's that for an analogy.
A bad trade would be executed out of impulse where I'm chasing trying to catch a
shooting price bar, only to jump in when it runs out of steam and head back
down. If I execute a trade that I'm not anticipating its movement and feel where
its heading and I just jump into it to chase momentum., It'll pretty much go
against me and punish me for not being a good surfer
![]()
A good trade is when I have all the necessary rules in place and price moves
in my favor.
A bad trade is when I place some rules and add some wishes, hopes, or wants in
the trade and it moves in my favor... I have no way of evaluating the success,
or even learning from it.
There are many more types(losing type trades etc.), but this is a current issue
for me.
Quote from booyah:
A good trade is one that I've anticipated and waited for the right setup to occur and only acted on when the market was doing what I expected it to do. (kind of like a surfer on his board waiting for that wave he sees coming and starts paddling getting ready to jump on it, but only acting on the right wave at the right time) How's that for an analogy.
A bad trade would be executed out of impulse where I'm chasing trying to catch a shooting price bar, only to jump in when it runs out of steam and head back down. If I execute a trade that I'm not anticipating its movement and feel where its heading and I just jump into it to chase momentum., It'll pretty much go against me and punish me for not being a good surfer
__________________
Edge: new trader mentality
Re: Good or Bad trade?
Quote from Piscuy:
What is the difference between a good or a bad trade for you people?
Excellent insight Piscuy. Even professional poker players lose with pocket
aces...just part of the game.
Excellent thread Ankedoten!
Hi Piscuy,
That's a great great question.
Here's what I think: a great trade for me is - I see a higher low and a higher
high on the chart, and then price goes back down and makes a higher low, and the
bar closes, and price reverses, and I check buffy's bline (stochastics 5,3,3
over a stochastics 25, 10 I think), stochastics is looking like half a parabola,
I set a limit order, price comes down, hits my price -1 tick, then price
continues it's way on up the price ladder.
After 2 points or so, price starts to struggle, and comes back down a couple
ticks, goes back up 4 ticks, comes back down 2 ticks, and I exit.
A good trade is: if I follow all that, and price started going up, but then
reversed and went down and hit my 1 point stop, or if price stalls (3 bars get
printed), and it just starts going sideways, and so I exit after a minute and a
half at 1 tick or -1 tick.
A bad trade is: I'm bored, and the market is chopping around (4 same length bars
have been printed, no discernable direction), but price is near the top of the
trend channel, so I figure, ah, what the heck! I'll just see if I can scalp down
to the bottom of the trend channel! Doesn't matter how it turns out, if I win,
it's prolly even worse.
A horrible trade is: Everything in the great trade happens, but price never
comes down and hits my entry, so I panic and start moving my entry up a tick,
and another tick, and then two ticks! But price is going! So I cancel the limit
order and enter a market order! And as soon as I am filled, price comes back
down, stops me out at -1 point (or I move my stop and it hits it for more!
worse), then hits my original entry, and continues it's way up.
I'm a newbie and I definitely have psychological issues over and above
psychological trading issues, but I recognize pretty quickly when I get into a
bad or horrible trade, and I will just try and get out with the loss. I'm a
recovering bad trade addict, and will be for the rest of my life. I look forward
to my 6 month free and clean chip. ![]()
4 trades, 2 win, 2 lose, = for day. Done for day
Quote from bmwhendrix:
4 trades, 2 win, 2 lose, = for day. Done for day
Quote from bmwhendrix:
4 trades, 2 win, 2 lose, = for day. Done for day
boredom? I played golf this morning, then met frends for lunch. Now I am
staring at the screen and risk getting into a marginal trade. No trades today. I
did sell out a bond position this morning before golf.
![]()
Oh yes, the sideways channel trend. Not conducive for our type of trading.
Just sitting on the sidelines most of today getting ready for Vols vs Gators
game tomorrow ![]()
Hi,
Net Loss -$212, on NQ....traded well IMHO, just no follow through, did too add
trades that if trend would have continued would have given me a nice winning day
but wasn't meant to be and one ended up a small loser and other b/e after both
trades were up roughly +4 points each on the first entry before the add. I can
live with this because just been a couple of odd days IMHO. Monday is another
day.
No equity trades.
Good weekend all.
Cheers ![]()
Quote from Razor:
Hi,
Net Loss -$212, on NQ....traded well IMHO, just no follow through, did too add trades that if trend would have continued would have given me a nice winning day but wasn't meant to be and one ended up a small loser and other b/e after both trades were up roughly +4 points each on the first entry before the add. I can live with this because just been a couple of odd days IMHO. Monday is another day.
No equity trades.
Good weekend all.
Cheers
Some fun scalps on the NQ based on price action during brutally low volume.
Momentum called my targets.
Of course, compared to some of the AH plays I'm used to, it was chaotic.
![]()
Did not have time to trade the morning which was vastly superior in nature.
Either way, should serve as simple illustration.
Anek
Closed the last long...
Anek
Anek,
We've seen you trade the YM, then switch to the ES, and now the NQ. Would you be
able to share the pros and cons of trading each?
Low,
I will, need one more week with the NQ still.
Anek
As an exercise, please study my afternoon scalps and explain the entry and
exit, play by play.
Share with the readers for discussion.
Thank you
Anek
2 things I dont understand about your scalps...
2 things I dont understand about your scalps...
Thanks for commenting and thanks for the thread.
Re: 2 things I dont understand about your scalps...
Quote from Marvin Zark:
2 things I dont understand about your scalps...
Thanks for commenting and thanks for the thread.
Marvin,
All valid questions.
Let's clear something up, not every play I take is AHG related, although 90% of
the time I make an effort to trade with the immediate trend but particularly in
micro-scalping I go nuts, up and down.
With that out of the way.....
Your 1st question
I don't see a bar closing above previous highs, no bright green.
You want to look for strength during a retracement when the trend is long as
that is usually considered a good sign, not the case here. It was however on the
other longs.
Your 2nd question
No signs of strength, no bright greens to be found.
Trendline break.
Mini head and shoulders, neck broken.
Last swing high was a lower high.
Bars closing below previous lows, bright red.
Lots of reasons.
Also don't forget I use the tape to fortify the plays but in these cases ,it was
not necessary.
Anek
Re: Re: 2 things I dont understand about your scalps...
Quote from low_hcp_golfer:
Marvin,
I think the TL break signaled a change in direction leading to the short setup. It looks like Anek then waited for the low to break for confirmation of the direction change.
Hi Guys,
Does anyone here know if there's a way to code the bars the same way in QT
(quotetracker) as Anek does in Tradestation. Dark,bright green, Dark,bright red
Please advise.
Thanks, have a great weekend.
Heading out to down a few bottle of wines with my old man.
When I come back, I expect an explanation for every circle on the chart.
Come on people, I'm getting hate mail for explaining so called "trading
secrets", no joke ![]() , make it worth
it
, make it worth
it ![]()
Anek
Thanks for your replies.
Regarding the first question and your answer Anek: by waiting for the candle to
close above before taking the trade, dont you risk either missing the trade when
it goes far away before the candle close or even chasing it if you enter and
being too far from your logical stop (the low of the swing low in this case)?
I am sorry, I have the feeling that my English syntax is not quite correct here:
hope this is understandable.
Thanks indeed.
Marvin,
Price already retraced, so that's in your favor, you are just giving up a few
ticks for CONFIRMATION which is premium in this game.
Can't have it all my friend ![]()
Anek
Quote from Anekdoten:
As an exercise, please study my afternoon scalps and explain the entry and exit, play by play.
Share with the readers for discussion.
Thank you
Anek
I edited previous post.
First we must agree on what the trades are!
![]()
The first green circle I read as a buy, followed by a red circle = sell to exit,
(not a new short)
Next trade is a green circle = new buy, followed by red circle = exit.
Another green circle buy/red circle exit.
Next red circle is a short sale, followed by green buy to exit trade. Last green
circle is a buy to initiate a trade, and the red circle exit is on another
chart.
So, in summary, I see 5 trades, 4 longs, and one short.
OK, if I got that right, now we can proceed to analyze the trades.
Ah!
I thought those were all entries.
I guess I was just following the pattern of Anek's previous charting.
![]()
![]()
![]()
A. My take on your trades. Heading out for a few myself. Mingle with the
local riff-raff, traders and other neer-do-wells.
![]()
Re: Re: Re: stops
Quote from DblArrow:
Been enjoying this thread.
The ideas here are very similar to what I have been doing for quite some time.
I have found the above to be the main reason that I have been able get to the next level in my trading. For the longest time I was one contract only and missed all the good runs and took to many small wins and to many small and big losses, HOPING, for the turn around and home runs. Fairly typical I would say.
I figured my entries were fairly decent as I would generally have some profit potential, but after making $15 to $30 I would try for more then loose ($125). Not very conducive to continued trading.
I went to a cheaper margined contract and traded in multiples 2 to start and then to 3,4,6 etc. and in the words of Robert Frost "It has made all the difference".
If you cannot move to another contract and try this then try to supplement your account so that you can scale.
You will be amazed.
Make 'em pretty, Chris
Following the logic of Anek's trades, here is my illustrated homework
Rn,
I like your analysis, your reasoning is better than my trading, even if it's
based on my own teachings. ![]()
Great job.
To clear any doubts, 5 trades total between the two chart but Rn gets a star,
the guy nailed them all.
Anek
Reasons for the entries seem obvious enough. Just alot of fine line small
scalps based on price action ![]() .
.
~Cx
P.S. Nice chart Rn86.
Quote from booyah:
Hi Guys,
Does anyone here know if there's a way to code the bars the same way in QT (quotetracker) as Anek does in Tradestation. Dark,bright green, Dark,bright red
Please advise.
Thanks, have a great weekend.
Tech,
Thanks for playing ![]()
Your analysis is appreciated as well, helps those struggling see different
perspectives.
One thing though....
Except for the high probability short, that had more confirmations than Vista
(pun intended), most of your shorts were my exits.
Remember, it pays to only trade with the trend. However, if you see something
too juicy too pass, a quick scalp against the trend with minimal risk is never a
sin just make sure multiple confirmations are there.
Anek
Seems that a few people finished the exercise before I did. Thanks for the analysis. This continues to be a fantastic thread.
Thanks AAA30 I appreciate it.
Do you have your screen set up the same way ?
Thanks, Have a great weekend everyone.
Quote from AAA30:
This is some what similar to what I see on the last chart. It may be wrong.
Charts/Paintbar Editor/ Add new
(rule 1)
if Bar Open < Bar Close set color to Green
(rule 2)
if (Bar Open < Bar Close) and (Bar Close > Bar High[1]) set color to Lime
(rule 3)
if Bar Open > Bar Close set color to Maroon
(rule 4)
if (Bar Open > Bar Close) and (Bar Close < Bar Low[1]) set color to Red
(rule 5)
if Bar Open=Bar Close set color to White
save and apply to chart with the paintbar indicator
Ps. If you use bright red and green for your standard bar colors rules 2 and 4 can be omited.
AAA30
Re: Re: Re: Re: stops
Pax,
I scale out many times, but I don't like to.
I prefer the all in all out approach.
In fact, and you prob know this, I love the gradual-in all out approach.
ie
-Double Bottom with the trend
First position in right at support
-Middle swing gets taken by a closing bar
Second "limit" position in
-Flexible Trendline
Third and subsequent on trendline support bounces
-Trendline breaks
All positions out
Anek
A Call for Help
If you are an experienced trader, please read.
I started this thread to help struggling traders first and foremost but also to
discuss my passion and take my journal online while interacting with fellow
traders.
Well, the amazing has happened. I'm getting constant hate mail from "anonymous"
traders via PM. Complaints after complaints for revealing working techniques.
First of all, this is no magic, and in the end it's down to the trader to get it
right therefore I'm not sure what's up these people butts but I ignore each
everyone of these hate mails.
My call is simple, time to fight back.
Giving is more powerful than receiving, I truly believe that, peace of mind is
priceless, I've been on both ends of the spectrum and there is nothing more
gratifying than a sincere smile of appreciation.
I encourage experienced traders to chip in, let's end this selfish approach to
trading once and for all.
No reason to stop there, apply it outside of trading, pay it forward however you
like.
We only live once, let's do it right.
Anek
Quote from Anekdoten:
Tech,
Thanks for playing
Your analysis is appreciated as well, helps those struggling see different perspectives.
Remember, it pays to only trade with the trend.
Anek
Quote from Techdoodle:
Hehe, thanks.
For some reason I was out of the box. I had some idea you were doing more advance or just different styles when I saw you shorts.
You stayed on topic, but I thought you veered away.
My bad. Quite humbling too.
-Tech
[QUOTE]Quote from anekdoten:
[b]A Call for Help
If you are an experienced trader, please read.
I started this thread to help struggling traders first and foremost but also to
discuss my passion and take my journal online while interacting with fellow
traders.
Anekdote,
As you can see this is my 1st post.![]() I am as new to trading as you can get. I am very interested in what is said by
you and the many others that have contributed to this thread. Please don't stop
I am as new to trading as you can get. I am very interested in what is said by
you and the many others that have contributed to this thread. Please don't stop![]()
I have read the complete thread twice and I must admit I only understand about
25% of what is said. I continue to look back read again look at charts ect....
Your last chart today with the (homework assignment) I am starting to see the
plays.... not nearly enough to comment. The more you all comment, the more
charts are posted, the more I learn. I can not begin to tell you all how
greatful I am that you take time out of your day to post these comments.
Please keep it up.
One more thing I really impressed with how polite and reasonable everyone is in
this thread, no axes to grind or egos to bruise. I have ready a few other
threads and websites but this one suites me. Great folks who seem to care about
one another and want to help each other. I hope one day I will be able to do the
same.
Tks,
__________________
Jerry
J,
There are no stupid questions, so anything that does not seem clear, just fire
away.
There's always the possibility that I'm the stupid one for not explaining it
right ![]()
Anek
Quote from Anekdoten:
A Call for Help
If you are an experienced trader, please read.
I started this thread to help struggling traders first and foremost but also to discuss my passion and take my journal online while interacting with fellow traders.
Well, the amazing has happened. I'm getting constant hate mail from "anonymous" traders via PM. Complaints after complaints for revealing working techniques.
First of all, this is no magic, and in the end it's down to the trader to get it right therefore I'm not sure what's up these people butts but I ignore each everyone of these hate mails.
My call is simple, time to fight back.
Giving is more powerful than receiving, I truly believe that, peace of mind is priceless, I've been on both ends of the spectrum and there is nothing more gratifying than a sincere smile of appreciation.
I encourage experienced traders to chip in, let's end this selfish approach to trading once and for all.
No reason to stop there, apply it outside of trading, pay it forward however you like.
We only live once, let's do it right.
Anek
Good commemts Jerry, I agree
GS19
Anek, it's hard to believe (I'm not doubting you, I just am kind of shaking
my head in disbelief) that anyone is seriously sending you PMs deriding you for
helping others.... and giving away "trade secrets"
Did traders give Richard Dennis grief for training his turtles?
![]() You are going to have a bunch
of AHG'ers running around soon - actually, you already do. My only complaint is
that "AHG" is too close to "ARGH" which is the noise I make after most of my
trades.
You are going to have a bunch
of AHG'ers running around soon - actually, you already do. My only complaint is
that "AHG" is too close to "ARGH" which is the noise I make after most of my
trades. ![]()
Quote from Jaxon:
Anek, it's hard to believe (I'm not doubting you, I just am kind of shaking my head in disbelief) that anyone is seriously sending you PMs deriding you for helping others.... and giving away "trade secrets"
Did traders give Richard Dennis grief for training his turtles?
Re: Re: Re: Re: Re: stops
Quote from Anekdoten:
Pax,
I scale out many times, but I don't like to.
I prefer the all in all out approach.
In fact, and you prob know this, I love the gradual-in all out approach.
ie
-Double Bottom with the trend
First position in right at support
-Middle swing gets taken by a closing bar
Second "limit" position in
-Flexible Trendline
Third and subsequent on trendline support bounces
-Trendline breaks
All positions out
Anek
Thanks for the star Anek, it means a lot to me
![]()
Well, I think YM is not covered in this excellent educational thread. So, I will
try to post pretty simple trade setups on a daily basis for critique and
suggestions. The methodology based only on price action and support/resistance.
Symbol: YM #F
Constant Volume: 300
Time: EST, 24 Hour chart
Re: Re: Re: Re: Re: Re: stops
Quote from jimmygold:
Anek, that double bottom with the Trend, does that mean you play by going Long in a successful double bottom in a HH, HL uptrend ? Or are you inferring that you play by going short in a failed double bottom in a LH, LL downtrend ?? Or do you do both types of trading ??
thnx
The
Quote from Anekdoten:
A Call for Help
If you are an experienced trader, please read.
Well, the amazing has happened. I'm getting constant hate mail from "anonymous" traders via PM. Complaints after complaints for revealing working techniques. ...... but I ignore each everyone of these hate mails.
__________________
Suspend all beliefs and opinions; just trade the windsock.
Quote from Rn86:
Thanks for the star Anek, it means a lot to me
Well, I think YM is not covered in this excellent educational thread. So, I will try to post pretty simple trade setups on a daily basis for critique and suggestions. The methodology based only on price action and support/resistance.
Symbol: YM #F
Constant Volume: 300
Time: EST, 24 Hour chart
Ave,
Thank you.
If you got access to a printer, print a detailed layout of an intraday chart you
are familiar with and study it in micro detail as you lay in bed or sit in a
waiting room, etc.
In time high probability setups with small risk will start becoming more obvious
than you can imagine.
Anek
Quote from Anekdoten:
Ave,
Thank you.
If you got access to a printer, print a detailed layout of an intraday chart you are familiar with and study it in micro detail as you lay in bed or sit in a waiting room, etc.
In time high probability setups with small risk will start becoming more obvious than you can imagine.
Anek
__________________
Suspend all beliefs and opinions; just trade the windsock.
I will play. Attached is my understanding of your play.
My marks are in yellow.
Freewilly
P.S.,
Just read to RN's post. He explains it well.
A. I hate to see too many compliments to you here, you may get a big head and
become an elitist, but I don't think I sense that is in you. I suspect the folks
that are PMing you with negative comments, are folks who are themselves
struggling, perhaps making some headwayj, but are not confident enough in their
abilities or methods to understand that even though you might be offering
information without secondary motives, there are realistically only a small
percentage of readers who will have the ability, disicpline, fortitude and
wherewithall, to utilize that information to make themselves successful.
Therefore, you pose them no real threat. Ignore these miscreants. What I said is
true, only a few of the followers of this journal will be able to incorporate
what you have simply stated into their trading, for a variety of reasons. But
the fact that you have offered, says a great deal about you.
D.
Free,
If I'm scalping, and scalping is when I use my heaviest starting positions due
to lower risk(small stop), when price is approaching the next barrier, say
support if short or resistance if long, if I see the low of the last two bars
taken out, I don't think twice about it and exit with my profits. Sometimes even
just the low of the last bar if the prev bar is long enough or if I see momentum
dying.
...and onward to the next play.
Anek
bmw,
It's cool, I'm only conceited when it comes to the ladies and I'm married so
that era is history ![]()
...and I sincerely hope you are wrong, hope more than a few truly make it from
the teachings and examples of the journal.
It's really not that hard, but just like in sports, you must practice and stay
in shape.
Anek
Quote from bmwhendrix:
A. I hate to see too many compliments to you here, you may get a big head and become an elitist, but I don't think I sense that is in you. I suspect the folks that are PMing you with negative comments, are folks who are themselves struggling, perhaps making some headwayj, but are not confident enough in their abilities or methods to understand that even though you might be offering information without secondary motives, there are realistically only a small percentage of readers who will have the ability, disicpline, fortitude and wherewithall, to utilize that information to make themselves successful. Therefore, you pose them no real threat. Ignore these miscreants. What I said is true, only a few of the followers of this journal will be able to incorporate what you have simply stated into their trading, for a variety of reasons. But the fact that you have offered, says a great deal about you.
D.
Re: Re: Re: Re: stops
Quote from PaxMax:
I was just reading the posts of the last few days.
I totally agree with you, Chris.
The problem with me is that I'm not really psychologically suited for trading.
I don't let winners run. The first red bar scares me out of the trade. I'm not patient enough, and I hate to see a nice profit schrink.
Because of all that, when I try to let winners run, I usually get out at the next logical entry for a trend. The profit is minimal there ..
The only thing I'm pretty good in is finding entries.
So yesterday and today, after coming back from work (12:00 - 16:00 pm New York time), I was experimenting with another setup:
Stop: 1.25 point
Target: 1 point.
ES lots traded: 4
I had 4 trades today, and gained 600$ (minus the 32 commisions of course)
As a matter of fact, finding entries is the only thing I really like about trading.
This style would also allow me to trade the american markets after work. I can't be in the market all day.
My plan for the near future is: scaling out 2 contracts after 1 point, and keeping the other 2 a little longer (let's say: previous high for a long entry).
One thing I need to learn as well: estimating a realistic target for known patterns.
This evening the ES made a nice 'V' shape. I was long at 1481 right after forming the bottom. Sold at 1482...
When looking back at the charts, I often find my entries strategic, and wel placed, but when it comes to realistic exits ... poor PaxMax.
I have read an article on the net, recently about scaling out. Apparently, accounts that use a scale out strategy, suffer less from drawdowns. FWIW, don't want to start a discussion here.
Have a nice weekend, all!
PM
Quote from ave331:
Just a show of support on my part. Wouldn't call myself an "experienced trader" ... yet, although my handle was registered only recently, my years of lurking in ET as an unregistered user since the first days of "the Big Cheese's skirt-trades" might qualify me as sort of 'experienced' enough, by some stretch of the imagination hehe, to comment
Anek, you're doing a fantastic job showing there's no voodoo involved in successful trading ... let's presume voodoo sellers feel their business is threatened ... that's right, just ignoring them will do.
Your generosity with your methods have trimmed off superfluous indicator considerations from my trading screen, although some are retained but used with a fresh perspective. My sincere thanks to you. Would really love to contrbute, if only I could qualify enough or come across something relevant to share.
Best regards
~ave
Anek, when you take a double bottom play (close above the high), do you use a break of the double bottom as your stop. Also, when taking a break of a symetrical triangle, what do you use for your stop, is it the other side of the triangle?
Anek,
This journal is a keeper. Agrees with mostly what I have built my system on.
Wish you and your friends here nothing but success. I will not comment on trades
or charts. I have nothing better. Actually, our stuff is too similar so I will
stay out. I will observe and enjoy. Thanks again for the journal. Finally one
that is serious and helpful. Have a most wonderful life....george
Quote from billydakid:
Anek, when you take a double bottom play (close above the high), do you use a break of the double bottom as your stop. Also, when taking a break of a symetrical triangle, what do you use for your stop, is it the other side of the triangle?
I take stouts as payment, better if accompanied by a trader friend
![]()
Sample of price action for a random NQ day, should help for stop placement
logistics.
Anek
PS: Did it very very quickly so pardon any mistakes.
Question:
Rn, what is the vertical lines/histogram at the bottom of the chart?
Its a simple volume. Why would I use a volume on a constant volume chart? - it
helps me recognize a stage of completion of a bar.
Anek, I have said it multiple times before and I'll say it again. This thread
is gold. This thread is priceless in its value toward good people that really
strive and want to have a successful trading career. Aside from the basis of the
thread on how to trade profitably using price action, you have been a class act
the whole way through even when a few naysayers came in and caused a fuss. I
hope this thread continues the way it has and that those of you like myself who
are trying to get quality people and be profitable in this business really do
become successful like Anek has done through hard work. Here's to successful
trading with what really works!
~Cx
P.S. I have had alot of good beers and drinks in my life, but I have never had a
Stout. Maybe one day we'll sit and have one. With what you've taught me thus
far, you deserve a few rounds ![]() .
.
It may look complicated but its really just LH->LL-> LH ->... (1-2-3) and
resistance/support flip trades with little bit better RRR than usual breakout.
Symbol: YM #F
Constant Volume: 300
Time: EST, 24 Hour chart, Sep 14
Using trend lines and Dynamic Sup/Res can really simplify your life
![]()
Hey Anek,
Brilliant work and interview by the way.
Don't listen to any of the turds that are sending you hate mail. I think the
"precious" 5% of succesful traders are afraid that they're "precious" community
might grow to 6%. In any case a person that's controlled by "greed and fear" in
their life away from the trade desk is just brain fucked and you know what ?
This strategy AHG that is, must be a great one. If those guys are really pooping
their diapers to know the info is getting out. That means you're telling us
something that is legit.
Anek is indeed the new Richard Dennis.
and we are his AHG turtles.
(P.S. please dont let all the lip marks on your buttocks make you an elitist)
New homework, stops and exits.
Attached please find a random NQ chart.
It was fairly easy to mark the entries as it was a strong downtrend, so I took
care of those. In my experience, when the indexes are displaying a strong
downtrend, amateur traders tend to shy away and simply become paralyzed. I want
to help you exploit such wonderful days instead of just standing still and
looking in awe.
The exercise is to mark the stops and the exits on all entries and give
logical explanations for each, no exception.
Assume no intraday swings and no averaging ups, strictly in and out protecting
capital and milking the market.
Should be interesting and a good exercise for those participating.
Important, please post your analysis no earlier than midnight EST tonight.
Thanks and let's have some price action fun!
Anek
PS: IMPORTANT NOTE: Remember that your fill is somewhere on the bar
following the entry as we value close more than open/high or low, no cheating.
Rn,
Thank you for collaborating, all appreciated.
Anek
Booyah,
It's all good, the more hate mail the more I will help.
Thanks, it was mostly Duref, the old geekster makes a good interviewer
![]()
Anek
B,
After midnight man, delete it til then, hurry, cheaters are coming in!
Anek
Important, please post your analysis no earlier than midnight EST tonight.
![]()
![]()
Anek
Whoops! Thought it was before midnight. Damn beer...
Where is that delete button......?
Quote from Anekdoten:
Important, please post your analysis no earlier than midnight EST tonight.

Anek
Techdoodly, How did you delete your post? I have not deleted one before?
click the edit/delete on your post.
check the delete on the upper left and press the delete button on the upper
right.
That's how I did it.
I'm always early........just ask my wife.
I took another random chart and produced a brain salad surgery on price
action.
It's got more info than you can possibly digest for a single chart but it would
help if you make an effort to follow the logic.
I'm doing AHG at an extremely micro level.
When I used to trade in public channels people used to ask me, how do you trade
with such small stops, how do you do it, well this is it, no magic.
Small losses, small wins and the occasional monster play and your confidence
goes from 0 to 60 in 2 seconds.
Hope it helps.
Anek
Quote from bmwhendrix:
I'm always early........just ask my wife.
Confidence
Believing is your system and methodology is extremely important in trading.
Having the discipline, to accept the fact, that when we are wrong the OPTIMAL
scenario is the quick stop, no questions asked.
In an effort to build your confidence here is a chart of nothing but losses.
Any real harm done ?
Anek
Faith
You did not really think we could not profit from such a chart right ?
Winners make the losers look like ants.
Anek
ok trade?
B,
Good job, answer can be found on "faith".
On a side note, the reason why I included it the long on "Confidence" is because
there is a strong possibility I might have taken a quick long scalp there as a
mistake.
The reasoning behind it is that a small mistake can't kill us, with discipline
and confidence in price action, we are untouchable.
Anek
AHG on stocks?
Hi Anek,
I'm a daytrader at a Prop firm. My startegy is mostly to look for reversal or
momentum patterns with avging down until a break of support or resistance but
after reading your journal i am thinking i would very much want to improve my
risk/reward profile by avging up instead!
I usually play high volume below $10 stocks. I am curious since you've
apparently traded stocks before, did you use AHG or some variant of it then? Do
you have some suggestions as to what type (price, volume, med term trending
up/down, ?? ) of stocks to trade?
I was looking for opportunities to possibly use AHG but i dont get see many
opportunties as in the super high volume futures examples you provide.
Thanks in advance and I appreciate your incredibe giving attitude!! Glad you're
back!
ps. I see you've suggested the "Trading Chart Patterns like a Pro" by Suri
Duddella as being superior to Bulkowski's work. Is that opinion based on
Bulkowski's Chart Patterns 2nd edition (2005) though ?
I've had to do a rethink of stops lately. As a beginner years ago, I would sometimes increase my stop in an attempt to let the market have time to see the wisdom of my entry. Got over that. Then reached a stage of letting stop sit till trade went right or hit it. Now, tend to exit trade early if anything just does not look right. Idea being, as you have stated that most good trades are good from the beginning, and I can always reenter a trade if the setup firms up. At least I have my money in my pocket and another trade just around the corner. I suspect this must be a common progression for many traders. FWIW.
Re: AHG on stocks?
I,
I suppose the first question I should ask you is how are you doing with your
current system/methodology ?
When I traded equities I slowly drifted into SPY/QQQQ and then finally futures.
Yes, Suri's book is exceptional, can go wrong.
Anek
Quote from iluv2trade:
Hi Anek,
I'm a daytrader at a Prop firm. My startegy is mostly to look for reversal or momentum patterns with avging down until a break of support or resistance but after reading your journal i am thinking i would very much want to improve my risk/reward profile by avging up instead!
I usually play high volume below $10 stocks. I am curious since you've apparently traded stocks before, did you use AHG or some variant of it then? Do you have some suggestions as to what type (price, volume, med term trending up/down, ?? ) of stocks to trade?
I was looking for opportunities to possibly use AHG but i dont get see many opportunties as in the super high volume futures examples you provide.
Thanks in advance and I appreciate your incredibe giving attitude!! Glad you're back!
ps. I see you've suggested the "Trading Chart Patterns like a Pro" by Suri Duddella as being superior to Bulkowski's work. Is that opinion based on Bulkowski's Chart Patterns 2nd edition (2005) though ?
Quote from bmwhendrix:
I've had to do a rethink of stops lately. As a beginner years ago, I would sometimes increase my stop in an attempt to let the market have time to see the wisdom of my entry. Got over that. Then reached a stage of letting stop sit till trade went right or hit it. Now, tend to exit trade early if anything just does not look right. Idea being, as you have stated that most good trades are good from the beginning, and I can always reenter a trade if the setup firms up. At least I have my money in my pocket and another trade just around the corner. I suspect this must be a common progression for many traders. FWIW.
Anek,
I can really see how those painted bars can clear things up. Good job. I'd like
to figure out how to do that in Quote Tracker.
Seems that your tight stops are mostly based on previous bar. Yes -- confidence
indeed. But I'm starting to understand your confidence. If going short, and you
don't see bright green bars that often, that's a good sign for that tight stop.
Am I far off?
-Tech
Re: Re: AHG on stocks?
Quote from Anekdoten:
I,
I suppose the first question I should ask you is how are you doing with your current system/methodology ?
When I traded equities I slowly drifted into SPY/QQQQ and then finally futures.
Yes, Suri's book is exceptional, can go wrong.
Anek
Tech,
It really depends on the type of play.
When scalping, the stop now must not be the same as it was 1 sec ago but based
on what's happening with price right at that precise moment.
All stops must be strategic and trailed accordingly.
Preservation of capital while allowing the play to fulfill itself is the path to
glory.
I rarely sell or cover, I'm usually stopped out.
Anek
Quote from Techdoodle:
Anek,
I can really see how those painted bars can clear things up. Good job. I'd like to figure out how to do that in Quote Tracker.
Seems that your tight stops are mostly based on previous bar. Yes -- confidence indeed. But I'm starting to understand your confidence. If going short, and you don't see bright green bars that often, that's a good sign for that tight stop.
Am I far off?
-Tech
Anek,
That price.action.pasta chart is gold.
Did you make it up afterwards or it is real trading record?
ne of my problem is the chart looks crystal clear with hindsight, but with real
time, I am more often got confused.
Thanks,
freewilly
Quote from Anekdoten:
I rarely sell or cover, I'm usually stopped out.
Anek
Quote from freewilly:
Anek,
That price.action.pasta chart is gold.
Did you make it up afterwards or it is real trading record?
ne of my problem is the chart looks crystal clear with hindsight, but with real time, I am more often got confused.
Thanks,
freewilly
Quote from low_hcp_golfer:
Stops to get out and stops to get in...it just becomes a game of trailing your stops.
Quote from low_hcp_golfer:
Stops to get out and stops to get in...it just becomes a game of trailing your stops.
Quote from Piscuy:
If I could give you some advice and if your using your indicators as well, focus on price and use indicators as reference. In time you will get rid of the indicators overall. This is a business of trusting yourself and your system. When you get to trust yourself and your system you will take the trades and play your odds. Hopefully in time you will see the value of price action and the probabilities it gives you, till then use the indicators as reference but always trade price action.
Good Trading to all
__________________
Suspend all beliefs and opinions; just trade the windsock.
Quote from Techdoodle:
Anek,
I can really see how those painted bars can clear things up. Good job. I'd like to figure out how to do that in Quote Tracker.
-Tech
__________________
Lets all drink to the death of a clown.
Anek,
Care to commend on my chart.
I don't have NQ, this is QQQQ on 09/14, it should be close to NQ.
It is 1 minute HA candle chart. time based.
Thanks,
freewilly
Re: Re: Re: AHG on stocks?
Quote from iluv2trade:
I am doing well with my methodology however it's not a very comfortable one for me risk wise as I try to scale up my trading.
As is probably obvious from using an avging down strategy I do sustain occasionally decent sized losses up to 2x my average positive days. I'd prefer to move in a different direction that is more tailored to my risk aversion psychology.
Being part of a Prop firm, I use the firm's money so it's a low risk endeavor for me. Since I can only trade stocks there - no futures - and i do enjoy the diversity of the action, I was hoping you'd have suggestions on how to target stocks using AHG or some variant thereof.
I suppose I can certainly trade the Q's or SPY as you have in the past though I was hoping you might have insights on an approach that could target a larger variety of stocks.
Thanks!
Anek, any value in drawing previous days OHLC on one's chart?
And, if so, should I use Close or Settle price?
Thanks!
Ian
__________________
too soon old, too late smart
Quote from freewilly:
Anek,
Care to commend on my chart.
I don't have NQ, this is QQQQ on 09/14, it should be close to NQ.
It is 1 minute HA candle chart. time based.
Thanks,
freewilly
Re: Re: Re: Re: AHG on stocks?
I,
It has been a very long time since I did equities so I'm not sure what to
suggest at this time.
Yes, definitely look for high volume, nasdaq based (4 letter ticket name) and
look for volatility and trendiness as a whole.
As far as averaging up, yes I recommend it head and shoulders above what you are
doing right now but you must realize not all days are optimal for it.
Averaging up is ideal for those kinds of day where the trend is just mighty
strong.
I can't insult you enough for averaging down but I won't because with this line
alone I feel I have. ![]()
Anek
Quote from IanMacQuaide:
Anek, any value in drawing previous days OHLC on one's chart?
And, if so, should I use Close or Settle price?
Thanks!
Ian
Quote from babe714:
Read page 248 of this journal , AAA30's post shows how to accomplish this . It works , thanks AAA30
Tech,
I believe A30's translation to be perfect.
Anek
Quote from Anekdoten:
Tech,
I believe A30's translation to be perfect.
Anek
Quote from Anekdoten:
New homework, stops and exits.
Tech,
Perfect analysis, the part you do not understand is me referring to a double
bottom (against the trend) whose middle high swing was never taken by a closing
bar.
Good stuff.
Question, so why can't you trade like this ? What prevents you from doing that?
Anek
Anekdoten, enjoying the thread thank you for sharing.
For the QT paintbar I posted your readers might want to change the{if Bar Open =
Bar Close set color to white.} rule to
if ABS(Bar Open - Bar Close) <= 0.25 set color to white. Where the 0.25 is what
would be a neutral body size. The original rule will only show doji's.
AAA30
Quote from AAA30:
Anekdoten, enjoying the thread thank you for sharing.
For the QT paintbar I posted your readers might want to change the{if Bar Open = Bar Close set color to white.} rule to
if ABS(Bar Open - Bar Close) <= 0.25 set color to white. Where the 0.25 is what would be a neutral body size. The original rule will only show doji's.
AAA30
Every trader must have his "Holy Grail Chair" for consistent profitability.
Male version attached.
![]()
Anek
Re: AHG on stocks?
Quote from Anekdoten:
I,
It has been a very long time since I did equities so I'm not sure what to suggest at this time.
Yes, definitely look for high volume, nasdaq based (4 letter ticket name) and look for volatility and trendiness as a whole.
As far as averaging up, yes I recommend it head and shoulders above what you are doing right now but you must realize not all days are optimal for it.
Averaging up is ideal for those kinds of day where the trend is just mighty strong.
I can't insult you enough for averaging down but I won't because with this line alone I feel I have.
Anek
Re: Re: AHG on stocks?
I,
I've talked a lot about averaging up in the journal. Feel free to browse the
thread, perhaps with a search, you might find some comments useful.
The bottomline line is the psychological hit of having a small winner becoming a
break even or a small loser time after time, that's the hardest barrier to
break.
Five years without a losing month?
I should be taking advice from you! Start posting
![]()
Anek
Re: Re: Re: AHG on stocks?
Quote from Anekdoten:
I,
I've talked a lot about averaging up in the journal. Feel free to browse the thread, perhaps with a search, you might find some comments useful.
The bottomline line is the psychological hit of having a small winner becoming a break even or a small loser, that's the hardest barrier to break.
Five years ?
I should be taking advice from you! Start posting
Anek
Quote from brotherben:
Anek,
This journal is a keeper. Agrees with mostly what I have built my system on. Wish you and your friends here nothing but success. I will not comment on trades or charts. I have nothing better. Actually, our stuff is too similar so I will stay out. I will observe and enjoy. Thanks again for the journal. Finally one that is serious and helpful. Have a most wonderful life....george
Re: Re: Re: Re: AHG on stocks?
Quote from iluv2trade:
lol, u dont want my posts!! what i know about is totally opposite in method to what u preach
My one and only (useful) advice to your novice students would be to work on your discipline - toooo many traders have gone belly up due to lack of discipline. Never, ever trade bigger unless you're fully in control of your psychology and are adequately funded!! Inadequate funding (translates to an insufficient daily stop loss for me) will strain your discipline. If you've read the journal, you'd see how normal people break down in the trenches when real money is involved (eg. Razor - though kudos to his recent improvements!!)
Quote from Anekdoten:
Every trader must have his "Holy Grail Chair" for consistent profitability.
Male version attached.
Anek
__________________
Suspend all beliefs and opinions; just trade the windsock.
Quote from ave331:
Anek, many thanks!
Now, may we have a peep at the female version?
Re: Re: Re: AHG on stocks?
Quote from Anekdoten:
I,
I've talked a lot about averaging up in the journal. Feel free to browse the thread, perhaps with a search, you might find some comments useful.
The bottomline line is the psychological hit of having a small winner becoming a break even or a small loser time after time, that's the hardest barrier to break.
Five years without a losing month?
I should be taking advice from you! Start posting
Anek
Quote from Anekdoten:
Ave,
Sadly I don't have an illustration for the female version.
However, I do have one for the upcoming FOMC announcement
Anek
__________________
Suspend all beliefs and opinions; just trade the windsock.
Re: Re: Re: Re: Re: AHG on stocks?
Quote from Anekdoten:
Ya you strike me as a contrarian looking for good risk vs rewards. Since contrarians rarely nail the entry from the start you feel inclined to use limited use of averaging down techniques to make up for the lack of accuracy in the entries.
Am I far off ?
Yes, Razor has shown good progress, little more price action polish and he could be on the way to dreamland.
I also like how Tech's logic works.
Anek
Quote from Rn86:
Thanks for the star Anek, it means a lot to me
Well, I think YM is not covered in this excellent educational thread. So, I will try to post pretty simple trade setups on a daily basis for critique and suggestions. The methodology based only on price action and support/resistance.
Symbol: YM #F
Constant Volume: 300
Time: EST, 24 Hour chart
__________________
Lets all drink to the death of a clown.
Quote from babe714:
Thanks for posting your analysis Rn86 . Looking over your charts I notice in the case of a trend change you will take an entry ( i.e. long ) after just 1 HH and 1 HL has occurred . This gets you in a trend early but I believe for AHG style trades discussed here trend change requires (i.e. long) 2 HL and 2 HH . Or am I completely missing this basic concept , Anek ,anyone ?
Chart attached shows trade from friday ES explaining what I mean .
If I may ask the group, what types of orders do use to enter your trades?
Market? Limit? Stop Limit?
I use a Stop Limit order to enter a majority of my trades and then a regular
trailing Stop for exits.
Would like to hear how the rest of you guys handle your entries.
lhg
Quote from Anekdoten:
Tech,
Perfect analysis, the part you do not understand is me referring to a double bottom (against the trend) whose middle high swing was never taken by a closing bar.
Good stuff.
Question, so why can't you trade like this ? What prevents you from doing that?
Anek
Quote from low_hcp_golfer:
If I may ask the group, what types of orders do use to enter your trades? Market? Limit? Stop Limit?
I use a Stop Limit order to enter a majority of my trades and then a regular trailing Stop for exits.
Would like to hear how the rest of you guys handle your entries.
lhg
Tech,
Perhaps it's time to dissect what's worth noting and what is distraction.
Your analysis is evidence that you have in you from a logical standpoint.
Don't be afraid to make mistakes, if you stick to the rules they are small
losses anyway, call it tuition.
In time the market will stop fooling you on the same traps if you respect the
learning process.
Funny enough, the best trading book ever written is your very own personal
journal. Make sure you have one, if you don't start today.
Anek
Quote from Techdoodle:
I see too much. I need to learn to filter the info I see. Believe me, you have spring-boarded me into a new level. Those paint bars are gold because I can see how they can be used for good eye-scanning analysis for different markets when trying to find the ideal candle resolution. Or, I'm assuming this is one if its strong points.
Right now I need to get a better eye on those hh/hl and ll/lh, D tops, D bottoms and s/r areas.
I think you are really good with your clarity, and I solute you for giving away your hard earned works.
-Tech
Preparing for the unexpected
The best trader has no bias.
He or she goes long or short without a single ounce of bias and his decision is
100% based on price action not on fundamentals, economic news or what Joe Guru X
said the night before.
Today I want to talk about the unexpected.
One of the best skills to have as a trader is to be able to readjust on the fly
when the immediate trend is reversing in your face at the speed of light.
Particularly if it took 2 hours to finally form a downtrend only to require 30
seconds to reject it and form the uptrend.
It's easier said than done as I've witnessed experienced traders giving away
profits from lacking the mental fortitude to erase the past and concentrate on
the now. Been there and done that many times myself but as time goes by if you
take your work seriously you develop all types of skills in trading.
Make sure you are fully aware of any possible change in direction but most
important if the change is justified by your price action rules.
Don't let the market stun you.
Anek
Quote from babe714:
Thanks for posting your analysis Rn86 . Looking over your charts I notice in the case of a trend change you will take an entry ( i.e. long ) after just 1 HH and 1 HL has occurred . This gets you in a trend early but I believe for AHG style trades discussed here trend change requires (i.e. long) 2 HL and 2 HH . Or am I completely missing this basic concept , Anek ,anyone ?
Quote from Rn86:
Basically, at any moment Im asking the simple question, if market cant make new high/low, where it most probably will go next??
Quote from ave331:
Piscuy, "Hopefully in time you will see the value of price action and the probabilities it gives you, till then use the indicators as reference but always trade price action" ... that would be the very practical approach for me for the time being until such time as I can do without the indicator reference. Thanks for your words of encouragement.
Best regards
~ave
Quote from Anekdoten:
Preparing for the unexpected
The best trader has no bias.
He or she goes long or short without a single ounce of bias and his decision is 100% based on price action not on fundamentals, economic news or what Joe Guru X said the night before.
Anek
Trading and life
Im going to talk a bit about a subject that is not often discussed but I
belive to be of colossal importance in trading. That is why the title of this
post is trading and life.
Trading is a very demanding job, no doubt about it. Therefore it is very
important to be at ease in your life with most things that go around in your
everyday life. I always have a saying that if im not feeling 90 % I wont trade
that day. It may be a cold, family troubles, breakup with the girlfriend, you
are underslept, hungover or anything that takes away from our abilitites to
trade.
As you know by now trading is about dicipline, but not only when you are sitting
in front of the screen. It takes time, and in the beginning it takes effort but
as they say after 21 days anything becomes a habit.
Life has a funny way of surprising us when we least expect it so dont let it
affect your trading. If you are not feeling good, dont trade. The market will
always be open tomorrow or if its a friday it will be open on monday.
Dont loose sight of why we want to trade and succeed at it. Im sure the most
appealing fact in it is the idea of the life we want. The freedom to have the
things we desire, the ability to work without having a boss, employees etc. etc.
You are trading to live and not living to trade. Its not about money, its not
about ego, it is about life and how we want to live it. As time goes by and you
improve your trading you will be forced to look within and evaluate yourselves
and your emotions. That is the only way to learn to controll them(note that I
did not say ELIMINATE). It is a journey, not an easy one but a very rewarding
one. You will get the life you want but in return you have to get to know
yourself. That is where trading can even improve everyday life.
Piscuy
Thanks Piscuy, those words ring true.
__________________
too soon old, too late smart
Now I know why Piscuy oversleeps on a daily basis lol
Anek
Babe, I will try to explain in details my possible trades on your chart by
marking it and if you have any question please don’t hesitate to ask as I may
just jump to a trade illustration without definition..![]()
First, I draw dotted magenta – résistance line. You might say that this line is
incorrect because there were few shadows above the line. But I will argue that
neither candle has closed above the line therefore it creates resistance in my
belief. Then market broke the line and created new high. What options do you
have? One of the trades I would take I ve marked on chart.
Look how market touched the magenta line coming from above. Excellent
opportunity to go long with a very tight stop – magenta ellipse.
#3 HH would be a failed new high. What can you do there? One option is to short
on a break of a low of a failed bar. I think it’s a famous trader Vic. Setup,
but I might be wrong.
Your “long 1483” have absolutely correct place but different methodology. You
obviously use a trend line bounce -> green bar -> break of a high. Excellent.
But I have a little puzzle for you, notice the trend line and measure two swings
– 1->2 and 3->4. They come together…might give you an edge.
If you looking for a correct place of an early entry I ve explained before, I ve
marked it by thick white arrow and re numerated in right way by using yellow
print. I want to be in a market between 2 and 3. But here is a problem:
A) If I assume that it would be new high failure, I have unacceptable RRR.
B) It was not clear new high /for me/, it was kind of double top, therefore its
has different outcome
C) Here goes discretional part – look on that 10 point move and time. Market
must have real steam to go higher, but Im not sure about that.
Morning scalps before coffee...
Small sample to get you going.
Anek
Anek,
I read where you left the YM for the ES due to the slippage you were
experiencing. Why did you move from the ES to the NQ?
MDT
Quote from MiniDowTrader:
Anek,
I read where you left the YM for the ES due to the slippage you were experiencing. Why did you move from the ES to the NQ?
MDT
Could NQ be any easier today ?
Look at it in 1500, kid's stuff.
Anek
Quote from Anekdoten:
Besides no crappy CBOT.
Anek
Quote from MiniDowTrader:
I hear you man...first-hand experience with their little "timeouts".
MDT
Never looked at NQ before, sure was clean this morning. I see margin is less than ES, but not clear on value. What is value of change from 2001.00 to 2002.00?
5.00 per tick
20.00 per point
per contract
Anek
Bar color changes
Does anyone know how to code the bar color changes in Sierra?
thanks in advance....
jackj
Optimal NQ trading day so far.
If Razor posts NQ losses today, I'm kicking his ass
![]()
Anek
Anek, I have been following your thread with great interest, however, I am
struggling a bit with your methods. I made 2 trades this morning. On profitable,
but I got out too early. The other was a loss.
I posted the charts below. I was wondering if you would comment on my entries
and exits.
There are two charts, one on top of the other. One is ES the other NQ.
Thanks.
edpolton
are you still trading Sep ES contract?
Morning NQ analysis.
Readers, please tell me what I see that you guys don't.
Anek
Ed,
Your NQ is Z but your ES is U ?
Anek
Quote from Anekdoten:
Ed,
Your NQ is Z but your ES is U ?
Anek
Ed,
Don't worry man, it happens to the best.
Anek
Anek, re your chart, I don't understand, "No pop up, no short. Odds in your
favor."
Where you said, "no bright red bars closing below prev low." point noted! That
is where I took a short at 2005.75, before the earlier high of 2007.50 was taken
out.
The rest all makes sense, except your question.
![]()
If you see it and I don't see it, how can I tell you what it is? That is a
paradox.
oh, also, I don't see why the profitable mistake was a mistake. It was a new low
and a bright red bar.
Jaxon,
My apologies, sometimes I mark the charts and forget I'm talking to the whole
world.
The previous move had extended downside, when that happens it is prudent to wait
for a pop up then take the signal.
I got carried away and eventhough it worked "ok" it's not good trading because
it lowers the odds of probability.
Anek
New to NQ, dont know yet all the quirks, but would probably looking to buy in
this area.
NQ 1500v EST
Hi,
Currently up $107 net. Was up an unrealized $200 at one point (had 2 cars as I
added to a short during the morning session)...trade came back to give me +4 on
the first entry and -1.50 on the second, if that sucker would have had one more
downdraft after my add would have posted a +$300 day....no worries.
Will see what the afternoon has to offer
![]()
Cheers ![]()
Rn,
I concur, we just need the higher high.
Anek
Quote from Anekdoten:
Rn,
I concur, we just need the higher high.
Anek
Quote from Rn86:
I agree with you, master Anek, however I ve attached your chart and looks like you are pretty aggressive on that last green circle ;)
Attached please find a handy TS indicator.
It will display in real time how many cars are left for the current bar to close
right next to the active bar.
Allows you to "cheat" if you are fast enough.
Anek
Screenshot of the count down indicator.
Quote from Anekdoten:
Screenshot of the count down indicator.
Quote from Anekdoten:
The previous move had extended downside, when that happens it is prudent to wait for a pop up then take the signal.
Anek [/B]
very cool! but I can't get it to load.
Hi,
Afternoon was not so good ![]()
Net Gain on day +$18, two long losers. Oh well, tomorrow is another day
![]()
No equity trades today.
Cheers ![]()
Quote from Razor:
Hi,
Currently up $107 net. Was up an unrealized $200 at one point (had 2 cars as I added to a short during the morning session)...trade came back to give me +4 on the first entry and -1.50 on the second, if that sucker would have had one more downdraft after my add would have posted a +$300 day....no worries.
Will see what the afternoon has to offer
Cheers
I can unzip the file, but when I try to open the ELD file I get no Analysis Types and I can't proceed with the Tradestation import wizard. Any idea what is wrong?
Looks like the trade / long from broken resistance / worked out.. so where would be an exit ? Here is one idea
Jaxon,
Could be the TS version #....
Try the code.
input: AlertTicks(0), HOffset(3),
AlertText("Vol"),AlertColor(magenta),
NonAlertColor(White);
vars: txt(-1),TicksLeft(0),color(0);
if BarType = 0 then
begin
//initiate the text variable
if BarNumber = 1 then
txt = text_new(date,time,close," ");
TicksLeft = BarInterval - ticks;
if OneAlert(TicksLeft <= AlertTicks) then
alert(NumToStr(TicksLeft,0)+"-"+AlertText+" alert");
//text color changes with alert
if TicksLeft > AlertTicks then
color = NonAlertColor
else
color = AlertColor;
//reset at each tick
text_SetLocation(txt,date,CalcTime(time,HOffset),close);
text_SetString(txt,NumToStr(TicksLeft,0)+" " + AlertText);
text_SetColor(txt,color);
end;
Anek
Quote from Techdoodle:
Do you mean a relatively long bar? I have been making mistakes with these and then finding out that sometimes they retrace pretty well.
-Tech
Here is another idea, might be helpful
Ok,
This is my first day exercising the AHG method. Time to put it into action.
11 trades
1 contract net / -$47.8
btw- since the past 2-3 years of intermittent charting, I have yet to spend a
dime. It's on paper thru IB's sim account.... thank god!![]()
Attached, is today's chart with some comments on it.
-Tech
Techdoodle
If you allow me to comment ![]()
- I love your short trades under red circle #3, #5 and long around 15:11 have
excellent RRR.
Trade #2 probably a good one, but you exited too early, I would have placed a
stop above most recent resistance.
#3 short - no signs to exit, coming from DT in downtrend.
#4 probably too close to a possible DB formation, glad it worked out
Quote from Techdoodle:
Ok,
This is my first day exercising the AHG method. Time to put it into action.
11 trades
1 contract net / -$47.8
btw- since the past 2-3 years of intermittent charting, I have yet to spend a dime. It's on paper thru IB's sim account.... thank god!
Attached, is today's chart with some comments on it.
-Tech
Taking a family break, followed by alcohol refill, the levels are down
![]()
Anek
Well A. went live today. 2 trades, basically even. Missed the easy stuff on nq this morning.
It is with great trepidation that I post this chart. I only took 3 trades
today, and they were marginal. But I have to say, with the full benefit of
hindsight there were not very many true AHG entries today, if you waited for 2
HH/HL or 2 LH/LL to define the trend.
My first trade I was looking for a long entry after one HL and a HH, and even
tho the pullback created a double bottom I entered long.... and got stopped out.
Once that low was taken out I recognized market was in downtrend and was looking
for a short entry, but missed the obvious entry and refused to chase it. 2nd
trade, still looking for the short entry I sold after what appeared to be a
double to at 2007.5 (My entry was 2005.75 and my stop was above the DT at
2007.75.
We got the 2007.75 print before market broke higher. At this point I saw the
trend as up, but large green bar did not give me a comfortaable entry. I was
looking for long entry now, and entered after a bright green bar! Market moved
up, I gave it time but there was no follow through. Got out for +1.25 pt and
yes, market pulled back and I would have been stopped out for a loss but I do
not like practicing taking small profits. It will hurt me in the long run if I
don't let these things run. Rest of the day provided only marginal entries.
Looking at the chart I really don't feel like I missed much even in hindsight.
I really am the "struggling trader" of this topic title!
![]()
-1,5 -2 + 1.25 = -$45 less commish
(Anek, thanks for posting EL code a few posts back. Indicator works great!
![]() )
)
Quote from Rn86:
Techdoodle
If you allow me to comment
- I love your short trades under red circle #3, #5 and long around 15:11 have excellent RRR.
Trade #2 probably a good one, but you exited too early, I would have placed a stop above most recent resistance.
#3 short - no signs to exit, coming from DT in downtrend.
#4 probably too close to a possible DB formation, glad it worked out
Had a rollercoaster of a day until later where I just took a beating. Going
to post a chart with my entries & exits with some reasoning. After that going to
post a chart with tech work now that I can see it in hindsight. Any and all
commentary appreciated on my trades.
~Cx
**Legend:
Green Vertical: Longs
Red Vertical : Shorts
Gray Vertical : Exits
Pink Vertical : Reverse
P.S. Let me know if it is too cluttered to analyze. If it is, then I'll break it
up into morning and afternoon charts and spread horiz.
Quote from Anekdoten:
Tech,
Does not look bad.
Little overtrading and in some instances you were trading on pure chop which ultimately led to your small loss, read afternoon.
Also remember what's annotated on my very first post.
Short the pop ups on a downtrend.
Long the retracements on an uptrend.
Sometimes I forget about the above two lines.
This will increase accuracy and reduce stops.
Also spend considerable amount of time spotting congestion, I barely traded the afternoon.
Anek
PS: You respond to your very own questions in a logical way, which will ultimately lead to trading wisdom.
Jaxon,
The double bottom "buy" with a tiny stop below support is ok, no real harm done
there, good effort. The hint to avoid that was the nasty AH selloff evidence so
only taking the mid swing break was the possible play there.
On your short, notice how price consolidated at the lows, forming a rectangle
formation only to escape to the upside, trend or not that's a bullish sign,
price was trapped, found a side and escaped.
Your third play, the long, that had absolutely nothing wrong and I lost on it
myself albeit a minimal stop.
It seems the best trades were skipped.
Anek
Quote from Jaxon:
It is with great trepidation that I post this chart. I only took 3 trades today, and they were marginal. But I have to say, with the full benefit of hindsight there were not very many true AHG entries today, if you waited for 2 HH/HL or 2 LH/LL to define the trend.
My first trade I was looking for a long entry after one HL and a HH, and even tho the pullback created a double bottom I entered long.... and got stopped out. Once that low was taken out I recognized market was in downtrend and was looking for a short entry, but missed the obvious entry and refused to chase it. 2nd trade, still looking for the short entry I sold after what appeared to be a double to at 2007.5 (My entry was 2005.75 and my stop was above the DT at 2007.75.
We got the 2007.75 print before market broke higher. At this point I saw the trend as up, but large green bar did not give me a comfortaable entry. I was looking for long entry now, and entered after a bright green bar! Market moved up, I gave it time but there was no follow through. Got out for +1.25 pt and yes, market pulled back and I would have been stopped out for a loss but I do not like practicing taking small profits. It will hurt me in the long run if I don't let these things run. Rest of the day provided only marginal entries. Looking at the chart I really don't feel like I missed much even in hindsight.
I really am the "struggling trader" of this topic title!
-1,5 -2 + 1.25 = -$45 less commish
(Anek, thanks for posting EL code a few posts back. Indicator works great!
Cx,
That's a lot of trades for such a low volume day.
What am I missing ?
Anek
Quote from Cxinvest:
Had a rollercoaster of a day until later where I just took a beating. Going to post a chart with my entries & exits with some reasoning. After that going to post a chart with tech work now that I can see it in hindsight. Any and all commentary appreciated on my trades.
~Cx
**Legend:
Green Vertical: Longs
Red Vertical : Shorts
Gray Vertical : Exits
Pink Vertical : Reverse
P.S. Let me know if it is too cluttered to analyze. If it is, then I'll break it up into morning and afternoon charts and spread horiz.
Cx,
I will analyze ES and upload the results in a few.
Anek
Quote from Anekdoten:
Cx,
That's a lot of trades for such a low volume day.
What am I missing ?
Anek
Quote from Anekdoten:
Cx,
I will analyze ES and upload the results in a few.
Anek
Cx,
ES analysis attached.
Not an easy one, especially the afternoon, some ugly moves. Some of them
reminded me of ER2.
Maybe things were better looking, due to low daily volume, in the 2500 one but I
analyzed the one you used.
NQ, you my baby ![]()
Anek
Important Announcement
Tomorrow is FOMC and this one will be nothing short of a Pandora's Box.
My suggestion is to not trade the afternoon unless you are a highly competent
trader and are fully aware of the consequences.
AHG is incompatible with such events.
Anek
Quote from Anekdoten:
Important Announcement
Tomorrow is FOMC and this one will be nothing short of a Pandora's Box.
My suggestion is to not trade the afternoon unless you are a highly competent trader and are fully aware of the consequences.
AHG is incompatible with such events.
Anek
Quote from Anekdoten:
Important Announcement
Tomorrow is FOMC and this one will be nothing short of a Pandora's Box.
My suggestion is to not trade the afternoon unless you are a highly competent trader and are fully aware of the consequences.
AHG is incompatible with such events.
Anek
Anek
Thanks for this thread, I came across last week and I really appreciate your
work and your energy that you put in it. I thought , maybe is right that I bring
something in this thread too and not just only read the post. I will try for the
next days to post my trades, comments, and mistake too…..keep going
![]()
Is this a correct AHG structural presentation for the long setup? /Shorts are just an opposite/
Some Scalps for this morning
Last week I had a discussion with Anek and he told me you guys would enjoy to
see how I make my scalps. In the spirit of helping I will try to post some
trades with as much detail as I can.
Here I detailed the three trades I have seen this morning on the NQ. The first
trade and the second trades are shorts. The third one is a long. As I was making
the Chart a fourth trade developed and triggered but left it without drawing to
see if some of you can see it. Included in this first chart I put the key to the
lines that I will be using. The yellow line is trenlines, the red dotted line is
the stop for the trade if taken, it is the point where you are certain your
reasoning for taking the trade did not work therefore you are WRONG, close the
trade and look for the next one. The cyan solid line is the break point for
entry. My entries are usually the point where the line is drawn
(Support/Resistance) plus one tick.
As you can see, the risk in each trade I take I try to keep to a minimum, the
potential is maximized trade by trade on its current caracteristics.
As a side note, Scalping is much more demanding than swing trading, you have to
make decisions to enter and exit the trade in less than a heartbeat therefore it
is not for everyone. The concepts presented here work on different time frames
so if scalping is not for you adjust it for a time frame that you are
comfortable with.
I sincerily hope that theese examples are of use to all those who are trying to
learn, also that the chart is clear enough for understanding.
Good trading to all
Piscuy
Great thread Anek will catch up in a week, lots to digest. You and stealth
trader have lots of good things to say !![]()
Quote from Rn86:
Is this a correct AHG structural presentation for the long setup? /Shorts are just an opposite/
Quote from ondaflex:
Anek
Thanks for this thread, I came across last week and I really appreciate your work and your energy that you put in it. I thought , maybe is right that I bring something in this thread too and not just only read the post. I will try for the next days to post my trades, comments, and mistake too�..keep going
Thanks Piscuy, Looks like different approaches to trading based on price action result in many of the same trades, given similar timeframes. What do you base your exits on?
Piscuy,
Thanks fro posting your trades. I will play.
Attached are the entries I'd enter. They both are longs.
freewilly
Quote from bmwhendrix:
Thanks Piscuy, Looks like different approaches to trading based on price action result in many of the same trades, given similar timeframes. What do you base your exits on?
Piscuy
I vouch for Piscuy as a great scalper, I know his method well and he is at the
top of the game.
However, his methods and mine differ a bit so make sure you know this before
hand to avoid confusion.
With that said, there is a LOT to learn from him.
Some say scalping the ES on a daily basis for double digits is impossible.
I say they have not met Piscuy.
Anek
Quote from freewilly:
Piscuy,
Thanks fro posting your trades. I will play.
Attached are the entries I'd enter. They both are longs.
freewilly
Quote from Anekdoten:
Piscuy
I vouch for Piscuy as a great scalper, I know his method well and he is at the top of the game.
However, his methods and mine differ a bit so make sure you know this before hand to avoid confusion.
With that said, there is a LOT to learn from him.
Some say scalping the ES on a daily basis for double digits is impossible.
I say they have not met Piscuy.
Anek
Thanks indeed Piscuy for your insights and charts.
Do you mainly trade ES? If yes, what periodicities you use for it: 5kv, 10kv?
Thanks and good trading.
Quote from Marvin Zark:
Thanks indeed Piscuy for your insights and charts.
Do you mainly trade ES? If yes, what periodicities you use for it: 5kv, 10kv?
Thanks and good trading.
__________________
Piscuy
Zero bias to take a trade is like navigating without fog.
Re: Some Scalps for this morning
Quote from Piscuy:
My entries are usually the point where the line is drawn (Support/Resistance) plus one tick.
Piscuy
__________________
Lets all drink to the death of a clown.
Re: Re: Some Scalps for this morning
Quote from babe714:
So then you don't wait for a close above /below support or resistence ?
__________________
Piscuy
Zero bias to take a trade is like navigating without fog.
Hi,
Net Loss $-231, basically started down from the start of the day and had some
trades that were small winners come back to stop me out breakeven and also
couple more winners that came back to give me a small gain on a trail
stop.....overall just no continued trend after I got in the trade. NO worries
tomorrow is another day ![]()
Did ok on some BIDU trades ![]()
Cheers ![]()
THE
TREND
IS
YOUR
FRIEND
CA$HING!
Taking night off....
Anek
Hope you guys enjoyed the day and made some good profits. It was certainly a
fun day from the start, lots of opportunities out there. Enjoy the afternoon.
Piscuy
__________________
Piscuy
Zero bias to take a trade is like navigating without fog.
A bit of a review for scalps after FOMC
This is a small review of possible trades to be taken after the FOMC
announcement. Although as it has been stated before trading momentum on such big
events is not easy and not recomendable for inexperienced traders. Getting fills
is harder on these types of events and it can easily blow off any stops. So the
risk is higher but as you see on this chart the reward is higher as well.
If you see closely you will find the area of the trades I posted in the morning
and it looks kind of insignificant. The moves after the FOMC were really good
and the two im detailing here give multiple entries.
For the ongoing learning process of those who are interested I did not put stops
on purpose so that you guys can figure them out. Where and why would you select
your stop? Although as I have said on FOMC days fills are hard, a chart is a
chart, so for learning purposes it serves us well.
Good Trading
Piscuy
__________________
Piscuy
Zero bias to take a trade is like navigating without fog.
Re: A bit of a review for scalps after FOMC
Second Move after FOMC
__________________
Piscuy
Zero bias to take a trade is like navigating without fog.
Re: Re: A bit of a review for scalps after FOMC
First Move After FOMC
__________________
Piscuy
Zero bias to take a trade is like navigating without fog.
If only all days traded like this....$$$.
~Cx
ok, I ve read a few more posts and here is updated version of Anek's AHG setup, feel free to add rules and options.
Quote from Cxinvest:
If only all days traded like this....$$$.
~Cx
Quote from Rn86:
ok, I ve read a few more posts and here is updated version of Anek's AHG setup, feel free to add rules and options.
Quote from Jaxon:
wow, you really nailed it!
Congrats!
Is each circle an entry? ie, green = long entry, red = short entry, so exits are not marked on the chart? I hope you let some of those runners run.
Quote from Rn86:
Cx, thank you for clarification.
So, for the second picture - *DB in Uptrend* I ve placed a wrong level based on the first high, not a middle swing high, similar to the entry of *DB LOD*, will fix it.
For the first picture, if you want to use Ross technique - rules for this specific pattern and entry must be explained. If it’s not genuine AHG that people like to follow in this thread I will do it as an alternative entry
Cx, thank you for clarification.
So, for the second picture - *DB in Uptrend* I ve placed a wrong level based on
the first high, not a middle swing high, similar to the entry of *DB LOD*, will
fix it.
For the first picture, if you want to use Ross technique - rules for this
specific pattern and entry must be explained. If it’s not genuine AHG that
people like to follow in this thread I will do it as an alternative entry
Rn,
On the first pattern, the entry is the first closing bar above previous high
right after the second lower high.
Anek
PS: Mind not clear just in case ![]()
Cx, a trader.
Enough said ![]()
Anek
Rn,
Thank you for the pattern illustration.
Cx modified it correctly.
Again, the stout influence could be a factor.
Anek
Quote from Anekdoten:
Rn,
On the first pattern, the entry is the first closing bar above previous high right after the second lower high.
Anek
Rn,
Yes, here is in more specifics.
Your marked area could be an add point if broken with a bar closing above it.
Anek
Quote from Anekdoten:
Rn,
Thank you for the pattern illustration.
Cx modified it correctly.
Again, the stout influence could be a factor.
Anek
wow thats pretty clear after a few stouts. seriously guys... much obliged....
I have spent a lot more on books which have shared a lot less.
cheers
SS
p.s. Anek.. post the address where the crate of stout needs to be mailed
Rn. thanks for putting it on paper... printing as I type !!
Heh. Today could have paid for enough stouts to put anyone in a pleasant coma
for quite some time.
~Cx
Piscuy,
Are those entries "fractal" entries?
How do you know when to get out? Always had a hard time with entries like
that.....
B
Quote from Cxinvest:
Heh. Today could have paid for enough stouts to put anyone in a pleasant coma for quite some time.
~Cx
Quote from screenstruck:
wow thats pretty clear after a few stouts. seriously guys... much obliged.... I have spent a lot more on books which have shared a lot less.
Quote from Bogwaluth:
Piscuy,
Are those entries "fractal" entries?
How do you know when to get out? Always had a hard time with entries like that.....
B
__________________
Piscuy
Zero bias to take a trade is like navigating without fog.
Piscuy to replace Bernanke soon
![]()
Anek
Quote from Bogwaluth:
Piscuy,
Are those entries "fractal" entries?
How do you know when to get out? Always had a hard time with entries like that.....
B
__________________
Piscuy
Zero bias to take a trade is like navigating without fog.
Quote from Anekdoten:
Piscuy to replace Bernanke soon
Anek
__________________
Piscuy
Zero bias to take a trade is like navigating without fog.
Possible AHG Addendum
Bullish Scenario
Up swing (1HH, 1HL, required)
Confirmation bar closing above previous bar high (bright green paintbar) after
the retracement while the most recent HL remains intact.
Preferably not higher than half the distance between the last HL and the last
HH.
Target based on price action and next resistance or the very beginning of a
conservative averaging up play for the possible upcoming uptrend. Ideally target
must surpass the risk over the long run, unless price action says
otherwise.
Stop below most recent HL.
Open for discussion, needs further examination.
A wise/experienced trader I know claims the best possible entries are found at
the birth of new trends with the very first confirmation. Easier said than done,
this could be a possibility.
Anek
Note: An uptrend requires 2HHs and 2HLs, this play anticipates it with minimal
risk.
The pattern you just described is normally referred to as a 1-2-3 Bottom.
Also works as a 1-2-3 Top.
It was the first pattern I ever traded (thanks KR lol). Then of course I went
and tried to muck everything up with indicators.
I say add it. Just don't enter with guns blazing because it isn't a trend yet.
Piscuy-
I'll add some examples later....gotta go to the gym
![]()
Quote from Anekdoten:
Possible AHG Addendum
Bullish Scenario
Up swing (1HH, 1HL, required)
Confirmation bar closing above previous bar high (bright green paintbar) after the retracement while the most recent HL remains intact.
Preferably not higher than half the distance between the last HL and the last HH.
Target based on price action and next resistance or the very beginning of a conservative averaging up play for the possible upcoming uptrend. Ideally target must surpass the risk over the long run, unless price action says otherwise.
Stop below most recent HL.
Open for discussion, needs further examination.
A wise/experienced trader I know claims the best possible entries are found at the birth of new trends with the very first confirmation. Easier said than done, this could be a possibility.
Anek
Note: An uptrend requires 2HHs and 2HLs, this play anticipates it with minimal risk.
__________________
.....He who knows himself is enlightened.
--Lao-Tzu
Quote from Bogwaluth:
The pattern you just described is normally referred to as a 1-2-3 Bottom. Also works as a 1-2-3 Top.
__________________
.....He who knows himself is enlightened.
--Lao-Tzu
Hi guy
when i trade i pay attention to the HH HL too but for an entry but I keep an eye
on the big picture, it keep me out the trouble, example on 17-09 around 11
formed a 2T on down trend but I saw on two days chart it was near the low of the
previous day..so to me is it a no no entry
![]()
I realize this is a basic question, but I'll ask it anyway. In your
definition of a HH/HL(or LH/LL) trend, how many bars should pass between peak
and trough? Originally reading this thread, I thought you were talking about
consectutive bars. In looking at most of the charts posted here, it seems you
are looking for a trend over a greater number. Not all charts reflect this, as
it appears some are attempting to trade based on a 2 or 3 bar trend.
Any clarification would be appreciated.
Geometrically it is a 1-2-3 sure but the rules are a different story.
Anek
Quote from walter1986:
I realize this is a basic question, but I'll ask it anyway. In your definition of a HH/HL(or LH/LL) trend, how many bars should pass between peak and trough? Originally reading this thread, I thought you were talking about consectutive bars. In looking at most of the charts posted here, it seems you are looking for a trend over a greater number. Not all charts reflect this, as it appears some are attempting to trade based on a 2 or 3 bar trend.
Any clarification would be appreciated.
Same type of spill from a few days ago. Just wondering how you would have
played it Anek or if you would have. Perhaps a TL break? I could understand a
clearcut signal of the continued short closing under that last major pivot.
~Cx
Quote from Anekdoten:
I only count a break when a bar closes above or below the area in question.
Needless to say this is highly dependent on the chart type/size.
Anek
Quote from walter1986:
For example, in an uptrend, bar #2 closing above the high of the previous bar? Or the close?
Quote from Anekdoten:
Think you are confusing previous bar comparison to support and resistance areas.
Let me know if this clears it, if not I will post a detailed explanation.
Anek
Quote from walter1986:
You're right, I'm confused. Sorry.
Quote from Anekdoten:
Perhaps this helps.
Anek
Quote from Techdoodle:
Anek,
Asumming that your chart is NQ with 1500 vbars, your candles look much, much cleaner than mine.
Could this be based on data feeds?
Quote from Techdoodle:
I'm getting many more closes above/below previous hi/lo.
Quote from Anekdoten:
Tech,
Post the same chart and the same area for comparison.
Anek
A live play on the NQ....
Anek
Here is ES 4000v chart with perfect illustration of an early trend entry that
Anek proposed.
I prefer to use a tape in this retracement area - looking for active buying and
placing a stop order to buy a one tick above each bar in that new forming leg.
Several techniques may be helpful to identify eligible area:
- number of bars, for example less that 4 or 5, etc
- closing above 1/3 of the previous swing or maybe 1/2...
Hi,
Net Gain $30 on the NQ. Was down over $200 at one point so happy with end
result. Last five sessions have been tough on me but I am sticking to my
guns.....expecting a large up day(s) soon
![]()
Did well on some BIDU trades today
![]()
Cheers ![]()
ES trades - *2HH 2HL*
Trying to follow AHG 2HH 2HL strategy to illustrate real life setup . No exits
on a chart, only entry and scale ins.
Quote from Techdoodle:
Anek,
Asumming that your chart is NQ with 1500 vbars, your candles look much, much cleaner than mine.
Could this be based on data feeds?
NQ *AHG* Analysis
They don't teach you this in "Trading Academies"
Just like a beautiful breeze of fresh air, the good stuff comes the heart, and
it's always free.
Pun very much intended.
Anek
Quote from Trader273:
Tradestation doesnt build volume charts correctly. If you are not using TS, chances are yours is the one correct not Anek's.
Quote from Anekdoten:
That is correct, not sure what Tech is using but to my knowledge only Sierra, Multicharts and recently Esignal do, correct?
Anek
T273,
Much appreciated.
Anek
Quote from Rn86:
Here is ES 4000v chart with perfect illustration of an early trend entry that Anek proposed.
I prefer to use a tape in this retracement area - looking for active buying and placing a stop order to buy a one tick above each bar in that new forming leg.
Several techniques may be helpful to identify eligible area:
- number of bars, for example less that 4 or 5, etc
- closing above 1/3 of the previous swing or maybe 1/2...
A. Looks like on your chart today, you let the tripple bar lows function as a double bottom. Do I read that right?
Brief drawup for study purposes.
~Cx
Quote from walter1986:
You're right, I'm confused. Sorry.
I use IB feed with QT. Seems I display alot more wicks that TS.
I should change my name to 'overTrader'.
![]()
The chart shows my trades, and I commented on them along the way.
I don't want to confuse anyone, I'm just sharing.
Very poor trading today.
So far, I think I am totally my worst enemy. Lot's of personal stuff to
overcome. Things like patients, stand back and absorb the bigger picture, and
learn to spot things better in realtime.
Next post shows my analysis of the day. I really only saw 3 trades. Amazing
difference!
-Tech
Analysis after the fact.
Some of you are beating around the bush.
AHG has hard rules and most of it is not subjective.
We need to find out what the problem is before I can continue.
Anek
Anek,
How's the FAQ coming along?
opm8
Quote from Anekdoten:
Some of you are beating around the bush.
AHG has hard rules and most of it is not subjective.
We need to find out what the problem is before I can continue.
Anek
Cx,
That's what I need to find out.
Think identifying the chop is the cancer for most of the guys.
Rn,
Could you please upload the graphic version of the AHG shorts. I would really
appreciate it.
Thanks
Anek
Quote from opm8:
Anek,
How's the FAQ coming along?
opm8
Quote from Anekdoten:
Cx,
That's what I need to find out.
Think identifying the chop is the cancer for most of the guys.
Rn,
Could you please upload the graphic version of the AHG shorts. I would really appreciate it.
Thanks
Anek
Quote from Anekdoten:
Some of you are beating around the bush.
AHG has hard rules and most of it is not subjective.
We need to find out what the problem is before I can continue.
Anek
ok here is my mini AHG FAQ/manual,
again, it's not very long, and you'll see what I mean when I said I just take
parts of posts and paste them into the file.
Jack,
Did I overcomplicate things by cluttering the intraday NQ chart today ?
I feel it has a great deal of Do's and Don't.
Still not sure what is lacking on the chart I posted. Maybe it's the fact that I
annotated a lot of crap on it ![]()
Anek
Quote from jack411:
Well,
What I would mostly like to see is just a candlestick chart with valid and invalid entries, similar to the bar chart I posted in my previous post.
I think if we can see examples of "right" and "wrong" entries then that will help clear the air for a lot of people, including myself. I agree and understand what you mean by AHG having a hard set of rules.
I'm sure it will also help to have that FAQ finished. I have my own sort of jumbled FAQ I can upload if people would like. It's just a .txt with parts of posts cut and pasted. It's basically in the order that this thread goes. Anytime I see something I think is important I cut those few lines from that particular post and paste it in my .txt file...
Quote from Anekdoten:
Jack,
Did I overcomplicate things by cluttering the intraday NQ chart today ?
I feel it has a great deal of Do's and Don't.
Still not sure what is lacking on the chart I posted. Maybe it's the fact that I annotated a lot of crap on it
Anek
Quote from Anekdoten:
Rn,
Could you please upload the graphic version of the AHG shorts. I would really appreciate it.
Thanks
Anek
Quote from Cxinvest:
For me it is trying to see // trade the bigger picture as it develops and keep myself out of the micro so I don't chop myself to death and sell myself short.
Rn,
Thanks, I will be around watching a DVD as I down the recently mixed frozen
Margaritas.
And no, I'm not an alcoholic, just a drunk
![]()
Family out of town so no rules around the house today, anything goes!
Anek
Just so I can help keep this thread focussed, I will not post so many
extraneous charts.
-Tech
Tech,
That's odd, I think your chart logic is spot on most of the time.
Anek
Quote from Techdoodle:
Just so I can help keep this thread focussed, I will not post so many extraneous charts.
-Tech
Well,
I feel that there are some obvious things I need to learn. I feel that showing
my mistakes all the time might wear down the overall intention of this thread.
Maybe I was reading in between the lines that you were saying that things were
getting outta hand... based on my charts posted.
At the same time maybe some can relate to my mistakes. I don't know. I just don'
want to muck up this thread.
OK!
![]()
![]()
![]()
all right, here we go... after reading FAQ.txt that got me scary even after a few drinks I put together AHG illustration for short setup. As always, feel free to add notes and criticize as much as possible.
Quote from Rn86:
all right, here we go... after reading FAQ.txt that got me scary even after a few drinks I put together AHG illustration for short setup. As always, feel free to add notes and criticize as much as possible.
Rn,
Please look.
Thanks
Anek
The closing above previous bar high or closing below previous bar low is a
universal rule for me in most setups.
Same with Resistance, Support and Trendlines, wicks don't do it for me, I need
to see substance, in other words a close.
Now, on top of that, if it's a longbar, that would shy me away a bit.
For instance, today I had a long position that was approaching resistance. Right
on resistance I bought a couple of contracts at MARKET, making it BREAK
resistance, but that was just me playing games with two contracts to push my
previous size which was considerable. You want to avoid traders like me by
waiting for a close as confirmation.
Anek
Quote from Chase14:
On the first setup drawing(2lhs, 2lls), I did not think the price had to retrace past the previous LL. I thought any pullback with a 123 reversal was sufficient.
Am I wrong about that?
Just depends how aggressive you are. I like the closes better for
confirmation. Perhaps when more signals//indicators come together all at once in
your favor you can take an earlier entry. Like I said, the earlier shot will
reduce risk (stop) a bit, but confirmation is unrivaled.
~Cx
It is not required, Rn's example is just optimal.
The bar failure is the important piece of data.
Anek
Quote from Anekdoten:
Rn,
Please look.
Thanks
Anek
Rn,
Yes, the safest bet would be a higher high middle swing when playing a double
bottom in an uptrend that had quite the run.
Anek
Quote from Cxinvest:
Just depends how aggressive you are. I like the closes better for confirmation. Perhaps when more signals//indicators come together all at once in your favor you can take an earlier entry. Like I said, the earlier shot will reduce risk (stop) a bit, but confirmation is unrivaled.
~Cx
Quote from Anekdoten:
It is not required, Rn's example is just optimal.
The bar failure is the important piece of data.
Anek
for some reason I was not able to reload an attachment, so, here is last update
Quote from Rn86:
for some reason I was not able to reload an attachment, so, here is last update
Quote from Anekdoten:
Rn,
Thank you great work, if possible I think it should be noted than the DB + Swing or DT + Swing should be considered add points since technically you are already in the play from the previous confirmation play.
Thanks again.
Anek
RN: I must say, great job on the new Chart "ahg setup ver 2.1.jpg". Very
clear, picture worth a thousand words!!
Piscuy: I know this could be a new topic of its own but if you could go over
some of the techniques that you use for tape reading would be great.![]()
Rn,
One minor detail missing, rest looks splendid.
Anek
Now whenever a question is asked I can reply with a link to the Rn chart and
the paintbars and off to the stouts I go.
Simplicity is the key, in everything
![]()
Anek
Last update for today.
I will try to collect a real life samples of each setup from different markets
with stop, entry and target illustration.. if it would be helpful
Rn,
Your work will pay off, the visualization goes beyond words.
Thanks again
Anek
Much obliged Anek and RN.
Thanks Rn!
-Tech
I have just come to this thread. Looks great
Do I need to read all the pages from the beginning or is there a summary. Thanks
__________________
A Candle Loses Nothing By Lighting Another Candle
Quote from osho67:
I have just come to this thread. Looks great
Do I need to read all the pages from the beginning or is there a summary. Thanks
Quote from Cxinvest:
Same type of spill from a few days ago. Just wondering how you would have played it Anek or if you would have. Perhaps a TL break? I could understand a clearcut signal of the continued short closing under that last major pivot.
~Cx
Tip of the day
One of the hardest but most important things to do in trading is sitting on
your hands.
Work on that patience.
If no play, no trade.
Anek
Anek,
Love this thread and wanted to say thanks for all your effort here. I realize
it's a ton of work but believe me you're helping out many people here immensely.
I get the impression you consider a consolidation zone as a single unit with
respect to the trend. For example if there's an up trend and then consolidation
then it's a valid entry to go long when we close above it. All the various HLs
and LHs in the "block" of consolidation are grouped into one single swing when
it's over . Is that how you see it? Or maybe you only see it like this for low
volatility areas of consolidation.
opm8
Opm,
If I see tight consolidation and I'm already in a play I will adjust stops based
on current support/resistance in relation to current consolidation or perhaps
take profits and let it decide as I wait for an outcome.
If I have no position on and the current pattern is consolidation I patiently
wait for price to convincingly choose a side and play accordingly.
Many times some very safe and lucrative plays can be found once price makes up
its mind.
However, during consolidation the best bet imho is to patiently wait.
Consolidation is not bad at all, the only real evil is the chop.
Anek
Many Thanks
Hi Anek, and fellow Traders,
Firstly I would like to thank Anek for taking the time and effort to broaden the
horizon of any traders following his thread, secondly to thank the people who
also contributed with their often insightful posts. This thread has given me
something far more important than money, it's given me time that would otherwise
be spent trying to iron out bugs in my then marginal daytrading system that I
developed and traded thru 05. Time that can be spent with my family,even if it
means doing more work around the home. I currently trade Options on the FTSE100
and have just activated an online account with IB, I was hoping that I might be
able to get some pointers regarding some of the charting displays and tools
discussed in previous posts. I really don't know for sure what can be achieved
on TWS as my previous experience with online trading platforms is restricted to
Webiress trading the SPI on the SFE.
I would appreciate any information regarding how to set up Price/Volume bar
charts on TWS and also how the number of shares/ Futures contract is calculated.
i.e. 500,1500,5000 share charts.
Also I believe there is a technique to colour code the individual bars on a
chart according to their category, would this be compatible with TWS and how
might it be achieved.
Thirdly, when I try to download some of the attachments my computer tells me
that they are led files and that a specific program is required in order to
access the information, I would be grateful for any information on how to access
these documents.
Any help you could give me would be greatly appreciated.
Best Regards
Johno
Great job Anek,
Was wondering who is your broker and what platform do you use?
You can PM me if want.
Here is where I see us, right now. Trend has changed from down to up, but
following AHG you have to wait for two (count em) two, higher lows and higher
highs. I see a trendline break, and finally 2 higher highs, now looking for a
long entry.... right?
......... still waiting. It's tough when the NQ has moved 14.75 pts off the lows
before I start looking for a long entry. Up move may be exhausted by now!
NQ made a lower low before heading higher... now what?
.... edit.. looking H/S ish, but that's not AHG.
Quote from Jaxon:
NQ made a lower low before heading higher... now what?
__________________
Boib
Its easy to make a small fortune if you start with a big one
Punch me Anek if this has been distinctly addressed, but it is one of the
last things poking at me. On this chart I have two possible long entries circled
in bright green. The first entry is circled due to the first HL pivot since last
down trend. The second is the next HL pivot up, but now there has been a close
over the last trends swing high. So my question is, since there is nothing along
the lines of a double bottom or some huge support level, do you need to see the
new trend take out --AREA #1-- or is the first green circle entry --AREA#2--
valid? Making sure I am not getting in to early and fighting current
trends//momentum.
~Cx
CX, one thing we need to be very careful about is hindsight trading when we look at these charts. When I look at Area #1 I see the chart shows a lower low first, so I would not be looking for a long entry at that point. It looks like the last HH was made after a double top, although I am not sure that is relevant to anything. I also don't see why area #2 is a potential long entry because you have just made a 2nd LL. If anything, without the benefit of hindsight, I might have been looking for a short entry around area #2, following 2 lower lows, and what appeared to be a lower high.
Quote from Jaxon:
CX, one thing we need to be very careful about is hindsight trading when we look at these charts. When I look at Area #1 I see the chart shows a lower low first, so I would not be looking for a long entry at that point. It looks like the last HH was made after a double top, although I am not sure that is relevant to anything. I also don't see why area #2 is a potential long entry because you have just made a 2nd LL. If anything, without the benefit of hindsight, I might have been looking for a short entry around area #2, following 2 lower lows, and what appeared to be a lower high.
FWIW. NQ looks to be forming a big triangle on the day.![]()
Quote from Jaxon:
Here is where I see us, right now. Trend has changed from down to up, but following AHG you have to wait for two (count em) two, higher lows and higher highs. I see a trendline break, and finally 2 higher highs, now looking for a long entry.... right?
......... still waiting. It's tough when the NQ has moved 14.75 pts off the lows before I start looking for a long entry. Up move may be exhausted by now!
Big double top on NQ.
Play it right.
Anek
Quote from Rn86:
What about possible long?
DT and DB? Where do you set your initial stops? 50% retrace from entry? For example on the NQ potential DT today stop would be in the 2040.50 area? Thanks
Quote from Anekdoten:
Big double top on NQ.
Play it right.
Anek
I never got a close below the lowest point of the middle swing.
Anek
Quote from Jaxon:
I agree, bright green bars heading up, but... only two HL and ONE HH at that point. Don't we need to wait for a 2nd HH ?
now... double top and TL break?
edit.... I see Anek, I see!
harder than it looks!
Quote from Anekdoten:
I never got a close below the lowest point of the middle swing.
Anek
Always.
Anek
Quote from Anekdoten:
Always.
Anek
Anek has warned several times (make that, many times) don't go by the wick alone, must have a close. This one got about as close as possible without an actual close below.
I made the mistake of not waiting for a close of the bar to go short. Lesson learned. Great thread everyone.
however, after a double top, we did make a LL, and now a LH, right?
LL by .5 pt.
Quote from Jaxon:
Anek has warned several times (make that, many times) don't go by the wick alone, must have a close. This one got about as close as possible without an actual close below.
Quote from Cxinvest:
Yeah was referring to the failure & reversal though
Quote from Anekdoten:
I never got a close below the lowest point of the middle swing.
Anek
__________________
Lets all drink to the death of a clown.
ok, If I step away from the computer I can see the market for what it truly
is today = chop.
When I sit with my nose 2 inches from the screen it looks like,
uptrend/downtrend/uptrend/downtrend!
![]()
TREND LINE BREAK
Anek
Would you trade this on the failed Double Top - Middle Swing Low.
Jd,
Yes, small position and adding on confirmations with very precise and strategic
stops.
Once the next swing breaks then you can relax.
Remember, always start small on all plays then add on confirmation.
Anek
Anek,
Please define a DT/DB. Is it the wicks that have to line up, or is it the
closes? Or is it the highest high/lowest low that matters? Also, how much leeway
is there if the DT/DB levels don't match up exactly? Thanks.
opm8
Opm,
For some basic answers, investopedia.com has a great reference.
Anek
jdconner, I am confused by the chart you posted. You have a note at the
bottom, "didn't close below middle swing on double top? " What double top are
you referring to?
All that price action is occurring before there was a double top.
Where you have a green circle marked, ENTER, (enter long I presume) you have a
trendline break, but otherwise I dont see any AHG buy signals, only one high
that is higher than the last LH of the downtrend.
Possible to get one explosive consolidation formation inside another??
~Cx
Cx,
Symm inside triple top inside rectangular formation.
This could be brutal or a whole lot of nothing.
Confirmation > all.
Anek
cx, I just drew the same lines on my chart (The purple ones on your chart)
(before I saw yours) ... if it's a triangle we broke to the downside.
of course, now we have a double bottom at 2059.25!
![]()
Quote from Jaxon:
cx, I just drew the same lines on my chart (The purple ones on your chart) (before I saw yours) ... if it's a triangle we broke to the downside.
of course, now we have a double bottom at 2059.25!
__________________
Piscuy
Zero bias to take a trade is like navigating without fog.
jdconner, I am confused by the chart you posted. You have a note at the
bottom, "didn't close below middle swing on double top? " What double top are
you referring to?
All that price action is occurring before there was a double top.
Where you have a green circle marked, ENTER, (enter long I presume) you have a
trendline break, but otherwise I dont see any AHG buy signals, only one high
that is higher than the last LH of the downtrend.
Jaxon
Here is a 3000-vol chart that shows the bigger picture
JD
Vacation Time
Due to an above average (understatement) summer trading with superb volatility I
postponed by vacation.
Today had no real conviction (for now) and tomorrow is "triple witching" and
usually I stay off those days because they are choppy as hell so decided to take
my much needed vacation starting tomorrow.
Surprising the family today with the good news.
I encourage you to keep on polishing your skills while studying price action at
micro and macro levels.
Feel free to interact among each other. All you really need, aside from
discipline, has been posted in the journal.
Good trading, see ya all when I get back.
Anek
Quote from Anekdoten:
Vacation Time
Due to an above average summer trading with superb volatility I postponed by vacation.
Today had no real conviction (for now) and tomorrow is "triple witching" and usually I stay off those days because they are choppy as hell so decided to take my much needed vacation starting tomorrow.
Surprising the family today with the good news.
I encourage you to keep on polishing your skills while studying price action at micro and macro levels.
Feel free to interact among each other. All you really need, aside from discipline, has been posted in the journal.
Good trading, see ya all when I get back.
Anek
Enjoy !
Quote from Anekdoten:
Vacation Time
Due to an above average (understatement) summer trading with superb volatility I postponed by vacation.
Today had no real conviction (for now) and tomorrow is "triple witching" and usually I stay off those days because they are choppy as hell so decided to take my much needed vacation starting tomorrow.
Surprising the family today with the good news.
I encourage you to keep on polishing your skills while studying price action at micro and macro levels.
Feel free to interact among each other. All you really need, aside from discipline, has been posted in the journal.
Good trading, see ya all when I get back.
Anek
Quote from Cxinvest:
Possible to get one explosive consolidation formation inside another??
~Cx
__________________
Piscuy
Zero bias to take a trade is like navigating without fog.
Anek, have a great vaca! ![]()
jd, thanks for clearing that up for me. Your charts are on exchange time, mine
are eastern time and the price action was so repetitive I got a little lost.
Should have been able to figure that out myself!
Thanks all.
Rectangle broke down hard, as Piscuy just told me, this will pay for the cap
ride ![]()
Anek
Quote from Anekdoten:
Thanks all.
Rectangle broke down hard, as Piscuy just told me, this will pay for the cap ride
Anek
__________________
Piscuy
Zero bias to take a trade is like navigating without fog.
P,
Hahah right, I forgot about that part.
Anek
Hey,
Net Loss -$384, not sure what is going wrong right now....seems like everytime I
try to add to a winner the trend ends and a nice winner turns into a small loss
or b/e.....possibly market conditions, we shall see....tomorrow is another day
but quite a few larger losing days over the last few sessions....
No equity trades today.
Cheers ![]()
Quote from Razor:
Hey,
Net Loss -$384, not sure what is going wrong right now....seems like everytime I try to add to a winner the trend ends and a nice winner turns into a small loss or b/e.....possibly market conditions, we shall see....tomorrow is another day but quite a few larger losing days over the last few sessions....
No equity trades today.
Cheers
Yea not too worried, gonna review trades and see if I am doing anything major
wrong or just market action.
Thanks for the motivation and enjoy your weekend
![]()
Cheers ![]()
Quote from Cxinvest:
Stay positive and review trades. Market has been using me as its punching bag for the last week or so myself. See numerous opportunities, unfortunately the ones I have been taking have been backin up after a few ticks and alot of the ones I don't seem to do well (not all obviously). Seems streaky, but at EOD I see the chart, and am like "wow, you must have miffed because there were some good price setups!!". Maybe a nice weekend is what we need Raz
~Cx
Hi OPM,
I have some things to sort out now but will try and post a chart later.
Cheers ![]()
Quote from opm8:
Razor,
Post your trades and let's see if we can find where you went wrong. I managed just above breakeven today after a couple of dumb forced trades during the morning quagmire.
opm8
Quote from babe714:
Darn , I did get a close below below middle swing .
Just a note to QT users , there is a share candle countdown feature . right click chart > view > candle countdown
Razor,
Not everyday is optimal for averaging up.
FOMC was the last one I can think of.
The trend must be indisputably strong without a shadow of a doubt.
Hope you refocus soon.
Anek
Cheers matey,
Enjoy your trip ! ![]()
Quote from Anekdoten:
Razor,
Not everyday is optimal for averaging up.
FOMC was the last one I can think of.
The trend must be indisputably strong without a shadow of a doubt.
Hope you refocus soon.
Anek
I did not get to trade today.
Although I've done an end of day analysis on NQ.
I'm trying to look as macro as possible. I find this could really help me
decrease my itchy trading finger.
Anyway, it boiled down to 3 trades.
Easy to see after the fact, I know.
One thing I've noted were all the long confirmation bars. Most the moves were
half finished by the confirmation time.
White arrows are the entries.
Yellow arrows are the exits.
-Tech
Quote from Techdoodle:
I did not get to trade today.
Although I've done an end of day analysis on NQ.
I'm trying to look as macro as possible. I find this could really help me decrease my itchy trading finger.
Anyway, it boiled down to 3 trades.
Easy to see after the fact, I know.
One thing I've noted were all the long confirmation bars. Most the moves were half finished by the confirmation time.
White arrows are the entries.
Yellow arrows are the exits.
-Tech
Quote from jack411:
Tech,
I have this noted in my notes/txt file, but I want to confirm - when you see those longer bars, do you generally assume that the move is exhausted, even if it is from the start? Would you stay out or would you try to enter on the retrace? How would you handle the longer bars?
Quote from Techdoodle:
Hmmmm.
Well, that is a good question.
I think it would be logical to wait for a retrace, but for how long do I wait?
In theory, it would be easier to just let them pass on by, and then wait for another setup.
My thoughts are to reduce my trading frequency and be more selective.
How would handle long confirmation bars(as of now)?
-Tech
The longbars are dangerous, that's why I use volume and tick bars in the
first place, to avoid them.
If I got time tonight I will post an analysis of NQ tonight, it was not an easy
day, required major discipline in many areas.
Anek
did some "sim" trades today with ES using an adapted version of AHG. had 5
winners, one loser.
i am a little flexible in identifying the trend. mainly looking for higher highs
and higher lows (preferable two of them) or 2 consecutive bollinger band touches
or a previous trend line breakout. i also watch the middle of the bollinger band
(20 MA) to see if it is tapering or flattening out to step back.
my current stop is 2 points. target is 2 points unless resistance is closer in
which I go for 0.25 less than than resistance/support.
i wait for reversal before entry. need a close above a previous reversal candle
(meaning a white following a dark for a reversal in a uptrend). entry will be a
generous 0.25 above the top of the dark candle.
i use a 1 min chart with regular candles (as I use thinkorswim which doesn't
support volume bars or tick charts) and volume with 2 wide bollinger band.
Here is a chart of the ES5000v from today that I drew up. Today felt choppy
all around, but there were some ok shorts. Will probably start writing
commentary on the charts again soon, quicker to just draw for now
![]()
![]()
![]() . Feel free to comment,
criticize, study...maybe even do a little dance if the chart excites you!
. Feel free to comment,
criticize, study...maybe even do a little dance if the chart excites you!
~Cx
Quote from Anekdoten:
The longbars are dangerous, that's why I use volume and tick bars in the first place, to avoid them.
If I got time tonight I will post an analysis of NQ tonight, it was not an easy day, required major discipline in many areas.
Anek
Quote from jack411:
Anek,
I was talking about longer bars in general. Still using tick and volume bars, just bars that are longer than average. I thought that's what Tech was talking about to. But I could be way off.
Quote from Anekdoten:
Yes, I understand, I don't like them
Anek
Quote from Cxinvest:
Here is a chart of the ES5000v from today that I drew up. Today felt choppy all around, but there were some ok shorts. Will probably start writing commentary on the charts again soon, quicker to just draw for now
~Cx
Quote from Anekdoten:
Yes, I understand, I don't like them
Anek
Quote from jack411:
Anek,
I was talking about longer bars in general. Still using tick and volume bars, just bars that are longer than average. I thought that's what Tech was talking about to. But I could be way off.
So how do you play them? I remeber seeing you say something about "the move being exhausted" like I was saying a couple posts up. Do you recommend just sitting in the sidelines during those plays?
Quote from Techdoodle:
I was referring to the bars whose close confirms entering a trade. When they are long, I think it might be an indication of the beginning of chop, Or already a half exhausted move, etc.
Talking only about the confirmation bars(this time).
Quote from Cxinvest:
If you are a trader who likes//needs to see closed confirmation bars, long ones may cause stops to be too large as well. No biggie, always more opportunities.
~Cx
No one puts a gun to your head and forces you to trade.
If there is ANYTHING you don't like about a particular trade you do not take it.
And if it happens to work well after you skipped it, it is your duty to make
sure it does not affect you.
That's how a professional thinks.
Anek
awesome answers guys
AHG Analysis for NQ
It was a hard day to trade but as soon as the trend decided to show it's face
one trade made the day.
Sitting on your hands and taking small losses was absolutely quintessential
today.
Also examine the Double B failure and how the element of surprise rewards
traders.
Small losses
Break evens
Small wins
Great wins
....only way to beat trading.
Hope it helps.
Anek
A little off topic, but did anyone else who uses IB for data get a change of margin requirements message today around closing?
With permission from "Josh".
This makes my day.
"Anek,
Thank you for the journal. I have been an avid reader for many weeks now and I
finally
understand what this is all about. Your system works, it's golden, it just takes
time
to understand the rigid but important rules and then again there is that
discipline you
speak about all the time that cannot be taught.
Since I started using your rules on the DAX and I've had 14 winning days (all
ranging
from small to best ever) and 4 small losing ones.
You are so right, identifying the chop is most important, it is our only enemy.
I'm shy so I never post but Im appreciative and grateful so thank you very much
for your
time, hard work, commitment and for teaching me and the rest, the way to
profitability
in the world of trading.
Enjoy your well deserved vacation and feel free to post this on the journal.
Eternally grateful,
Josh"
This merits a couple of stouts, like if I needed a reason!
Anek
Quote from Anekdoten:
With permission from "Josh".
This makes my day.
"Anek,
Thank you for the journal. I have been an avid reader for many weeks now and I finally
understand what this is all about. Your system works, it's golden, it just takes time
to understand the rigid but important rules and then again there is that discipline you
speak about all the time that cannot be taught.
Since I started using your rules on the DAX and I've had 14 winning days (all ranging
from small to best ever) and 4 small losing ones.
You are so right, identifying the chop is most important, it is our only enemy.
I'm shy so I never post but Im appreciative and grateful so thank you very much for your
time, hard work, commitment and for teaching me and the rest, the way to profitability
in the world of trading.
Enjoy your well deserved vacation and feel free to post this on the journal.
Eternally grateful,
Josh"
This merits a couple of stouts, like if I needed a reason!
Anek
__________________
Piscuy
Zero bias to take a trade is like navigating without fog.
Anek, Everybody:
How relevant is this strategy for trading stocks only? Anything to be
modified/revised?
Thanks.
Anyone here trade ER2? Been trading it for the last 4 months and nothing
else. I just started trading with price action last week and finally threw out
my indicator.
I read about other people saying they trade with price action only, but they
never talk about specifics on how they do it. Trading strictly on price action
has always been a mystery to me, until last week when I caught this thread. And
after reading a portion of this thread I finally understand the effectiveness of
price and how important the close is.
Quote from jimclark:
Anek, Everybody:
How relevant is this strategy for trading stocks only? Anything to be modified/revised?
Thanks.
Quote from xcel454:
Anyone here trade ER2? Been trading it for the last 4 months and nothing else. I just started trading with price action last week and finally threw out my indicator.
I read about other people saying they trade with price action only, but they never talk about specifics on how they do it. Trading strictly on price action has always been a mystery to me, until last week when I caught this thread. And after reading a portion of this thread I finally understand the effectiveness of price and how important the close is.
Change of Margin
Hi BMW,
" A little off topic, but did anyone else who uses IB for data get a change of
margin requirements message today around closing?"
Not that I know of. Were they seeking to raise or lower margin requirements.
Also on another note,I've been trying to get a handle on the Price by Volume
charts depicted on Aneks' charts in what appears to be candlestick style. Do you
or any other traders here know if they can be used on IBs' TWS Platform, or is a
separate charting package required. The only other information that I can find
depicts PVB in a totally different format.
Thank you for sharing any thoughts you may have on PBV.
Best Regards
Johno
Re: Change of Margin
Quote from Johno:
Also on another note,I've been trying to get a handle on the Price by Volume charts depicted on Aneks' charts in what appears to be candlestick style. Do you or any other traders here know if they can be used on IBs' TWS Platform, or is a separate charting package required.
Johno
Did anybody play the double bottom this morning?
Quote from Cxinvest:
Xcel, if you can master everything in this thread + discipline, you definitely don't need any indicators for help because you'll have all you need. ER2 can often be very erradic and nasty...ever consider the ES or the NQ?
~Cx
Quote from JDConner:
Did anybody play the double bottom this morning?
Anyone else here use Stealth Traders standard 3 Bar reversal trade when
buying pullback on HH HL or selling popups on LH LL ??
He mentoned and explained it earleir in this Thread.
![]()
Anek
Calling it a day.
I felt wiser today even though I made some good mistakes to learn off of.
4 trades.
1 winner.
3 losers (should be 2 losers)
My chart has comments.
Today felt good based on my learning curve.
-Tech
Anek,
If you had to rank the setups based on order of strength, how would you rank
them?
My mind says:
1) Double Tops/Bottoms
2) Breaks of sym triangles
3) 2 HH/LL
4) The 1-2-3 Pattern
Did I miss any?
Double Bottoms and Double Tops played correctly are by far the most rewarding
and safe patterns in trading *if* done correctly.
Logical stops
Good Accuracy
Great risk vs reward
Price action for targets
If a trader fails to scalp the market correctly only trading DB/DTs on multiple
e-minis to improve the spawn rate would be enough for a very profitable living.
I know plenty of traders who live off them.
Anek
Quote from Bogwaluth:
Anek,
If you had to rank the setups based on order of strength, how would you rank them?
My mind says:
1) Double Tops/Bottoms
2) Breaks of sym triangles
3) 2 HH/LL
4) The 1-2-3 Pattern
Did I miss any?
__________________
Lets all drink to the death of a clown.
1) Double Tops / Double Bottoms
2) Rectangle/Horizontal breakouts
3) Flags
4) Triangles
5) Failed head and shoulders
That would be my order, personal opinion of course.
Anek
That change of margin message I got seems to have gone away.
Makes me nervous to get any kind of flashing message that says "MARGIN", kind of
the feeling I get when there is no more beer in the frig. 1 quick trade today +1
nq. Using real money now.
A. Is this the correct interpretation of the early day triangle on the nq? And how would or did you play the triple top?
B,
Looks good, that's pretty much where I bought it too.
Anek
Hasta la vista....
Anek
has this method been tried with longer timeframe
Quote from Cxinvest:
If you are daytrading you may want to look into index futures or some other ideas they can offer you here. Daytrading stocks is really tough do to their variation and inconsistencies. If you are talking swing trading stocks or investing in them, then you should be able to implement this full tilt. Your answers are still in the price action.
~Cx
Re: has this method been tried with longer timeframe
Quote from billdobson1972:
i have been following this from the start of this thread ..cant trade full time... but has anybody tried it on a longer time/ greater share number ..would be interesting to see the result
__________________
Piscuy
Zero bias to take a trade is like navigating without fog.
Longer Term Trading
"Quote from billdobson1972:
i have been following this from the start of this thread ..cant trade full
time... but has anybody tried it on a longer time/ greater share number ..would
be interesting to see the result "
--------------------------------------------------------------------------------
"A chart is a chart no matter what time frame you trade it. Same rules apply,
although it would have larger risk and reward. It works."
Piscuy
Hi Billdobson & Piscuy,
After I ceased Daytrading in 05, using price based techniques similar in
principle to the ones discussed here. I then applied these tactics to spread
trading options over futures contracts. This approach has proven to be excellent
for trade entry and when adding to existing positions. One weakness though, is
in detecting trend reversals, but strategic use of Options Spread dynamics help
to mitigate this weakness.
I hope this provides some food for thought as most of us myself included have an
aversion to large stops, as these have the potential to lead to serious
drawdowns.
Best Regards
Johno
It seems to me this Thread is moving past its original intent of identifying
and implementing HH, HL LH, LL trading a.k.a. AHG !! I dont know maybe I am
wrong about this. It just seems to me in the last couple of weeks its all about
Double bottoms , Double tops , rectangles , triangles, Head shoulders, failed
double tops , failed double bottoms,triple tops etc..etc..more. Of course there
are circumstances where a continuing double bottom in a uptrend could be argued
as a form of HH, HL trading.
But the majority of this style from my eight years of trading is highly
subjective. And thats not to say HH, HL trading is not subjective to a certain
degree. I know it is and trading in general is highly subjective as it is much
about being art as it is science.
But honestly, I must say for some reason have noticed this and I see where Anek
has posted his top strategies and does NOT even include HH, HL trading as one of
them.
And I do realize in the first weeks of this Thread Anek did identify that
learning to profit off congestion, consolidation (triangles, double tops etc) is
one of the advanced steps in this style of trading. However,I still just found
it odd that for such a long time it was the bread and butter ,but now HH, HL
seems to be disappearing.
Please I am not trying to start any controversy ,whatsoever. Anek and his thread
is the best thing ever to come to ET. And Im totally serious and sincere about
that.
But I guess that is why I am writing this. Because of this shifting of style and
slowly going away from the original strategy that was so exuberantly stressed at
the beginning of this thread.
And its just a little disconcerting on my part that this original and highly
effective trend following strategy is in someway being lost.
Jimmy,
Baby steps.
First you crawl, then you walk then you run then you fly.
This is the same path I took and it worked pretty well for me.
By having a solid foundation of how price action works you can then apply this
to the most reliable patterns and take them to the next level.
For instance say you see a well known pattern, and the pattern works, well by
having a solid foundation of price action you know exactly when the party is
over and when to continue. Where to place your stops, when to scale out, when to
add.
Also notice the paintbars, what do you think that is ? A close above previous
high or a close below previous low ?
Put all the pieces together my friend.
On Friday I barely traded because of personal matters which is why I only took
two highly reliable patterns instead of the usual scalps too.
Hope this clears your doubts.
It's up to you to decide where to start stop or even end, I'm only providing an
education.
Anek
PS: Besides I did not expect this journal to become the humongous beast it is
now.
Jimmy,
Also look at my past NQ intraday analysis lately, except Friday, that's pure
price action with patterns embedded.
In fact, I never seen that done before in ET period.
Usually you see a pattern identified with an indicator confirming it or some
other different flavor.
Honestly, not getting your comments.
Anek
I'm pretty sure number 3, "flags," are actually AHG basic (my own
terminology), so I think HHs and HLs are included...
I could be wrong...
AHG advanced is reversals, double tops and bottoms (and failed ones), and
triangles...
I'm officially in vacation but due to Jimmy's post I could not help myself
and attach one more chart for clarity.
All in unity, all the pieces of the puzzles combined at last !
Sayonara
Anek
Thanks Anek For clearing up this for me. Just something that had me wondering
a little bit lately . But it makes sense what you said about taking baby steps
and learning the setups that way.
xia , I think your exactly right. Anek may correct me but it does seem flags are
a form of HH HL trading and reading basic price action.
Also thanks for these helpful charts.
And go on your damn vacation already
![]()
A. quote
"By having a solid foundation of how price action works you can then apply this
to the most reliable patterns and take them to the next level."
If I understand your above comment, the way this would play out is that when a
common pattern forms, you wait for the last swing high or low of that pattern to
be exceeded as an entry signal, as a general rule. A noted exception would be
for a double top (bottom) which formed in the general trend direction, where we
may enter with a smaller stop, perhaps on a minor trend break of the runup
forming the second high. This simple concept, (if correct) realy simplifies
playing flags, channels, head and shoulders, triangles and dt/db's.
Triangles still get my goat a lot, as they sometimes morph into a broadening
pattern as the indecision of the market continues.
Beautiful day shaping up here in north florida.
Hope all the good comrades of this thread have a great Sunday!
Anek, Piscuy, or anyone...
Let's say it's a bull trend with a double top. Price moves down to middle low.
How seriously do you take the break of the middle low?
If price blows by the break?
If price hesitates and then breaks?
etc?
I'm looking at time&sales, which I don't really know how to read, in hopes to
give me indication of the seriousness of the break by seeing increased action.
Also, are there behaviors like the above mentioned that help you to decide to
wait for a retest after a break?
-Tech
Missed the morning move on NQ.
After analyzing it, I see it could have been AHG worthy. Not sure though.
Found myself trying to trade channel breaks. Got hacked up.
I think I'm just thirsty for action all the time.
As you guys have seen from my charts, that's a big obstacle for me.
![]()
I tell myself, "Patients, patients, patients."
-Tech
bye ![]()
Another question,
When experiencing a chop zone. Do you avoid any setups that fall in that price
zone for concern of price getting sucked into chop again?
-Tech
Anek,
Analyzing charts for me make the setups look easy.
Realtime, that's a whole other story.
Screen time I guess.
-Tech
Quote from Anekdoten:
bye
According to Bulkowski's excellent statistical analysis in his last book, the highest successful rate have rectangular breakout pattern and the symmetrical triangle, following by double bottom. Double top patterns are among the top of high failure rate patterns.
Gloves are off, trading all indexes at once.
Double top, symmetric triangle break down.
Another easy play.
This time is for real.
Arrivederci
Anek
Quote from Anekdoten:
bye
__________________
Lets all drink to the death of a clown.
Triangle breakout of high.
Quote from Anekdoten:
Gloves are off, trading all indexes at once.
Double top, symmetric triangle break down.
Another easy play.
This time is for real.
Arrivederci
Anek
Have to quit for the day.
I had trouble with breaks all day.
A couple I see as mistakes, but I think they were pretty AHG to me.
Another day at school....
-Tech
Quote from Anekdoten:
Gloves are off, trading all indexes at once.
Double top, symmetric triangle break down.
Another easy play.
This time is for real.
Arrivederci
Anek
Hi,
Net Gain +$173, ok day but was up $280 at one point so not all that excited
about the amount I gave back.
Did nice on a SNUS equity trade.
Cheers ![]()
ES today. Nice chart! Too bad I was busy running errons.
~Cx
P.S. How about that double bottom eh?
Quote from Razor:
Hi,
Net Gain +$173, ok day but was up $280 at one point so not all that excited about the amount I gave back.
Did nice on a SNUS equity trade.
Cheers
Quote from Razor:
Hi,
Net Gain +$173, ok day but was up $280 at one point so not all that excited about the amount I gave back.
Did nice on a SNUS equity trade.
Cheers
Quote from jimmygold:
Raz,
You have made huge leaps since the beginning of this Thread. I have recently reread some of the first few posts on this thread in July. And you have really grown just seeing some of your beginning posts.
Keep it up you are doing great
TS paintbar
Quote from Anekdoten:
Attached please find my "trivial" but useful paintbars.
If a TS user.
Make positive bars Dark Green
Make negative bars Dark Red
Neutral White
Add my paintbars, make CL bright red and CH bright green.
...or your desired colors of course.
Should help with price action.
Anek
Cheers ![]()
Quote from jimmygold:
Raz,
You have made huge leaps since the beginning of this Thread. I have recently reread some of the first few posts on this thread in July. And you have really grown just seeing some of your beginning posts.
Keep it up you are doing great
Quote from Techdoodle:
Have to quit for the day.
I had trouble with breaks all day.
A couple I see as mistakes, but I think they were pretty AHG to me.
Another day at school....
-Tech
Cheers ![]()
Quote from Cxinvest:
Good for you!
~Cx
Cheers ![]()
Quote from monti1a:
Agree...Raz...good job....
Quote from jack411:
Tech,
Seems to me like if you can analyze as well as you do after the fact, you should be doing fine.
How many points did you end up with net today?
And if you would have taken that long that you noted you missed, you'd definitely be up.
Do you take every signal you see?
Quote from Techdoodle:
I didn't break even. My stops were logical as far as where most recent hi/lo were.
I do try and take every signal I see. Although, I do see myself taking signals that have only 1 LH or only 1 HL. I think I'm not waiting for the trend to fully develop.
Today I took some Channel break signals, which slapped me in the face. I think I should concentrate on one thing at a time.
btw, I'm discussing my difficulties to perhaps help others in their's. It is so amazing how most of my education is dealing with my own discipline
-Tech.
Quote from jack411:
I enjoy reading all of your (and everyone's posts) . They are all very helpful. So how far down were you today?
I was reading through the thread again from the beginning last night, and saw a lot of Anek's posts that had 4 or 5 losses but the wins were big enough to put him ahead.
Tradestation
I'm considering going to Tradestation, but have seen several comments here recently about TS not building volume charts correctly. Can anyone elaborate as to what is wrong with them? Seems like some are using it anyway, so perhaps it's a minor flaw?
say you are using 1000 vol bars, you will see most bars at 1000, some at 1002, some 1010 etc.. same thing probably happens with tick charts but haven't confirmed. A big deal? Probably not. Not to me anyway. Also, If you track alot of markets with tons of charts and even worse, tons of indicators, trade station will lag when market really gets moving, so make sure you have a good computer.
forgot the pic for vol bars
Hello All
I am from India and trade the Nifty (the index future of NSE). After struggling
for about two years with all sort of indicators and systems, I finally shifted
to trading based on pivots highs and lows.
Two weeks back I came across this journal. I have been following it since then
and have read through it a couple of times.
Thanks Anek for such a wonderful effort. A best example of KISS principle.
The images of the structure uploaded by rn86 were really helpful to me. Thanks
rn86 for the same.
Best Wishes
Quote from Techdoodle:
Still sim trading.
Increase Accuracy
By now you should know I'm a fan of closing bars to get some kind of
confirmation when breaking support or resistance.
Well, I will extend this a bit further, the closing bar TYPE matters.
You can apply this to support, resistance, trendlines, symmetric triangles, etc.
Attached a simple illustration from today.
Ok, *maybe* this is my last post before vacation
![]()
Au revoir
Anek
Quote from Anekdoten:
Increase Accuracy
By now you should know I'm a fan of closing bars to get some kind of confirmation when breaking support or resistance.
Well, I will extend this a bit further, the closing bar TYPE matters.
You can apply this to support, resistance, trendlines, symmetric triangles, etc.
Attached a simple illustration from today.
Ok, *maybe* this is my last post before vacation
Au revoir
Anek
Its like watching paint dry on the YM and ES !!
No trades this afternoon and only one this morning for +9 . This stuff gets
awful boring sometimes.
Just part of the game I guess.
damn gotta shake my leg right now its starting to fall asleep.UHGGGH
![]()
Quote from jimmygold:
Its like watching paint dry on the YM and ES !!
No trades this afternoon and only one this morning for +9 . This stuff gets awful boring sometimes.
Just part of the game I guess.
damn gotta shake my leg right now its starting to fall asleep.UHGGGH
Since the close is so important I dont know how one would use, at least reliably, TS data using volume bars. I would think that your system would be much more accurate if using more accurate and correct volume bars.
Quote from Trader273:
Since the close is so important I dont know how one would use, at least reliably, TS data using volume bars. I would think that your system would be much more accurate if using more accurate and correct volume bars.
Hi,
Net $13 on NQ, traded ok today, added on one long and it came back to just stop
me out break even.....I think like 1/2 point or whatever cost me like $300 as it
proceeded to rocket from there and I was in double size....oh well, happens
![]()
Did nicely on some GS trades.
Take care all, gone until next week Wed.
Cheers ![]()
Quote from Razor:
Hi,
Net $13 on NQ, traded ok today, added on one long and it came back to just stop me out break even.....I think like 1/2 point or whatever cost me like $300 as it proceeded to rocket from there and I was in double size....oh well, happens
Did nicely on some GS trades.
Take care all, gone until next week Wed.
Cheers
Razor,
Howcome you did not kill it on the NQ today ?
It was a double bottom who created a never ending uptrend.
What am I missing here?
Anek
Hey Anek,
Have been trying to take it easy and take more selective trades.....like I said
I was up like 6 points on an NQ trade but let it pullback and then added looking
to sell on the next move up.....well it came back just enough to stop me
breakeven (on the avg of the two adds) and then it rocketed to new
highs.....again, I think I traded this well just got a little unlucky, half an
NQ point and I would have had like a $300 day.....it happens IMHO
Cheers ![]()
Quote from Anekdoten:
Razor,
Howcome you did not kill it on the NQ today ?
It was a double bottom who created a never ending uptrend.
What am I missing here?
Anek
Perhaps this helps.
Anek
Hi hear man,
Still happy with a breakeven day at my level.....slow and steady....I will ge
there ![]()
Thanks for the chart ![]()
Quote from Anekdoten:
Perhaps this helps.
Anek
Razor,
You know me, a small loss, a small win and a breakeven trade are alright in my
book.
Anek
![]()
Quote from Anekdoten:
Razor,
You know me, a small loss, a small win and a breakeven trade are alright in my book.
Anek
Quote from Anekdoten:
Perhaps this helps.
Anek
Anek, have you found the NQ better to trade from a trend perspective rather than the ES? Seems like the ES was way choppier today than the NQ. Is today typical from that respect or does it just vary from day to day which index will trend better. Are you going to stick with the NQ or go back to the ES after seeing how they both trade using AHG?
Anek,
My charts are not set to 24hrs. Just market hours.
I noticed you saw that D bottom this morning in relation to a 24 hr chart.
Do you take price after hours as seriously as market hours?
I realize I maybe depriving myself charting only during market hours.
-Tech
Quote from Cxinvest:
That trendline completely skipped two pivots
~Cx
Quote from Anekdoten:
Be flexible and adapt.
Anek
Quote from Techdoodle:
Anek,
My charts are not set to 24hrs. Just market hours.
I noticed you saw that D bottom this morning in relation to a 24 hr chart.
Do you take price after hours as seriously as market hours?
I realize I maybe depriving myself charting only during market hours.
-Tech
Quote from Cxinvest:
I leave that initial trend line in, but yeah I just felt the chart was mildly deceptive or confusing when a trend line is put in that looks like it is skipping moves in real time from left to right. Makes more sense for viewers now that you've shown the accelerating trend line.
~Cx
P.S. Enjoying vacation?
Quote from billydakid:
Anek, have you found the NQ better to trade from a trend perspective rather than the ES? Seems like the ES was way choppier today than the NQ. Is today typical from that respect or does it just vary from day to day which index will trend better. Are you going to stick with the NQ or go back to the ES after seeing how they both trade using AHG?
Quote from Techdoodle:
I now see your chart starts at market hours.
And that volume bars do not work after hours very well.
Nevermind... unless otherwise.
Quote from Cxinvest:
P.S. Enjoying vacation?
Quote from Cxinvest:
Yeah I was thinking the same earlier but thus far it has not affected me. Still going to run MC on demo soon here.
~Cx
Quote from Trader273:
I'd be careful of MC. When I was using them I would compare it to a chart in OEC and see that they were off. But then I would refresh and see that MC is now what it should be. Just an observation.
Busy most of day, but took 1 trade as a head and shoulder sell toward end of
day and had a small loss. Looking over the day I see several formations that
morphed into others. Could have been played in a very choppy and unprofitable
manner with those 2 head and shoulder fake breakouts.
Did I read things correctly?
Considering a long swing on ER2....
Anek
Quote from swingnifty:
Hello All
I am from India and trade the Nifty (the index future of NSE). After struggling for about two years with all sort of indicators and systems, I finally shifted to trading based on pivots highs and lows.
Two weeks back I came across this journal. I have been following it since then and have read through it a couple of times.
Thanks Anek for such a wonderful effort. A best example of KISS principle.
The images of the structure uploaded by rn86 were really helpful to me. Thanks rn86 for the same.
Best Wishes
Hi,
cool thread. If I may I like to ask about the closing price to which
significance is assigned here. Why do you find the close important? What does
the close mean in the bars you use?
On daily and weekly charts I can clearly see why the close should have
importance, at least in theory. These closes happen at session and trading week
endings and there might be some urgency involved before market close. The
closing price on volume bars or tick bars just happens to be the price when the
volume or tick limit is reached. Similarly on x-minute bars - the close is just
the price when the bar is running out of time. Why do you find that such closing
prices have importance?
I'm no daytrading expert, so I hope you don't mind the question. Thanks.
Hausse,
The close is important because not every trader uses the same chart type.
Anek
chop chop chop.............ZZZZzzzzz'sss
As soon as I say that, we get a impressive Symm. triangle breakout to upside
on YM.
Nice ![]()
NQ
looks like old trendline from yesterday is still in play im still holding a position from the bounce
Aggressive DB buy on TL break good for 7.5 pts.
Quote from low_hcp_golfer:
Aggressive DB buy on TL break good for 7.5 pts.
Low,
Beautiful, so happy to hear you caught that.
Anek
Scaling out on the ER2 long swing for +8.50
If we get a closing bar ABOVE the downtrend line of the flag, and I see a future
tick go above it, I will fortify the position and will be looking for nothing
short of 25 points for the future as target with a trailing stop.
Anek
A. It that your standard trendline break entry, to wait for 1 tick past the first bar that closes above (below) it? Same for s/r breaks?
Quote from bmwhendrix:
A. It that your standard trendline break entry, to wait for 1 tick past the first bar that closes above (below) it? Same for s/r breaks?
Quote from Anekdoten:
It's a habit....
ES: Double Top, pay close attention.
Anek
I aggressively entered long on NQ Tri.
No official break though.
-Tech
Quote from Techdoodle:
I aggressively entered long on NQ Tri.
No official break though.
-Tech
Quote from Cxinvest:
Tri = Triangle??
~Cx
Quote from Techdoodle:
I aggressively entered long on NQ Tri.
No official break though.
-Tech
Beautiful DTOP (ES) took patience but paying off well....
Anek
Took the short @2111.50. Looked like a double top but wanted to see a close below 2112.00 before entering.
Quote from Anekdoten:
Beautiful DTOP took patience but paying off well....
Anek
Trail stops.
How tight? I guess that goes with experience.
I find smaller highs and lows when I go to smaller Volume bars, but they are
usually too tight.
Nice legit short break of NQ, right?
-Tech
Quote from low_hcp_golfer:
Anek, did you take a more aggressive entry? Or was that the ES trade?
My stops on intraday swings are usually inital stop and or break even then I
start to scale out.
Unless I'm averaging up, then I simply use pivots highs and lows for strategic
points.
Anek
Covering some at ES support (33)
Anek
If short, look out for previous pivot highs areas and place strategic stops
and/or lookout for reversal formations.
Remember you can always get back in a trade.
Anek
Next cover areas 30, 26, 23....
Anek
![]()
![]()
Anek,
I have been following your thread for sometime now. Want to thank you very much
for your help.
I appreciate it.
Took the ES double top short (simulated though) around the same point 1538.25
around 12:45 EST and covered around 1536.25 at 12:56 EST. Scaled back in at
1538.25 at 1:06 EST
You didn't cover some when ES pulled down to 1536.25 around 12:56 EST ?
Where were your scale out points? Just trying to find out when you scaled out,
only at 1533 (significant support) ?
Thanks
disciplinetrade
D,
DTs at the top and DBs at the bottom are most definitely NOT scalp type of plays
but intraday swings.
Use trendlines to guide yourself and scale out at significant Ss and Rs.
Anek
Quote from low_hcp_golfer:
Took the short @2111.50. Looked like a double top but wanted to see a close below 2112.00 before entering.
We got a winner here with Low.
Rode it up, rode it down.
You my man!
Anek
Quote from Anekdoten:
We got a winner here with Low.
Rode it up, rode it down.
You my man!
Anek
ES TL break, all out.
Anek
OMG!
My first real trade!
I even added to the position. Exits were rusty, but nonetheless it was great.
-Tech
Quote from Techdoodle:
OMG!
My first real trade!
I even added to the position. Exits were rusty, but nonetheless it was great.
-Tech
Sounds great.
Watch out for reversal FAILURES now, if that happens, reshort, and use my
paintbars to guide yourself, TLs too.
Anek
ER2/ES double tops at the bottom, merits attention
Anek
Quote from Anekdoten:
Sounds great.
Watch out for reversal FAILURES now, if that happens, reshort, and use my paintbars to guide yourself, TLs too.
Anek
Quote from Techdoodle:
Sounds good.
I need to see today's low taken out.
Reversal in the making....
Anek
Quote from low_hcp_golfer:
Tech, FWIW, yesterday's high/close was at 2100. This should provide support...maybe wanna be careful shorting below 2102 with 2100 so close IMHO.
Also, yesterday's high on QQQQ was 51.07
Today of course opened much higher and only got down to 51.14 so gap remains.
Havent seen these prices since 2001.
Quote from Techdoodle:
Thanks for reminding me to put my mind on "wide".
-Tech
Early development of an upside-down HS on NQ?
Seems like a lot of support from 2104 - 2100
-Tech
Quote from low_hcp_golfer:
My intentions are not to talk you out of any trade but just throw in the fyi.... 2100 should be a reaction area with a bounce. Just wanted to give you a heads-up.
NQ Dragon pattern beauty, wow.
Anek
Absolutely annihiliated the NQ on that reversal formation.
Personal trading getting very strong and very scary, calling it a day to collect
my thoughts as I debate an increase of car size for the near future.
Anek
Quote from Anekdoten:
NQ Dragon pattern beauty, wow.
Anek
Low,
Downtrendline break, first add, then hump break, second add.
CA$SHING!
Anek
Quote from Anekdoten:
Absolutely annihiliated the NQ on that reversal formation.
Personal trading getting very strong and very scary, calling it a day to collect my thoughts as I debate an increase of car size for the near future.
Anek
What is dragon pattern? I just played the db.
Quote from Anekdoten:
Low,
Downtrendline break, first add, then hump break, second add.
CA$SHING!
Anek
I'm done.
Up 4 NQ points Today!
I had some stupid trades in there.
Good day for me. ![]()
Tech
Quote from bmwhendrix:
What is dragon pattern? I just played the db.
B,
Dragon Pattern.
Anek
And here is how it is played....
Anek
oops.... back broken... now what?
Quote from Anekdoten:
And here is how it is played....
Anek
Quote from Techdoodle:
Isn't that the same as an entry on a trendline break to the upside with an add on the break of the previous LH?
Or does it need an over-all shape?
-Tech
Small Nogard formation on NQ finishing up now. (flipped Dragon)![]()
1st Trade
Folks,
I just had to post this. Yesterday I entered my first trade using the
information shared here. I am very new so I am going real slowwww.
I may not be able to trade everyday due to day job but after my 1st real trade I
am up $30.00. I know it is not much, but just to finish my 1st in the green
makes me very happy.![]()
![]()
I know I would never have been able to pull this off with out everyone input.
Anek, your helpfulness for someone who a month ago never even looked at his 401K
until the statement came in the mail, is a testament to your sound and steady
teaching.
Please keep up the great work![]()
![]()
Thanks,
Jerry
__________________
Jerry
Jerry, Until we burn Anec out, he has been very nice about making comments on the charts of our trades we post. You may wish to avail yourself of his comments before he starts swinging 100 cars and starts moving in different social circles.
Quote from Anekdoten:
Absolutely annihiliated the NQ on that reversal formation.
Personal trading getting very strong and very scary, calling it a day to collect my thoughts as I debate an increase of car size for the near future.
Anek
Jack,
Just like I told Jimmy last week, baby steps.
At first I wanted to share the basics of trend following, but as the journal
grew into something quite serious with a lot of followers I decided to keep on
adding chapters.
The amount of people that contact me with PM and email is just incredible,
hundreds to stay the least. After such positive response it felt natural to let
go of more information.
Still with a few undisclosed tips but as I said at the beginning of this post,
baby steps.
Pattern trading with a solid understanding of price action is an extremely
powerful technique.
It´s a puzzle and with additional pieces a great work of art will eventually
reveal itself.
Stay tuned for more....
Anek
Anek. You are golden. if you are ever in NYC I owe beer and a dinner. Now,
let me get to the meat of this post. I recently added B. Bands to my system
(also changed them to 2.5 as per your instructions). My question to you is: How
detrimental are they to your way of trading? How accurate have they been since
you started using them? I am a bit skeptical since the rules for using them a
very simple, and although I am a firm believer in KISS principle, the rules for
using them are almost primitive. Now, please do not misunderstand my intentions
here. This is not a dis in any way shape or form. I just cannot believe that a
simple system can be this powerful.
BTW. What are your rules for B.B? I and I am sure a lot of newbs on this thread
would like to hear your take on them.
Awaiting your response
Anek,
Thank you for the only real guidance I may have ever seen on ET or in any
trading strategy book.
My 2 trades for today (i trade during the west coast lunch time) are detailed in
the attached file.
Thanks again for this journal.
Sincerely, elitetrader101
Agreed. This journal is the reason I haven't blown out, Anek.
Triangle on the NQ just now...
DB on ES vol 5000 looking good right now.
opm8
Yeah I read it as a DB on the gap close and a break of the TL. Long at 2115.50. Might take a little heat for the late entry but wanted to see it close above 2114.50.
ER2 Daily Bullflag working as expected.
A close above the downtrend line would be ideal.
Anek
Out @ +3 points on TL break...NEXT!
Low,
Excellent execution.
Remember, every single play *MUST* have a target greater than the risk but if
price action says otherwise we take what we can.
Once the trendline establishes itself, move the stop to protect capital, use the
TL for placement guidance.
Needless to say when the pattern works well the target will most definitely
surpass the risk.
However, something tells me you already know this
![]()
Anek
Agree 100%!
On entry, my target was HOD....price action dictated the exit.
Anek, have you found many trades to take so far today?
No, sitting on hands day, very few trades.
Anek
NQ is coiling...HL's/LH's.
NQ is nothing but a big ass symmetric triangle.
Anek
I'd like to see that bust out to the upside....I'm not comfortable with all the support levels below to short it.
Re: 1st Trade
Quote from Jerry64:
Folks,
I just had to post this. Yesterday I entered my first trade using the information shared here. I am very new so I am going real slowwww.
I may not be able to trade everyday due to day job but after my 1st real trade I am up $30.00. I know it is not much, but just to finish my 1st in the green makes me very happy.
I know I would never have been able to pull this off with out everyone input. Anek, your helpfulness for someone who a month ago never even looked at his 401K until the statement came in the mail, is a testament to your sound and steady teaching.
Please keep up the great work
Thanks,
Jerry
__________________
Piscuy
Zero bias to take a trade is like navigating without fog.
Quote from saxon22:
Anek. You are golden. if you are ever in NYC I owe beer and a dinner. Now, let me get to the meat of this post. I recently added B. Bands to my system (also changed them to 2.5 as per your instructions). My question to you is: How detrimental are they to your way of trading? How accurate have they been since you started using them? I am a bit skeptical since the rules for using them a very simple, and although I am a firm believer in KISS principle, the rules for using them are almost primitive. Now, please do not misunderstand my intentions here. This is not a dis in any way shape or form. I just cannot believe that a simple system can be this powerful.
BTW. What are your rules for B.B? I and I am sure a lot of newbs on this thread would like to hear your take on them.
Awaiting your response
__________________
Piscuy
Zero bias to take a trade is like navigating without fog.
Anek, firstly I'd like to congratulate you on a fantastic thread... thank you
for all your work.
I have one question if I may... do you take breakouts of small sym triangles
which are inside of a bigger sym triangle?
Quote from saxon22:
Anek. You are golden. if you are ever in NYC I owe beer and a dinner. Now, let me get to the meat of this post. I recently added B. Bands to my system (also changed them to 2.5 as per your instructions). My question to you is: How detrimental are they to your way of trading? How accurate have they been since you started using them? I am a bit skeptical since the rules for using them a very simple, and although I am a firm believer in KISS principle, the rules for using them are almost primitive. Now, please do not misunderstand my intentions here. This is not a dis in any way shape or form. I just cannot believe that a simple system can be this powerful.
BTW. What are your rules for B.B? I and I am sure a lot of newbs on this thread would like to hear your take on them.
Awaiting your response
Re: 1st Trade
Jerry,
Simulator for six month, no less.
It has been posted before but I don't want anyone running before crawling.
Best of luck/skill.
Anek
Quote from Jerry64:
Folks,
I just had to post this. Yesterday I entered my first trade using the information shared here. I am very new so I am going real slowwww.
I may not be able to trade everyday due to day job but after my 1st real trade I am up $30.00. I know it is not much, but just to finish my 1st in the green makes me very happy.
I know I would never have been able to pull this off with out everyone input. Anek, your helpfulness for someone who a month ago never even looked at his 401K until the statement came in the mail, is a testament to your sound and steady teaching.
Please keep up the great work
Thanks,
Jerry
Quote from elitetrader101:
Anek,
Thank you for the only real guidance I may have ever seen on ET or in any trading strategy book.
My 2 trades for today (i trade during the west coast lunch time) are detailed in the attached file.
Thanks again for this journal.
Sincerely, elitetrader101
Quote from gpzany:
Anek, firstly I'd like to congratulate you on a fantastic thread... thank you for all your work.
I have one question if I may... do you take breakouts of small sym triangles which are inside of a bigger sym triangle?
A. You probably have answered this several times, but again,
When playing a HH/HL setup for a change in trend. Is there an amount of pullback
for the second HL that would keep you from taking that trade? For example, if a
pullback is greater than 50%, do you find the rate of success diminishes over
ones that may pullback only to the support of the previous HH?
I played today badly, If you chart of today contains any lessons, they would be
appreciated.
D.
Quote from Anekdoten:
Thank you, as I said in the past, we are all learning here, myself included.
I suppose it depends on what frame you are actually trading.
Remember that a Symm breakout with the trend has greater chances of success than one against it.
Anek
Quote from Anekdoten:
Thank you, as I said in the past, we are all learning here, myself included.
I suppose it depends on what frame you are actually trading.
Remember that a Symm breakout with the trend has greater chances of success than one against it.
Anek
here's NQ daily.
B,
I had some patterns fail today, the day was very brutal but that's quite alright
because the stops are nothing to cry home about. I think today was one of the
ugliest trading days in a long time.
However, there are always scalping opportunities.
You know the paintbars I use are a close above previous high and a close below
previous low. Well, when you combine this with Trendline support or resistance
you get a nice scalping system because the stop is very small and the reward is
quite high.
Attached please find some of the scalps I did today on the NQ. Many worked great
on ER2 and ES as well and at one point I had the same play on all three indexes
at the same time, felt funny, but good stuff, minimal risk, great reward, just
like I like it.
I don't think I had one fail today.
Hope it helps.
Anek
ER2 Scalps
Few, but real gems.
Anek
Anek,
Thanks once again for the great thread and thanks for this scalping technique
for reducing risk.
Quick question as to when you actually enter the trade. For example on the ER2
chart for today, I see you marked a long entry at 13:55 in the chart. So, do you
wait for the bright green candle to complete and then you enter on the next
candle (somewhere within the body of the previous bright candle )?
And where do you place the stop, just below the low of this previous bright
green candle?
One more question, I understand the bright red and green candles. I see some
white candles, when do you get white candles ?
Anyone know if one can plot these bright candles in Ninjatrader?
Thanks
disiplinetrader
Definitely wait for close otherwise you don't know if the close was actually
above or below the area in question.
Always wait for close, in breaks, in test, in scalps, in patterns, etc.
White means neutral action.
Anek
A. Do you live in front of your computer? How do you know when a message has been posted and reply so quickly? I need to do whatever it is.
Quote from disciplinetrade:
Anyone know if one can plot these bright candles in Ninjatrader?
Thanks
disiplinetrader
Quote from bmwhendrix:
A. Do you live in front of your computer? How do you know when a message has been posted and reply so quickly? I need to do whatever it is.
Thanks Anek for answering my question. I appreciate it. Yes I will wait for
the candle closure as you said and put stops just below the bright candle.
Also thanks low_hcp_golferfor the Ninja indicator. I will try and it see. But as
you said if it waits for 3 candles it might be late for scalping. Please let me
know how it works and if you come across anything similar to match Anek's bright
candles in Ninjatrader charts.
Thanks
DisciplineTrader
ES Scalps
Anek
Anek,
Thanks for the ES scalps chart. I took the Double top short (simulated but I
take simulation seriously) around 9:58 am on the chart at 1541.25 but kept stop
at 1543 (just above the arrow you drew on the double top area which is at
1542.50). I thought you place the stops just above the arrow in double top
setup.
So, if you get a double top setup like this you wait for the retracement to form
and then a bright candle and place stop just above the previous bright candle?
So, in this case, from your chart it appears you got around 1541.25 and placed
stop around 1542 ( and not above the middle arrow in double top). Is that
correct?
Thanks
DisciplineTrader
D,
I did not take the trade Double Top play because I had a long night but
definitely saw it on the chart when I loaded the platform a little after the
fact.
The stop goes in the mid point between entry (a close below mid swing) and a new
HOD, looks like it would had been close but still a great play.
Still, if the top is not taken, the top is obviously still there and you can
always get back in short, assuming price action has your back. The one thing you
can't see is a new high, if that happens, the pattern goes invalid.
Anek
In the spirit of sharing, Here is the Ninja code of Anek's paint bars. I
coded it for myself and its exactly what he has discussed.
Once you have created an empty indicator and make sure it calculates on
barclose, just copy and paste this.
I am also attaching the end of NQ day 1500 Volume bars today as reference.
cheers.
SS
protected override void OnBarUpdate()
{
if(CurrentBar < 2)
return;
if (Close[0] == Open[0])
BarColor = Color.Yellow;
else if (Close[0] > High[1])
BarColor = Color.DarkSeaGreen;
else if (Close[0] < Low[1])
BarColor = Color.Red;
else if (Close[0] > Open[0])
BarColor = Color.DarkGreen;
else if (Close[0] < Open[0])
BarColor = Color.Maroon;
}
here is the sample attached at the bottom.
Why I hate big stops
- A big stop by definition means you are not even sure of your entry signal
- A big stop promotes hoping and praying and not trading
- A big stop is gambling
- A big stop is for those refusing to take a loss, when losses are necessary in
successful trading
- A big stop creates the illusion of higher accuracy but in the end it only
results in a negative P/L
- A big stop prevents you from loading up because the drawdown can be monstrous
- A big stop is for those who fail to realize they can always get back in a
trade
Took me a long time to learn this, hope it takes you only a fraction.
....and yes this applies to daytrading not swing trading or investing.
Anek
Double top with bright candle pattern
Anek,
Thanks for replying back. I just had a few questions as to where you scale in, I
am asking them in attached picture. I saw your previous double top/bottom posts
and saw where you scale in . Just trying to find if you do anything different if
you also see a "bright candle scalp pattern". Please see the picture.
1) Do you just start scaling in as soon as double top pattern is triggered ( ES
goes below the mid swing low by one tick) ? For these do you keep stops around
midpoint between entry and the the recent double top that triggered the pattern,
is that correct? Is it like around 1543 if you had taken the trade.
2) I am trying to find out, with the double top pattern and followed by the
"bright candle scalp pattern" ( not sure if I named it correctly ), do you like
scale in only after seeing the red bright pattern? Or Do you like scale in more
with your initial scale in when Double top triggered.
3) Where do you keep the stops for this scale in after seeing the "bright candle
scalp pattern", is it just just above the previous bright candle or do you keep
it like around midpoint between entry and the the recent double top that
triggered the pattern.
I appreciate your time in answering these Anek.
Thanks
DisciplineTrader
D,
For entry signals a tick means nothing to me, a close below or above the tick is
what matters.
When the play is going my way, I scale out before clear "previous" known
resistance and support. If there is nothing remotely resembling that, I don't do
it unless i see evidence of a possible reversal formation, then I scale out and
adjust stop accordingly.
When it's clear resistance has become support or support became resistance I
might consider averaging up. Momentum must be there, no exception. Approximately
only 15% of trading days are heavy trending days so keep this into
consideration, not every day is optimal for averaging up unless a potent
reversal formation after massive exhaustion was spawned.
Lot of the things you asked have been asked before so keep on reading.
Anek
Thanks Anek for the quick reply back. I appreciate it. Sure I have some more
pages to read in this thread, will read them.
Also thanks Screenstruck for sharing the Ninja code for paint bars. If it is not
too much work, can you please post this file as an indicator attachment with
configurable colors option.
I need to learn to program Ninja, which looks like it is always better to learn
to program or modify the indicators to suit to oneself.
Thanks
Disciplinetrader
I don't know how to create bars that can be changed by user yet. Once you
figure it out let me know too!!
In the meanwhile you can just change the code bar colors to your liking and
recompile.
Here is an export you can import in.
you can import it by File > Utilities > Import NinjaScript to open the Import
NinjaScript dialog window
I dont want to get off the main theme of this thread.
cheers
SS
Thanks a lot Screenstruck. I appreciate it.
Sure, I will let you know once I figure out how to make colors configurable in
properties.
Thanks
DisciplineTrader
Quote from Anekdoten:
Why I hate big stops
- A big stop by definition means you are not even sure of your entry signal
- A big stop promotes hoping and praying and not trading
- A big stop is gambling
- A big stop is for those refusing to take a loss, when losses are necessary in successful trading
- A big stop creates the illusion of higher accuracy but in the end it only results in a negative P/L
- A big stop prevents you from loading up because the drawdown can be monstrous
- A big stop is for those who fail to realize they can always get back in a trade
Took me a long time to learn this, hope it takes you only a fraction.
....and yes this applies to daytrading not swing trading or investing.
Anek
Cx,
Price action always dictates where the stop goes, then you compare with your
notes and decide if it's something you should take or not.
For instance....
Say I see a double bottom with a furious mid swing in between. Making the stop
approximately 4 points (ES), that is quite a load in my book.
When that happens you got some decisions to make...
- Do I reduce car size to make up for the higher than usual stop ?
- Do I look for the next resistance point and see if the sky is clear for a
target of say 6 ? and readjust the stop to a safer place ?
- Do I say, screw this, I will take a trade with better odds ?
- Do I skip the DB and just wait until a trendline is developed and follow that
?
Decisions, decisions.....all in the name of preservation of capital.
Anek
The Best Trades
- The best trades work from the start
- The best trades got multiple signal confirmations
- The best trades offer no heat
- The best trades require small stops
- The best trades follow your trading plan
- The best trades develop momentum and acceleration after your position is in,
not before
- The best trades are simply when you are quick enough to spot the birth of a
new trend without actually being a contrarian
Now, wouldn't you like most of your trades to be like that ?
If so, shoot for the best trades and skip the rest.
Time for bed.
Anek
Quote from Anekdoten:
Cx,
Price action always dictates where the stop goes, then you compare with your notes and decide if it's something you should take or not.
For instance....
Say I see a double bottom with a furious mid swing in between. Making the stop approximately 4 points (ES), that is quite a load in my book.
When that happens you got some decisions to make...
- Do I reduce car size to make up for the higher than usual stop ?
- Do I look for the next resistance point and see if the sky is clear for a target of say 6 ? and readjust the stop to a safer place ?
- Do I say, screw this, I will take a trade with better odds ?
- Do I skip the DB and just wait until a trendline is developed and follow that ?
Decisions, decisions.....all in the name of preservation of capital.
Anek
This is a great post....All im going to say. He hit it right on the head.
__________________
"Be first to be second"
NQ begins the day with a triangle...
Crap! I completely whiffed on that DT! Normally I'd have been a little more
aggressive. Was looking for a little pullback and short entry but didn't find
anything that fit my risk profile. Ah well....hope some of you guys caught it!
![]()
Dtops dtops me like the dtops ![]()
Anek
Got a piece of it.....out on the test of yesterday's low.
![]()
Quote from low_hcp_golfer:
Got a piece of it.....out on the test of yesterday's low.
Got a piece of the ES short and did not have the speed to get the NQ but the
ER2 I got good.
Anek
DB @ ES ==>
~Cx
Quote from Anekdoten:
Low,
Check how the low point was the FIRST close above previous high.
Price action baby!
Anek
Low ,
he is reffering to the big black bar that closed above the Low of yesterday ,
the area where u exited the trade
EDIT he is trying to show u why there is no need for pivots etc.. since price
action tells the stoy
Anek,
Interesting thread, in fact one of the better ones here on ET.
I was wondering, do you look at the 10 year (ZN Z7) for confirmation of longer
trends? I have the ES, the ER2, TICKS and ZN up and I noticed that lately, the
ZN is nearly a perfect mirror to the trend in ES and ER2.
Thanks BB.
Looking at either a DT or an IHS on the NQ. Wait and see how it plays out.
![]()
yw low ,
looks like the IHS is almost there!
EDIT its broken , can anyone tell me where stop is at?
Try using the TL from the Head to the shoulder...I'm waiting for a PB to the TL then see what happens. I take too much heat taking the breakouts sometimes.
So is the way to play it is wait for the pb after the breaking of the neck line or to take the breakout with a stop at last swing low and trailing stops as tl moves ?
Ok so I took this DB play on the ES with a close above the middle swing. I am
out of it now. Anek, I was wondering where you would have exited this double
bottom play if you took the trade, or if you actually did take it where did you
exit??
~Cx
--Chart Attached--
Quote from bugsbunny:
So is the way to play it is wait for the pb after the breaking of the neck line or to take the breakout with a stop at last swing low and trailing stops as tl moves ?
Quote from Cxinvest:
Ok so I took this DB play on the ES with a close above the middle swing. I am out of it now. Anek, I was wondering where you would have exited this double bottom play if you took the trade, or if you actually did take it where did you exit??
~Cx
--Chart Attached--
Quote from Anekdoten:
Scaled out at the next obvious resistance level and now watching a possible head and shoulder formation as I trailed the stop. Either way it's a winner and possibly more to come, I dare you market!
Anek
Quote from Anekdoten:
Got a piece of the ES short and did not have the speed to get the NQ but the ER2 I got good.
Anek
Quote from monti1a:
Shorted 1-tick within high of ES Dtop..due to anticipation
Quote from Cxinvest:
What obvious level are you referring to?
~Cx
Cx,
Just a helpful hint.... ES traders love to fade a 50% retrace. It happens all
the time...many times right to the number. Just another tool if it helps.
Quote from Anekdoten:
I prefer confirmation from the trend but whatever makes you money should be good
Anek
Quote from Anekdoten:
Cx,
Look at it why do you think it stopped at the 40s...., it was the next level.
Anek
Looks like a big bear flag forming on the NQ.....maybe we see 2100 considering the 5 day average range is about 24 points. Just a thought.
getting hacked up on NQ after the drop , geez ..IHS , DT, DB, SYM triangle ,
Bear flag
I use the white backgound to print out charts sometimes.
__________________
Lets all drink to the death of a clown.
Quote from babe714:
getting hacked up on NQ after the drop , geez ..IHS , DT, DB, SYM triangle , Bear flag
Friday afternoon, low volume so choppy action. This has been described
before.
Vacation is officially on.
Stay safe and good trading.
Anek
Enjoy! ![]()
Quote from Anekdoten:
Friday afternoon, low volume so choppy action. This has been described before.
Vacation is officially on.
Stay safe and good trading.
Anek
Question For CX
Quote from Cxinvest:
Ok so I took this DB play on the ES with a close above the middle swing. I am out of it now. Anek, I was wondering where you would have exited this double bottom play if you took the trade, or if you actually did take it where did you exit??
~Cx
--Chart Attached--
Question on stops for followers of this thread. I am curious what others are
doing. I find that I am not consistent in my own trading.
1. Do you use a set # of points for initital stop, previous swing high/low or
some other criteria.
2. Do you move to a break even at some point, or let initital stop sit until you
have a swing high/low to move it to, or an exit signal?
3. When following the colors as Anec suggest, and not exiting untill there is a
close below the previous bar of the trend, how do you decide whether to exit at
that point or to sit through a small pullback with expectation of adding a
position?
4. When adding do you add on a trendline break of the pullback or wait for a
break of the last high/low?
Great Weekend to All!
Quote from bmwhendrix:
Question on stops for followers of this thread. I am curious what others are doing. I find that I am not consistent in my own trading.
1. Do you use a set # of points for initital stop, previous swing high/low or some other criteria.
2. Do you move to a break even at some point, or let initital stop sit until you have a swing high/low to move it to, or an exit signal?
3. When following the colors as Anec suggest, and not exiting untill there is a close below the previous bar of the trend, how do you decide whether to exit at that point or to sit through a small pullback with expectation of adding a position?
4. When adding do you add on a trendline break of the pullback or wait for a break of the last high/low?
Great Weekend to All!
Quote from low_hcp_golfer:
3. if you get a close below a previous bar that has broken the TL = exit
4. i don't add-on but a close above/below the last high/low after a bounce off the TL is where i would.
A. Looking at head and shoulder formations, sometimes they set up with the
right shoulder higher than the left. Sometimes I see the neckline drawn at an
upward angle because of this. Some charts like the one you posted on 9/11 have
this type of angled neckline, but you drew your neckline horizontal from the
left shoulder low. Is this the way you always play them?
Enjoy your day!
D.
Quote from bmwhendrix:
A. Looking at head and shoulder formations, sometimes they set up with the right shoulder higher than the left. Sometimes I see the neckline drawn at an upward angle because of this. Some charts like the one you posted on 9/11 have this type of angled neckline, but you drew your neckline horizontal from the left shoulder low. Is this the way you always play them?
Enjoy your day!
D.
After that first updraft, all of a sudden it's turned pretty messy on the NQ...
Scaling out of the ER2 Swing play from all average ins at 822-823
Waiting now for the Bull Flag breakout to fortify the position or take my
profits in case of failure.
Anek
The thread has become quite long.
Any progress on FAQ ?
Thanks
__________________
A Candle Loses Nothing By Lighting Another Candle
I am reading the thread from beginning and after two days I have come upto
page 200.
I came across ELD. What is this.
It would be much helpful (this is a request) if abbreviations are not used.
Thanks
__________________
A Candle Loses Nothing By Lighting Another Candle
Quote from osho67:
I came across ELD. What is this.
Scaled out some more ER2 at 825.90
Need to examine the close of the daily bar to decide how I proceed with the rest
or if I intensify on an official bull flag confirmation, then one I entered
early based on price action speculation.
Turned out to be a nice swing.
Last night I found nothing but bearish posts as to how financials and the double
tops would create a Black Monday. Tons of October horror stories.
Once again why I wipe my butt with the news and just follow the charts.
All you got to do is follow price action.
You want to short the tops, that's fine but at least wait for confirmation
which is my number one rule and the one most seem NOT to use in the ET forums.
In the meantime, please allow me to say CA$HING as I secure the profits.
Trend is your friend until it ends.
Back to skiing.......
Anek
That was a nice break on NQ's D top failure.
I'm trying to discipline myself where channels form. Once I see Confirmation of
a channel, I just sit tight until it's broken.
Easier said than done but I'm getting better.
This helps prevent me from over-trading.
-Tech
Another scale out on the ER2 at 830, filled at 829.90
One fourth of the position still left.
Anek
Anek,
I saw the ER2 chart you posted on 9/25, where you mentioned you were considering
a long swing trade. Can you please specify the reason for the swing trade
initiation. Sorry, if I am missing anything obvious.
Thanks
Disciplinetrader
Quote from disciplinetrade:
Anek,
I saw the ER2 chart you posted on 9/25, where you mentioned you were considering a long swing trade. Can you please specify the reason for the swing trade initiation. Sorry, if I am missing anything obvious.
Thanks
Disciplinetrader
Thanks Anek. I see what you are saying.
If possible can you post your chart to show where you scaled in and scaled out
for this ER2 trade.
Thanks
DisciplineTrader.
D,
The scale outs were posted on the journal.
Anek
ER2 Update
Trendline break, rounding tops, closing the trade at 828.20.
Will look to re-ride the ER2 bull flag on the first strategic retracement
possible, if any, on a future day.
Taking time off trading and the journal.
Anek
First day of trading with AHG.
Been reading the journal for a few days now (allmost read it twice).
NQ: 2 wins/2 losses, just traded for the last 2 hours. 9t net profit. Chart
included.
It's a new but I understand the idea of LL, LH, HL, HH. Entry and exit is
something I still need to learn.
Great thread Anek, but I don't need to tell you that when I read all the
comments!
Would love some more detail on interpreting Time&Sales. I have been watching it
in the past but never could really 'get' it.
R,
I'm posting this while sneaking as I'm in vacation and wife is not too happy
about trading off a resort ![]()
When you are looking for a retracement in a clear uptrend you also want some
sort of strength confirmation to avoid buying a falling knife or a retracement
that is not yet complete.
Obviously, reverse for shorts.
In order to facilitate this task I suggest you wait for a bar closing above
previous bar high as a sign of strength and a bar closing below previous bar low
as a sign of weakness. Once again, everything with the trend.
Is there a trend ?
Yes
What is it ?
It's long
Is it retracing ?
Yes
Has it printed a bar closing above previous bar high (strength) after retracing
considerably without breaking major support or pivot swing ?
Yes
Where does the stop goes ?
A few ticks below the strong bar should do because you can always re-enter in
case of noise or fakes.
Remember, I love my small stops as it is not about being right but about making
money.
Hope it helps.
Anek
Quote from Anekdoten:
R,
I'm posting this while sneaking as I'm in vacation and wife is not too happy about trading off a resort
Quote from Anekdoten:
Someone is paying attention in class.....
Back to skiing
Anek
Tnx for the answer Anek, wise words once more!
I hope you have a great time on vacation and spoil your wife! She deserves it!
Hope I can learn and contribute to the thread!
Quote from Anekdoten:
R,
I'm posting this while sneaking as I'm in vacation and wife is not too happy about trading off a resort
When you are looking for a retracement in a clear uptrend you also want some sort of strength confirmation to avoid buying a falling knife or a retracement that is not yet complete.
Obviously, reverse for shorts.
In order to facilitate this task I suggest you wait for a bar closing above previous bar high as a sign of strength and a bar closing below previous bar low as a sign of weakness. Once again, everything with the trend.
Is there a trend ?
Yes
What is it ?
It's long
Is it retracing ?
Yes
Has it printed a bar closing above previous bar high (strength) after retracing considerably without breaking major support or pivot swing ?
Yes
Where does the stop goes ?
A few ticks below the strong bar should do because you can always re-enter in case of noise or fakes.
Remember, I love my small stops as it is not about being right but about making money.
Hope it helps.
Anek
From now on please refer to bars closing above previous bar high as Strong
Bars and bars closing below previous bar low as Weak Bars. This
should bring some clarity to price action discussions.
Just had a nice Swiss Fondue followed by some frozen Margaritas. Wife asleep so
it looks like it's Pay Per View and the ladies of Venus
![]() ! muahahaha
! muahahaha
Remember that eventhough the market could possibly continue it's rally tomorrow
or even retrace it all (only God knows) after a wide range day the possibility
of choppyness is high.
Stay alert and be patient. The hardest part of AHG is identifying the chop and
staying on the sidelines, the rest is trading with the trend using small stops
and letting the winners run purely on price action.
Good trading to all.
Anek
Chop chop chop chop chop chop -----------
~Cx
Anek, am new to this thread and although I hv read a good deal of it, I could not find if you enter on stop, limits or market orders.
Quote from Anekdoten:
From now on please refer to bars closing above previous bar high as Strong Bars and bars closing below previous bar low as Weak Bars. This should bring some clarity to price action discussions.
Anek
Quote from jack411:
This would be opposite for downtrend though right?
Quote from stophunter:
Anek, am new to this thread and although I hv read a good deal of it, I could not find if you enter on stop, limits or market orders.
Quote from rverheyen:
It's mentioned twice in the thread.
Entry and target are limit orders, stops are market orders.
I'm looking for screenshots of a fairly normal chart type (ie no 1 tick or 10
share charts) for any of the e-minis that has the following:
"M" Formation at the bottom
"W" Formation at the top
(they must not be on the same chart)
The more the merrier.
Thank you for your help, you can post the screenshots in the journal.
Anek
Hi Anek,
The evening star pattern you marked on the today's NQ chart around 10:15, can
you please tell me is it what you look for in reversal.
I searched in google and found the standard evening star pattern. For this
pattern, the range of the "star" should be small, is that correct?
Can you please tell what kind of candlestick reversal patterns you use. Is the
evening star pattern as strong as a double top pattern?
Thanks
DisciplineTrader
The tail is a sign of selling (in this example) -- it can also be seen as a
failure to move in the intended direction.
Keep an eye on these failed poke bars -- it is a good place to go fishing.
D,
The shooting star was just an extra confirmation, nothing else.
I was looking for weakness, found it, took it, done.
Anek
M and W formations
Here are two of each.
How do i do multiple attachments in one reply?
Bbox,
First of all, thank you for the chart.
On the chart I see the usual M at the top and a W at the bottom.
I'm actually looking for the absurd, an M at the bottom and a W at the top.
Anek
.
Ahh...rereading I see.
So basically a triple top and bottom.
Here is the pattern.
Anek
I wonder if there is anyone out there that knows why I'm studying these two
patterns.
Curious to know if someone sees what I see.....
Anek
Here's one, but maybe you want a broader picture.
Sorry Box, I don't see it either on that chart .
Anek
See, looks like an "M" to me. But maybe not what you're looking for.
Box,
The M I'm after is 3 completed swings, the two outer ones are higher than the
middle one.
You know how a head and shoulder has the middle swing higher than the outer ones
? Well this is exactly the opposite.
Thanks for trying.
Anek
I remember seeing a stock screener that allowed you to draw a picture, and the screener would look for charts that matched the picture. Not futures, but ...
I'd hazard a guess that near the top you're looking for an uptrend that makes
a pullback into a double bottom and a break upwards for a continuation of the
uptrend.
Near the bottom it would be a downtrend making a pullback into a double top and
breaking downwards for a continuation of the downtrend.
stockfetcher.com
at the bottom..."pattern matching" tab
Short-term Pattern Matching
Quote from fruitbowl4u:
I'd hazard a guess that near the top you're looking for an uptrend that makes a pullback into a double bottom and a break upwards for a continuation of the uptrend.
Near the bottom it would be a downtrend making a pullback into a double top and breaking downwards for a continuation of the downtrend.
Quote from Bbox_trader:
stockfetcher.com
at the bottom..."pattern matching" tab
Short-term Pattern Matching
Hi Anek,
Just a try to interpret the M pattern near a bottom.
When an "M" forms near the bottom, the middle of the M looks like a double
bottom, if you take the long after price moves above the mid swing high, you get
stopped out at previous swing high (the start of the M). SO, price is basically
respecting the s/r level and shoots down to the support level ( which started
from M forming). So, price is like sandwiched between the M. Either price goes
into consolidation.
Or if price wants to go high, we can read the whole "M" as a double bottom (with
the bottom near the lowest support near start of M not the middle part of M) and
if it has to come out of this M zone, it has to break the top part of M. When we
see a bar close above this M, we can enter a long trade, similar to a double
bottom trade. The up move after this M bottom will be very explosive.
Please let me know if I am correct or partially correct atleast.
Thanks
DisciplineTrader
D,
That's a good logical explanation on price action within the pattern formation
and how to approach it.
However, it is not the reason of my interest.
Good effort my friend.
Anek
Anek,
Here's a wild shot.
Looking at your bottom pattern I see
many s/r levels. Would this be excellent indication of a chop zone? So then I'd
sit on my hands while price is within this bottom M?
I realize this doesn't address the top and bottom aspect.
-Tech
Quote from Techdoodle:
Anek,
Here's a wild shot.
Looking at your bottom pattern I see
many s/r levels. Would this be excellent indication of a chop zone? So then I'd sit on my hands while price is within this bottom M?
I realize this doesn't address the top and bottom aspect.
-Tech
Here is the an M-Bottom, rare as 90 year old virgins.
Anek
An M at the bottom and a W at the top are exceedingly rare.... and they
signify continuation of prior trend after congestion which is the exact opposite
of double top and bottom.
Haven't found the images to satisfy you yet.
p.s. if this is a correct answer do I get a free hour of mentoring?
![]()
cheers
SS
Quote from screenstruck:
An M at the bottom and a W at the top are exceedingly rare.... and they signify denunciation of prior trend after congestion.
havent found the images to satisfy you yet.
p.s. if this is a correct answer do I get a free hour of mentoring?
cheers
SS
sorry i meant continuation.... edited my post above
Quote from screenstruck:
sorry i meant continuation
darn.... thats the best i gleaned from suri
![]()
Quote from screenstruck:
darn.... thats the best i gleaned from suri
Great journal Anek. Thanks a lot for sharing.
Is what you are looking for, in a way, a failed double top and failed DB?
Very rare, therefore DB and DT are very accurate?
my 2c
MomoNY.
Quote from Anekdoten:
Suri speaks about them and he even says that the M at the bottom and the W at the top is very rare but that's as far as he goes .
Great book btw glad you got it.
Anek
Quote from momoNY:
Great journal Anek. Thanks a lot for sharing.
Is what you are looking for, in a way, a failed double top and failed DB?
Very rare, therefore DB and DT are very accurate?
my 2c
MomoNY.
Anek, is it because it represents a final exhaution move (blowoff top or bottom) before a significant reversal?
A. Here ya go! DJIA daily, W or M?
A. Better on ES............Overnight drop looks suggestive...
Not related to the answer but here is a good example.
A "W" at the top on the daily ES.
Anek
W top just now in the NQ. Or atleast that's what it looks like to me.
Hiya Anek,
I think there may be a W at the top of the YM right now (well, 5 minutes ago)...
Anyhoo, I don't know if this is the answer, it's prolly a bit simplistic, but
I'll take a stab: the two equal points of the W or the M represent a point of
support or resistance. It becomes a high probability play because of the known
point?
Ws and Ms at the top and bottom represent Double Top and Double Bottom failure,
which is something that is high probability too?
quote from earlier in the journal...
Not long ago I posted an example on how to ride failures, very powerful stuff as
you enter with the trend while most traders are all shook up. It is your duty to
readjust your mindset INSTANTLY so you don't become a dead duck, like the rest.
This can also be applied to failed head and shoulders and numerous other known
patterns. Do not be afraid of small losses.
Basically, as soon as that support is taken, on the first retracement (not too
long) wait for a sign of exhaustion, this will help you avoid some of the fake
calls. Something like, breaks, pops, a
micro lower low (assuming double bottom failure) and off you go. Use a trendline
and highs/lows to guide yourself, once again, be greedy, failure or not these
are not scalp types.
Quote from cirekindob:
W top just now in the NQ. Or atleast that's what it looks like to me.
X,
Once again that's another perfectly valid logical explanation of the price
action but it does not explain why I'm so interested in the rareness aspect of
them.
Anek
Quote from xiaodre:
Hiya Anek,
I think there may be a W at the top of the YM right now (well, 5 minutes ago)...
Anyhoo, I don't know if this is the answer, it's prolly a bit simplistic, but I'll take a stab: the two equal points of the W or the M represent a point of support or resistance. It becomes a high probability play because of the known point?
Ws and Ms at the top and bottom represent Double Top and Double Bottom failure, which is something that is high probability too?
quote from earlier in the journal...
Not long ago I posted an example on how to ride failures, very powerful stuff as you enter with the trend while most traders are all shook up. It is your duty to readjust your mindset INSTANTLY so you don't become a dead duck, like the rest. This can also be applied to failed head and shoulders and numerous other known patterns. Do not be afraid of small losses.
Basically, as soon as that support is taken, on the first retracement (not too long) wait for a sign of exhaustion, this will help you avoid some of the fake calls. Something like, breaks, pops, a
micro lower low (assuming double bottom failure) and off you go. Use a trendline and highs/lows to guide yourself, once again, be greedy, failure or not these are not scalp types.
Looks like Daily KSM W
This might be very stupid question. Can AHG strategy be used for always being
in the market. Depending on the close of the previous bar you do a buy or sell
and reverse the trade when the next bar reverses. You use very tight stop losses
so that you have all the time small profits and small losses but eventually you
will have a big profit and you will never have a big loss because of stops.
Is this idea ridiculous or workable. ?
__________________
A Candle Loses Nothing By Lighting Another Candle
osho, I don't think so because I believe AHG is trend following in nature,
and being high probability means going with the trend, and not trading against
the trend.
Trading against the trend is also called picking up nickels in front of freight
trains (going short in an uptrend), and catching falling knives (going long in a
downtrend).
Even if it looks like you are in the market all the time, you prolly just have a
shorter timeframe, and you are still trading the setups with the trend...
I could be wrong, though
Osho,
Absolutely not.
You avoid the chop or lack of meaningful direction at all times.
....and in this journal, there are no stupid questions.
Anek
ES W bottom worked
ES Uptrend retracements worked
NQ Uptrend retracements worked
NQ Double Top working
...it's all good !
Anek
Quote from Rn86:
Looks like Daily KSM W
NQ DTOP in the bag!
Anek
Quote from Anekdoten:
ES W bottom worked
ES Uptrend retracements worked
NQ Uptrend retracements worked
NQ Double Top working
...it's all good !
Anek
Quote from Techdoodle:
Great!
I'm certainly not getting it.
Practice practice practice. I keep getting stopped out.
I fall victim of tightening my stops. This is due to getting hit by wider stops. I took the NQ DT mid swing break, but I placed stop way to aggressively.
Question,
Do you use strong and weak bars to identify the trend? As confirmation of a HH, etc?
My eyes have difficulty seeing things that are there and no difficulty seein thing that are not there.
-Tech
A question for A, P, and all.
If and when you start to "click" with good identification of patterns, do you
find it is because you go though specific rules that are ingrained as
successful, or do you find yourself having the 'feel' for the chart?
-Tech
Quote from Anekdoten:
Im sure you know where the stop on DB and DT goes, you prob changed the rules
Strong and Weak bars I only use as entries for retracements and as alerts when scaling out or getting back in.
Anek
A. ON that NQ drop, did you bail before a higher close?![]()
Quote from Techdoodle:
A question for A, P, and all.
If and when you start to "click" with good identification of patterns, do you find it is because you go though specific rules that are ingrained as successful, or do you find yourself having the 'feel' for the chart?
-Tech
Quote from bmwhendrix:
A. ON that NQ drop, did you bail before a higher close?
Watch this NQ mini DB carefully.....looks like its failing.
Anek
YM looks like its putting in a double bottom
Nevermind!! ![]()
...and failed it did.
What do we do we failed DBs ?
We ride them baby!
Anek ![]()
Strong bar at the bottom, out for now.
Anek
Time & Sales are still a mistery for me.
In an uptrend is it ok to wait for a strong bar after a pullback for entry?
Or should I use the Stochas for entry instead?
What would be the lesser evil?
I still keep T&S on my desktop for study but for now it's useless for me.
Quote from rverheyen:
Time & Sales are still a mistery for me.
In an uptrend is it ok to wait for a strong bar after a pullback for entry?
Or should I use the Stochas for entry instead?
What would be the lesser evil?
I still keep T&S on my desktop for study but for now it's useless for me.
Quote from rverheyen:
Time & Sales are still a mistery for me.
In an uptrend is it ok to wait for a strong bar after a pullback for entry?
Or should I use the Stochas for entry instead?
What would be the lesser evil?
I still keep T&S on my desktop for study but for now it's useless for me.
Thank you Anekdoten
Anekdoten,
Thank you, that is the only way I can commence this post. This is the best
thread about daytrading not only in the ET forums but on the net, books
included. The stuff you teach I do not see in those 69.99 books I buy in Barnes
and Nobles.
I never thought this could be possible but I´m finally getting it and getting it
good. Big time excited about my trading and sometimes a deep breath is necessary
because I get the feeling I a living a dream but afraid of waking up.
Passionately, I´ve been following your journal for several months now on paper,
trading ideas, using simulators and today marks my consecutive fourth week of
trading live with cash.
Done very well, only three losing days, small too, and the rest has been nothing
but winners in all kinds of ranges.
My family and I keep a hard copy of your posts so we know exactly what your
suggestion would be unless we have a new question. I now feel I´m ready to bump
the number of contracts from two to three. We started with two so we could scale
out at resistance and support or scale in on strong trends.
You keep saying time after time that identifying the chop correctly is the key
to successfull trading with AHG. Aside from believing in it and yourself I
cannot agree more.
To those still struggling you need to believe in yourself and in the system.
Once this is acccomplished it becomes a reality.
At night I examine the multiple day charts to determine the significant areas of
support and resistance.
The next day I watch how price reacts between all these important points and if
a trend is developed. I then patiently wait for retracements and whenever I see
an opportunity I strike like an eagle. Using trendlines and bar price action all
the time is extremely and powerful in determing strength or weakness, fakes too.
Price likes to fly swiftly from key area to the next, this is priceless for
riding the good trades but some homework must be done at night so you have a
clear understanding of the chart radius. The combo of price action with some of
the basic patterns you teach us takes trading to a whole new level.
Hopefully you will not get tired of this journal for at least a very long time.
Fingers crossed.
Okay, this post is getting way too long when the intention was only to express
my sincere gratitute. Your kindness will never be forgotten and if you ever come
to the San Francisco area I would love to treat you for dinner and share a
bottle of wine in appreciation of your timeless dedication in helping traders
like myself.
You changed my trading aroud, THANK YOU!
Daniel S.
Quote from Rn86:
Time and sales required screen time. A lot of screen time. It is essential for day trading in my opinion......
I think recording real time tape and plain price action and then review would be the best way to learn. At least it worked for me and for few other traders.
Good tape suggestion by RN.
One thing I can add to this is that when momentum is ready time and sales has a
peculiarity of becoming "nervous".
It's hard to explain but think of a kid with too much sugar, the jumpy action is
a sign of momentum to come.
Anek
Re: Thank you Anekdoten
Daniel,
Send me a PM when you read this, and thank you for your encouraging post.
Anek
Quote from monti1a:
Mediacam by netu2 has a nice screen capture program that I use...http://www.netu2.com/
Record the tape around support and resistance levels and watch how the market acts around those levels...keep in mind..the market can ONLY go up or down on market orders....
Quote from Anekdoten:
Monti,
Is this similar to Camtasia, Fraps and video recording software ?
Thanks.
Anek
Quote from Anekdoten:
Good tape suggestion by RN.
One thing I can add to this is that when momentum is ready time and sales has a peculiarity of becoming "nervous".
It's hard to explain but think of a kid with too much sugar, the jumpy action is a sign of momentum to come.
Anek
Quote from monti1a:
A.
I also notice the action that you speak of....I, however, liken it to someone who has diarrhea.....
Hey Frankenstein (when you read this),
Wake up!
Having problems with the IM.
88% accuracy, ER2 a tad lower (.07%), need ES asap, thanks.
Send me ES please via email, attached is NQ
![]()
Anek
PS: Journal readers please disregard this post, personal project.
Hi Anek,
The recent chart looks distinct.
Can you please comment on how you get the bottom blue/red dots? Is this like a
TRO modification?
Thanks
DisciplineTrader
Strength quality of the swings, listen to price action
Attached find a few price action explanations on today's NQ chart.
Listening to what price is telling you is extremely important.
Did not cover all the possible good plays just the ones that merit explanation.
Hope it helps.
Anek
Quote from disciplinetrade:
Hi Anek,
The recent chart looks distinct.
Can you please comment on how you get the bottom blue/red dots? Is this like a TRO modification?
Thanks
DisciplineTrader
great chart anek, thanks
very helpful
![]()
Quote from BigBubba:
great chart anek, thanks
very helpful
W bottoms and M tops
Posted this elsewhere but just in case look how simple this was.
Kindergarden stuff actually.
The funny part is that I'm getting PMs from people telling me to stop posting
false hopes and that I'm full of it.
Can't help you all, that's for sure.
Anek
The warden is roaming, good night all.
Anek
False hopes? Are they crazy??
![]()
Quote from Anekdoten:
The funny part is that I'm getting PMs from people telling me to stop posting false hopes and that I'm full of it.
Anek
Quote from low_hcp_golfer:
Idiots...
Quote from Anekdoten:
W bottoms and M tops
Posted this elsewhere but just in case look how simple this was.
Kindergarden stuff actually.
The funny part is that I'm getting PMs from people telling me to stop posting false hopes and that I'm full of it.
Can't help you all, that's for sure.
Anek
Quote from jack411:
Sorry, I'm not seeing where you posted elsewhere about W bottoms and M tops. Was it awhile ago? I usually don't miss any posts.
What are the reasons for the entries/exits on the chart that goes along with being Ws and Ms? And what are the larger red circles for?
Sorry, I feel like I may have missed something.
Quote from monti1a:
A.
I also notice the action that you speak of....I, however, liken it to someone who has diarrhea.....
Anek - I am a swing equities trader but somehow managed to stumble upon your
journal.
Lo and behold your style is VERY close to what I do now. Just want to make a
comment that your journal has been very helpful to me. Although I trade
interday, the stocks i trade look a lot like what your good days look like. As
such, I implemented the same stoch settings which I have never used before.
Also, have been starting demo trading futures. Will be attempting to combine
some of my settings with yours and demotrade a few days this weekend.
Once again, thanks for everything. You have helped me more than you can imagine
probably. It's difficult to describe... but the style is perfect for what I know
and my style.
Kid,
Glad to hear that, feel free to post your equities chart/ideas here as well.
Anek
Price action combined with TL's, s/r levels, and pivots is king. I am seeing
this more and more clearly everyday though I have so much to learn.
Up 600 just in the first hr of market open. Still on the Ninja simulator. I did
8 scalps on the ER... 4 winners, 3 losers, and 1 breakeven.
I want to post a chart of my trades but still trying to figure out if i can
print screen a portion of my desktop. Gotta head out to work soon so i guess
i'll figure it out after work today.
Anyhow, thanks so much Anekdoten and your journal. I am almost ready to go live
with real money and take my trading to the next level!
ES Morning
Calling it day, not trading the afternoon.
As Daniel pointed yesterday, price has a tendency to jump from one key area to
the next without much problems. The real observation should be done when it is
actually *at* a key area.
Some people use Pivots I like to be more precise and use support and resistance
areas instead.
Anek
Xcel,
Glad to hear that.
Start very slow and don't forget to work on the "Spotting the chop" skill, it
will serve you well.
It's no joke that sometimes the best trade is no trade at all.
Anek
Anek,
I know what you mean when you talk about sitting on your hands. In about 1 hr I
did 8 scalps doing 1 and 2 lots, which is probably the number of trades people
do in a whole day. Looking back, I know that 2 of my trades today were
"undisciplined" trades.
Hand sitting is still a work in progress in this game for me.
What does AHG stand for?
Quote from thesniper:
What does AHG stand for?
Quote from Anekdoten:
ES Morning
Calling it day, not trading the afternoon.
As Daniel pointed yesterday, price has a tendency to jump from one key area to the next without much problems. The real observation should be done when it is actually *at* a key area.
Some people use Pivots I like to be more precise and use support and resistance areas instead.
Anek
Quote from Cxinvest:
The quote box in the top right that states "Once again, not when last high was lower" -- not when is referring to what? Vague.
~Cx
Quote from low_hcp_golfer:
Cx,
I believe Anek meant "Once again, as you've already been taught, not when last high was lower".
That's how I took it.
Edit: the "not when" meant don't buy again even though we were still above the TL because the last high was lower.
Quote from low_hcp_golfer:
Cx,
I believe Anek meant "Once again, as you've already been taught, not when last high was lower".
That's how I took it.
Edit: the "not when" meant don't buy again even though we were still above the TL because the last high was lower.
Triangle setting up...
EDIT: this is on the YM (why I am back to it, I dunno...comfort?)
Quote from Cxinvest:
Yea, so just re-instating the obvious I guess.
~Cx
Hi Anek,
Just wanted to ask, besides FOMC days, would you happen to know what
announcements mean volatility for the futures markets?
Reason I'm asking is, man, the volume is gone today...was wondering if someone
was speaking or something...
Anek, is that a "m" formation forming on the 1000 er2 chart?
Employment situation friday is the one that will send us moving one direction or the other
Quote from xiaodre:
Hi Anek,
Just wanted to ask, besides FOMC days, would you happen to know what announcements mean volatility for the futures markets?
Reason I'm asking is, man, the volume is gone today...was wondering if someone was speaking or something...
Hi everyone,
I've been lurking for a while and this thread has been very helpful for
improving my entries lately (Piscuy's posts especially caught my eye because I
scalp a similar style that he does, except nowhere near as experienced yet, so I
exchanged PM's with him a bit. He suggested that I post here since I might get
some interesting responses... and yeah, I'll try to post some charts of my
scalps some time soon when I get the chance).
I'm not trying to come across as an expert in any way, I've only been trading
for about a year and am currently at a prop firm. I'd still consider myself
somewhat of a beginner and I consider this an ongoing quest for knowledge and
ways to improve my skills on a daily basis. I know there are a lot of varying
opinions on trading styles and especially on scalping at the pace that I do (and
I realize that some of my techniques are probably less practical if you trade
retail but I hope my ideas can still help in one way or another). I'm posting
this in case it may help anyone else or if anyone with more experience in this
style has criticisms or comments.
I scalp fairly short time frames (usually 2 to 15 minute positions) and mostly
concentrate on price action (charts, time and sales ... I do use simple moving
averages but not for the crossings that most people do, just more of a quick
visual reference of uptrend/downtrend/range). The last few days have been a lot
better (small wins, small losses, a couple big wins... basically what all
scalpers look for).
The last couple of days, I've just been contemplating new ideas for my
position-sizing. I know this is something Anekdoten mentioned right on the 1st
post of this thread but I'm still part way through reading the rest so I'm not
sure if it's been addressed since then. Basically it's the averaging-UP (not
down) approach that he mentioned
Again, this is just an idea, I haven't started doing it this way yet:
Say your full position size is normally 4 contracts (I also trade equities a lot
so this same idea can be applied to say 1000 shares or whatever). But when you
see a setup and you've decided on your entry and stop, you just enter with 1 or
2 contracts first, not all 4. If you're wrong, you can stop out and you'd only
be locking in the loss generated by those 1 or 2 contracts. If you're right, you
can punch in with more contracts within a few ticks in your favor to make your
full position of 4 (but here's the key: you now move your absolute maximum
"mental stop" to your break-even point)...
So after this, any further profits should be amplified by your full position
size, but any of your losing trades should only be with 1 or 2 contracts. Now,
even your "so-so" win/loss days should come out at least a little more
profitable in the long run... in theory.
If anyone has any opinions on this idea (or if anyone is already using this and
has comments on how well it works), I'd love to hear from you. I know it's
probably not entirely original but I thought it'd be worth discussing since it
might inspire some new ideas and applications for it too.
On a side note, I do already use a position sizing strategy but not that one. I
just take full positions and get out in pieces during winning trades to lock in
early profits just in case it loses momentum early, and move my mental stop to
the break-even point. I've just been thinking of new ways to improve on this if
possible, that's the main reason Anekdoten's mention of averaging up sparked
some ideas.
(It might be worth noting that my prop firm has a CME membership and special
discounts with a few of the ECNs for NYSE and NASDAQ issues, so my transaction
costs are fairly low and I always use limit orders entered right at the moment I
feel the entry and hit the bid/ask so I don't use market orders for any of this,
ever. It did occur to me that the transaction costs of implementing this idea
would be an issue if you trade retail, but I guess maybe someone on brokerage
like IB might be able to pull it off with equities, I'm not sure.)
Anyway, thanks to everyone who's contributed to this thread! It's helped me
become more consistent lately.
-evsloth
Quote from evsloth:
The last couple of days, I've just been contemplating new ideas for my position-sizing. I know this is something Anekdoten mentioned right on the 1st post of this thread but I'm still part way through reading the rest so I'm not sure if it's been addressed since then. Basically it's the averaging-UP (not down) approach that he mentioned
Again, this is just an idea, I haven't started doing it this way yet:
Say your full position size is normally 4 contracts (I also trade equities a lot so this same idea can be applied to say 1000 shares or whatever). But when you see a setup and you've decided on your entry and stop, you just enter with 1 or 2 contracts first, not all 4. If you're wrong, you can stop out and you'd only be locking in the loss generated by those 1 or 2 contracts. If you're right, you can punch in with more contracts within a few ticks in your favor to make your full position of 4 (but here's the key: you now move your absolute maximum "mental stop" to your break-even point)...
So after this, any further profits should be amplified by your full position size, but any of your losing trades should only be with 1 or 2 contracts. Now, even your "so-so" win/loss days should come out at least a little more profitable in the long run... in theory.
If anyone has any opinions on this idea (or if anyone is already using this and has comments on how well it works), I'd love to hear from you. I know it's probably not entirely original but I thought it'd be worth discussing since it might inspire some new ideas and applications for it too.
-evsloth
__________________
Boib
Its easy to make a small fortune if you start with a big one
Boib,
One great start, non exclusive, for an averaging up approach is a reversal
formation at the LOD or HOD.
Study reversal formations very carefully.
ie Double Tops, Double Bottoms, M tops, W botoms, V bottoms, Triple and
Rectangles.
As soon as you get confirmation begin your average up approach with a minimal
position.
Add on every possible pullback before the next major support or
resistance area as soon as a strong/weak bar is evident once the retracement
looks exhausted.
Sell/Cover it all around the next significant support or resistance point or
partial.
If resistance becomes support or support becomes resistance you can begin all
over again with your minimal position or can continue adding to what it is still
in play provided that you have a change of a trend trailing stop protecting
every add and of course, past profits.
Confirmation is an insurance card, use it accordingly but make it a requirement
for every move you make, whether it is entry or exit.
Every trade should be an educated prediction and every add should be an
additional confirmation.
The more confirmations the more your car size should increase because at first
we never really know where price will go but as we get additional data
supporting our original trade theory, the story starts revealing itself.
As you well know this method promotes small losses and all kinds of winners from
miniature to gigantic. It is no coincidence that it is chop proof because if you
get no additional confirmations you stand on the sidelines with your small
position. This method will also help you avoid calling tops and bottoms because
in the back of your mind you don't want it to end, this can be a very powerful
psychological asset.
The absolute key to mega profitable consistent trading is having the skill to
spot the birth of a new trend correctly and playing it responsibly with solid
money management.
Hope it helps and glad to hear you are doing well.
Anek
Quote from Boib:
I trade in a similar way although I would not consider myself a scalper.
Where most people I know tend to take a full position then scale out, I usually enter with 1 contract and add if it moves in my favor.
I trade only YM. Once a trade has moved 10 to 20 points in my favor I will ad another contract and move my stop to break even. I will keep adding until the trend line is violated.
The downside is a lot of break even trades. The upside is on trending days I do quite well and on choppy days my losses are minimal.
There are lots of days that if I had scaled out at plus 10 and moved my stop to break even I would have many small winning trades, however my losers would have been 3 or 4 times the losers. 4 cars @ a ten point loss means you need 4 trades that go to plus 10 before they back off. Even if trading 2 contracts you need a couple winners for each loser.
I use a system similar to Anek. Once a trend is established I will stay with it until it changes. I’m rarely in at the start of the move and usually leave a bit on the table. I agree with other posters who state that entry and exits are only a small part of an overall trading plan. Discipline and money management also have to be considered.
This is by far the best thread ever on ET.
I am sure that I simply forgot the details, but hopefully someone can still
answer. I have read up to page 88 actually so im sure I just have forgotten it
in the flurry of reading.
I usually enter on the break of the low / high (either going short or long with
the trend) when decent r/w is presented as well as volume dries up. To short i
look for lots of reversal candlesticks and a narrow range bar to make entry
cleaner/better probability. For long, opposite.
I noticed a lot of the entries that I would have taken you would have ignored
and I would have stopped out sometimes. Although... sometimes I got better
entries. The volume charts don't seem to provide as clean candles as I get with
the equities I look at using time charts, so I'm somewhat puzzled.
From what I saw in the charts you wait for a confirming candlestick to show that
price action is ready to turn. Basic candlestick analysis is what it appears to
me. Do you wait for the bar to finish? I prefer just price for entry... although
I was better able to follow your charts when it had the stoch.
Sorry if this question has been asked or if its a little convoluted. It's as
best as I can explain it...
I do not really feel qualified to post here, although if you wish to see my
crumby stock picks I will post them
![]() .
.
I will post some trades this weekend as well after I paper trade ES on replay.
Kid,
Price action is used to increase the odds when looking for an entry during
retracements.
I have my methods, use whatever you feel comfortable with.
Anek
In this case I am actually wondering what you use.
Will post some entries soon...
Thanks.
Quote from kidPWRtrader:
In this case I am actually wondering what you use.
Will post some entries soon...
Thanks.
Hey,
Back from my trip....should be trading tomorrow.....I see Anek is posting in the
P&L thread, I like it ! ![]()
Good luck tomorrow all and will update after the close.
Cheers ![]()
Ok maybe I just need to let the mind rest a bit and retry. I could not catch
the reason for all the entries and so I was generalizing. I will refer to
specific charts in the future. I just realized my last response sounded rude.
Didn't mean to. Just typed a quick response to see if you would get it.
For tomorrow...
GTF. not great r/w on the dailys but the chart is unquestionably strong. I have
a nice profit from it from 3.16 (my last entry). Thinking of giving it another
go.
SSTR. Don't like the slope of the triangle, but nice r/w and volume pretty good
along with price action.
NPSP. Everything biotech is exploding right now. This just made a breakout 1-2
yr breakout and pulled back. (very easy to see from a longer time frame). Low
risk entry, but bad candlesticks. Will see how everything opens tomorrow and
play it from there.
Currently short RNT and AEA. AEA just made an alltime low and pulled back. Both
shorts should be obvious why... I think.
By the way... these entries are a little grasping at some straws. They arn't
that great in my opinion, but I think market will rally tomorrow so I'm trying
to get ready in case we start making new highs.
Quote from Razor:
Hey,
Back from my trip....should be trading tomorrow.....I see Anek is posting in the P&L thread, I like it !
Good luck tomorrow all and will update after the close.
Cheers
Hey Anek ! ![]()
Understood on the PL.
Cheers ![]()
Quote from Anekdoten:
Welcome back Razor.
Won't post there anymore. Posted the results of Monday's monster trending day, and you know how those days work for me, and another solid uptrend/downtrend day and it became an inquisition plus PM insults, so decided to keep up with my usual privacy.
Anek
Quote from Anekdoten:
Welcome back Razor.
Won't post there anymore. Posted the results of Monday's monster trending day, and you know how those days work for me, and another solid uptrend/downtrend day and it became an inquisition plus PM insults, so decided to keep up with my usual privacy.
Anek
__________________
JDConner
Quote from xcel454:
Price action combined with TL's, s/r levels, and pivots is king. I am seeing this more and more clearly everyday though I have so much to learn.
Up 600 just in the first hr of market open. Still on the Ninja simulator. I did 8 scalps on the ER... 4 winners, 3 losers, and 1 breakeven.
I want to post a chart of my trades but still trying to figure out if i can print screen a portion of my desktop. Gotta head out to work soon so i guess i'll figure it out after work today.
Anyhow, thanks so much Anekdoten and your journal. I am almost ready to go live with real money and take my trading to the next level!
gp,
Thanks for the tips. I've never annotated pictures before so I'll have to get
myself familiar with Microsoft paint or what ever program I use.
Quote from Anekdoten:
Welcome back Razor.
Won't post there anymore. Posted the results of Monday's monster trending day, and you know how those days work for me, and another solid uptrend/downtrend day and it became an inquisition plus PM insults, so decided to keep up with my usual privacy.
Anek
__________________
If at first you don't succeed ...
Hi Anek,
Very interesting thread. One quick question. In your chart, are you using 24 Hrs
or just Pit session for ES.
thanks
Anek,
I'm sure I'm stating the obvious....
A handful of traders will attempt to use your methods. Some will stick with it
and maybe even succeed. Some will give up in frustration and move on to the
"next thing". Many have not assembled the knowledge base to understand your
methods and/or apply them using good money management.
Other will look at your methods and discount their worth all together. Perhaps
this group has a handful of profitable traders that have developed their own
methods and can't fathom yours would work. The rest of this group is neither
profitable or successful. They troll the boards looking to tear down anyone who
lays claim to success.
I, for one, applaud your efforts to help a few struggling traders. Whether or
not your methods will help anyone is up to each individual trader.
Anek,
When trading the Emini futures (ES, YM,etc), do you tend to switch back and
forth between 24hr and pit session (930-415) depending the upcoming news event?
Or do you keep all days the same? For example, last Tuesday, we did not have any
major news in the market while Monday, Wednesday and Thursday, there were major
news announcements. So in the latter, you would use 24 hr session.
What has been your experience?
thanks
JtraderK8
Im done for the day. Tough morning for me.
29 scalps on the ER this morning, 14 winners and 15 losers but i still manage to
be up +140. Win/loss ratio is 1.2.. Just following price the whole morning but
got stopped out quite a bit.
But to be honest days like this are usually big down days for me in the past. So
I'm definitely seeing progress being up a little today. My mistake today was not
taking profits at key points ( TL's, s/r levels etc) because I kept having this
bias that price would keep going in my direction.
You all have a good weekend.
Holy crap Anek.
Thanks for that display on IRC today.
Oh my gosh, no words, no words.
Daniel
D,
hush hush ![]()
monster trending day you know, my kind of baby
![]()
Anek
Quote from daniel33:
Holy crap Anek.
Thanks for that display on IRC today.
Oh my gosh, no words, no words.
Daniel
Quote from JtraderK8:
Anek,
When trading the Emini futures (ES, YM,etc), do you tend to switch back and forth between 24hr and pit session (930-415) depending the upcoming news event? Or do you keep all days the same? For example, last Tuesday, we did not have any major news in the market while Monday, Wednesday and Thursday, there were major news announcements. So in the latter, you would use 24 hr session.
What has been your experience?
thanks
JtraderK8
Quote from JimmyJam:
Yeah, I saw the public stuff, and can well imagine some of the emails you've received (I've gotten my share).
Sorry about that.
You'd think the work you're doing here (giving freely of your knowledgebase which allows traders with money ... perhaps even substantially more than you, to profit from your experience) would be enough for most, if not all.
Well, don't worry about the haters, just keep doing your thing.
Blessings,
JJ
Quote from rverheyen:
Is there a IRC channel where AHG is discussed?
Is the AHG FAQ still a work in progress?
We interrupt this journal to say:
CA$HING!!!!!!!!!!!!!!!!!!!!!!!!!!!!
Anek, out
ummmm which room in IRC. I would love to happen to be there too..
![]()
Quote from screenstruck:
ummmm which room in IRC. I would love to happen to be there too..
Quote from Anekdoten:
No, that was just a one time thing to illustrate scaling/scalping and he happened to be there and recognized the nick.
Takes too much energy to do it live.
Anek
AHHH..what a beautiful day for Trading AHG.
YM has had nice stairstep pattern the last 1.5 hour and is going up and up.
3 Bar Reversal for entries is working really really well in this pattern of HH
HL !!
+22 pts today.
Easy money and a great way to start weekend
![]()
Quick survey,
How many people using ninja charts to trade AHG?
CXinvest, I had seen Anek's post about the one time thing. My logic though is if
its good enough for him to visit, it might be good enough to hangout once in a
while even if he doesnt post.
cheers
SS
Hi Screenstruck
I am using Ninja Charts.
DisciplineTrader
Quote from screenstruck:
Quick survey,
CXinvest, I had seen Anek's post about the one time thing. My logic though is if its good enough for him to visit, it might be good enough to hangout once in a while even if he doesnt post.
for the survey - I do have NinjaTrader using it as trading front end, not
charting.
Its a good idea to have a chat room for AHG followers where traders post setup
and trades in real time. Its really easy to keep the room clean and have a few
people to moderate. If someone interesting to create real time interaction I
would love to participate and will help in the whole process
Anek,
Do you mind if I post a small log of your IRC session today here?
Getting a lot of interest from ET users that have sent me private messages.
Daniel
Go for it but keep the identity of the members private or better yet don't
include them.
BTW, what's the point of posting the log, I barely discussed anything
educational there.
Anek
The point is your readers are asking for it.
![]()
* Anek buys NQ 39
* Anek sells NQ 1/3rd 41 + 2.0
* Anek sells NQ 1/3rd +3.0
* Anek sells NQ small +4.0 @ 43.00
* Anek sells NQ small +5.0 @ 44.00 all out
(xxxx) anek why did you get long?
(Anek) Sucks I ran out of cars lol
(Anek) XXXXX - uptrend, retracement, found support, bar closed above previous
bar high, sign of strenght, up we go
(Anek) The key to daytrading is 1) Spotting the birth of a new trend
w/confirmation or 2) Avoiding the chop and trading with the trend on
retracements
(Anek) I know of no other way to profit from it
* Anek buys NQ 43.00
* Anek sells NQ 45.00 scales out
* Anek sells NQ 45.50 scales out
* Anek sells NQ 46.25 scales out
(Anek) NQ 46 resistance level
* Anek moves NQ stop to 43.75
* Anek moves NQ stop to 44.25
* Anek sells NQ 47.50 scales out (small position left)
* Anek sells NQ 48.25 all out, closes position last +5.25
(Anek) NQ double top test
* Anek shorts NQ 49
* Anek covers NQ 48 +1.0
* Anek covers NQ 48 +1.50
* Anek covers NQ 47.50 +1.50
* Anek covers NQ 47.00 +2.0
* Anek covers NQ 48.25 all out +.75
* Anek buys NQ 49.50
* Anek sells NQ 53.50 +4.0 scaling out
* Anek sells NQ 54.40 +5.0 scaling out
* Anek moves NQ stop to 52.00
* Anek sells NQ 52.00 +3.0 stopped out all out
(Anek) every retracement = good stuff
(Anek) no exceptions
(Anek) Rectangle Formation NQ
(Anek) At the HOD
(xxxxx) dont see any ( i could be blind )
![]()
(Anek) close above R, and then a close above that and we might possibly get a
breakout if it happens
(Anek) want a screenshot?
(xxxxx) yes Anek pls
(Anek) sure thing, one sec
(xxxxx) ym fading slowly i expect nq to follow soon
(Anek) Here you go xxxxx:
http://img220.imageshack.us/img220/169/nqhodji1.jpg
(Anek) I play it differently, im actually waiting for two HHs above the R area
(Anek) Hard for me to short such a strong trending day
(Anek) I have absolutely no problem shorting the highs, but I need to see a
swing low as confirmation and possibly a strong reversal signal too
(Anek) Right now this just looks like a transition point.....
(At this point the rectangle formation he was examining made the HHs he was
looking for and completed exploded to the upside in an incredible breakout)
(Anek) Trend is up baby !!!
(Anek) Buy retracements...... all you gotta do today
Sadly he then left to a private room with the friend he was helping.
![]()
There you go guys, quick glance at "el maestro" what he did in just under an
hour.
Daniel
I agree Rn86. I understand its hard to post and there is no obligation from
anyone. I would vote for a room and can moderate if needed the first few hours.
I wish elite threads had RSS then i wouldnt need to keep refreshing. But then
they wouldnt be able to show their banners would they?
![]()
If anyone (discipline trader youre on my list) uses ninja trader, and would like
me to share the 3 bar reversal markup of stealth as an indicator, please pm me.
thanks
SS
Quote from Rn86:
for the survey - I do have NinjaTrader using it as trading front end, not charting.
Its a good idea to have a chat room for AHG followers where traders post setup and trades in real time. Its really easy to keep the room clean and have a few people to moderate. If someone interesting to create real time interaction I would love to participate and will help in the whole process
Quote from screenstruck:
Quick survey,
How many people using ninja charts to trade AHG?
CXinvest, I had seen Anek's post about the one time thing. My logic though is if its good enough for him to visit, it might be good enough to hangout once in a while even if he doesnt post.
cheers
SS
A. What determines if you will enter a position with multiple cars and scale out, or hold and look to add?
Quote from bmwhendrix:
A. What determines if you will enter a position with multiple cars and scale out, or hold and look to add?
any body trading eurostoxx
i dont realy get much time during workhours to trade..if anybody is creating a room IRC for night shift trading i will be interested..specially trading AHG technique.... may be we will also have maestro Anek there sometimes...
A. Guess i'm in a nitpicking mood tonight, sorry. Say your small stop on a
long entry ( long based on perhaps 2 closes above a restiance level) with the
stop at perhaps the low of the last 2 bars. When you re-enter the long do you
again wait for 2 more closes above the last highs, or just look for one more.
Also, just for giggles, on a 1000 or 1500 v. nq chart, looks like you tend
toward a 1 to 2 point stop. ?
Something that I think confuses many reading this thread is the various
application of stops. Some support leaving a stop say a half point past the last
swing until it gets moved up to a new s/r level or gets hit. Others suggest
placing the initial stop halfway between entry and the last swing. Using "small
stops" with the idea of a possible re-entry sounds good until you wind up in a
whipsaw. How do you avoid that. I guess that is the real concern behind my first
question. By the way, thanks again for everything.
Hi all,
Sorry for the late post had to jet right at market close.
Net Gain NQ $81, happy with the day, four trades, loss, win, loss, win and then
called it quits as was up 5 points and happy with the first day back for over a
week.
Traded AAPL as well and ended up with a small loss.
Cheers ![]()
A. Reading back, you have already described your scaling out process. I just
forgot.......
"As far as scaling out, if I happen to choose that route I make sure my first
target is AT THE VERY LEAST as big as my stop. Then I quickly move stop to BE
and let it ride as much as I can until price loses momentum. Remember, to take
profits BEFORE the next resistance when going long and BEFORE the next support
when going short. I usually let a small portion of the trade ride for the home
run. It's very important that you understand that support is meant to support
and resistance is meant to resist."
For those who pmmed me, here is an example of how the reversal get marked on
today's 1500 NQ chart.
This is for those of you who use stealth's 3 bar reversal and use ninja.
It will mark it once the 4rth or 5th bar is above or below the 3rd bar. So
obviously there is some lag.
Here is the indicator. I am not a good programmer. I have used the candles as
I see them and haven't used variables. Feel free to modify.
cheers
SS
B,
Good questions, long answers but that's quite alright because the night is
young, the stouts are cold and I love trading. I had a great trading day and
you have been a journal reader for quite a while now so I will give you the
answer you deserve and nothing less.
I don't think you are nitpicking just digging deeper into more advanced topics
and that's fine, just take everything with careful consideration because
even-though I have some experience, I'm most definitely no guru or have I
ever met one that was even close to being one. Examine alternatives at all
times from various sources and compare notes.
OK back to your questions.
If I get stopped out on the first entry, as long as support is still
supporting, I would be willing to re-enter on the first evidence of
strength returning to the play. Most definitely, I will not let one quick stop
kill my concentration but limit my losses I must, averaging down I will not,
ever. Usually the second attempt works very smoothly, no surprise there as
they say the first wave is always for the newbies while the smart money sits
back waiting for some real confirmation. Remember, it's never about the best
fill but about the best feel. And by feel I mean numerous confirmations,
what you actually feel means nothing to the market as you are an atom and the
market is the universe.
Obviously you don't go nuts and just buy the next drop because if it's dropping
its doing so for a reason. It is your duty as a responsible trader
to determine if the price drop is profit taking or a possible change of
direction, car size on time and sales is useful in this area.
The idea of an even "better fill" is dangerous so make sure you are not fooled
into such actions.
However, if a sign of strength returning is present that's another story.
Obviously, if support is broken, it's time to look at the big picture again and
re-evaluate.... and by broken I assume by now you know I mean a solid bar
closing below it.
Notice, there is a huge difference between doing this and averaging down because
as you re-evaluate the scenario you have already limited your losses. Contrary
to averaging down where you keep losing on every tick against you regardless if
there is strength returning or not. Frankly, a real dangerous way to trade but
since the accuracy is high, traders keep choosing this so called money
management "tactic". No offense but this is simply, stupidity.
The fact of the matter is that when you are correct in your evaluation of
price action, a great deal of the plays will take almost no heat because you
have and must look at all angles before entering a play. After-all, this is
your hard earned money. I would rather waste it on stouts or my kids than
some on some random dude at the other side of my trade or worse, the
broker. That's what I look when entering a trade, very little heat, if any, and
a pleasant ride to the next level. Naturally, I don't always get this but this
is what I shoot for.
The whipsaw you speak of is easy to avoid because unless strength is found you
stay on the sidelines. You do not go back in, just because it is
,supposedly, a better fill, you go back in when price action gives you the
green light.
It's hard to get multiple strength conditions without price actually following.
If the chop is present there wont be much strength to notice right so don't let
this scare you. Feel free to study the charts and confirm my findings, in fact
I encourage it.
When support is broken by wicks, that could possibly just be other trader's
stops hitting at market, don't let those wicks fool you, the close is
everything, always. In fact a close + 1 tick at the extreme of the closing
bar is even safer, that's a strong tip I just gave you, use it. Why do you
think hammers at support with piercing wicks are so powerful ? Clear sign of
exhaustion. Once again, the hammer alone is not enough, multiple confirmations
at all times. Why ? Because no one thing works by itself.
If you wait for a retracement and then for strength to return if strength is
really returning why on earth would you need a big stop, it's supposed to be
strength at or near support right ?
Some traders claim large stops are required due to noise or volatility I say
it is their ineptitude to read price action correctly. Not claiming super
-trader here, took me a while to learn and accept this. I've said it in the
past and I will say it again and again, you beat this game with small losses
and all kinds of winners. Great accuracy is a bonus and something that comes
much later, the real key here is riding those wild runners remembering that
price rarely goes up without retracing and that re-entering a trade is not
only an option but a powerful one. An option that can be applied even
when things are going well.
One more thing, if you do re-enter a second time because the play is still very
much valid you better be prepared to ride this one to a displacement bigger than
the original one, assuming the fill was actually, a "better" one. After-all,
it is still the same swing.
Lot of opinions in this department, choose what you feel comfortable with but
most important what works best for your style and psychology. I can tell you
what works for me but what works for you might be something completely
different.
Yes, the size of the stop varies depending on how many ticks below previous bar
or bars I allow the stop to take. Anything remotely out of the ordinary and
that would be something I'm not interested in taking because I trade to win big
and lose small as much as I can. It sounds crazy but some of my best plays are
when I buy right at support levels or short right at resistant areas,
fortunately they also require the smallest stops, food for thought. In fact
a dear friend and fellow trader only trades like that, is he effective ? You
better believe it, is his accuracy rate high, absolutely not but he knows when
it's time to pick support and when it's time to pick resistance and his stops
are based on confirmation not exact numbers, except for his emergency stop of
course. I like to do something similar but I always require my confirmation no
matter how close to support or resistance the entry is. Obviously, today was
not an optimal day to be shorting resistance but that's easy to determine if
you are a student of price action.
I might seem like a nice guy, and I think I am, but when I'm in the battlefield
fighting other traders I'm the meanest mofo you can imagine, I protect my
capital like my children and when I'm right I want as much as I can without
neglecting any angles. I like to think I'm taking money from institutions
and that no institution is taking money from me.
To conclude my friend, Risk Management is your best ally.
Hope it helps and keep the faith.
Anek
Chili,
Here is the chart you requested.
Extremely easy play.
Anek
Quote from gpzany:
I am using ninja in sim mode for order entry and charting... love the way it allows me to adjust my positions from the chart - awesome...
and excellent logging of trades and reporting capabilities too... what took me 30 - 45 minutes to anotate my chart EOD for my daily trades and produce trade report now takes me 1 minute...
...like this ?
Quote from Anekdoten:
I'm looking for screenshots of a fairly normal chart type (ie no 1 tick or 10 share charts) for any of the e-minis that has the following:
"M" Formation at the bottom
"W" Formation at the top
(they must not be on the same chart)
The more the merrier.
Thank you for your help, you can post the screenshots in the journal.
Anek
Quote from elovemer:
...like this ?
Quote from xcel454:
Yes, the chart trader is the best as I can trail up my stops so much easier than trying to find it on the DOM. I focus on trailing up my stop until I can move it to B/E, then I focus on my target.
Have you used Market replay yet? I just started using it the other day and thats also a nice feature. Now I can review my morning trades Tivo style.
Quote from Anekdoten:
E,
That's the one I posted as an example earlier this week.
Have not been able to find another one.
Speaking of W tops and M bottoms I will soon post the reason for my interest in them but want to see if anyone figures it out first.
Thanks.
Anek
Teach Yourself AHG in 24 hours
Anek
Great chart Anek... missed one of the longs in the morning for 5 points - its
speed caught me out, and closed another 5 pointer out for no reason capturing
only 2... all in all was +6.5 points on NQ on 8 trades - finished just as that
rectangle started forming...
Love it... ![]()
I find it funny that you tried to decypher the M bottom W puzzle, then
commented on the NQ chart yet you did not comment on the rare ass W top
formation on the NQ chart you just reviewed
![]()
Ahuh - another drunk !
![]()
Anek
Thanks for the nice charts Anek. I really like the way of trading with small
stops. So, your stops in NQ are like atmost 7 to 8 ticks ?
Also Screenstruck, thanks for the Ninja 3 bar reversal indicator.
DisciplineTrader
doubt this is what you had in mind...
these are considered "gartley" patterns
Quote from BigBubba:
doubt this is what you had in mind...
Quote from BigBubba:
these are considered "gartley" patterns
Quote from disciplinetrade:
Thanks for the nice charts Anek. I really like the way of trading with small stops. So, your stops in NQ are like atmost 7 to 8 ticks ?
Also Screenstruck, thanks for the Ninja 3 bar reversal indicator.
DisciplineTrader
Quote from Anekdoten:
I find it funny that you tried to decypher the M bottom W puzzle, then commented on the NQ chart yet you did not comment on the rare ass W top formation on the NQ chart you just reviewed
Ahuh - another drunk !
Anek
....sorry... i missed that....
... here is another from 2004 ... which you might consider an M within a larger
W
.... the reason why you are interested in them is because you would like to
profit from them ![]() .... that was
easy
.... that was
easy
Quote from Anekdoten:
E,
That's the one I posted as an example earlier this week.
Have not been able to find another one.
Speaking of W tops and M bottoms I will soon post the reason for my interest in them but want to see if anyone figures it out first.
Thanks.
Anek
Anek. Halfway through the journal. Great stuff. Will be done by late next
week (have finals soon so gotta concentrate on te matter at hand). Will start
posting paper results a little later than I expected, but excited to reduce my
timeframe to a length I think better suits my personality.
Just my humble opinion... screen time is the best thing of course, but for
anyone to see some candlestick patterns that actually work and just how to use
candlesticks in general( a lot of which anek uses) you can also find them in any
of Steve Nison's works.
Not that I know this, but you can find them for free off of most torrent sites.
Good trading, all.
Kid,
I have studied candlesticks and as always they provide one more confirmation not
a signal.
The ones that do matter to me are:
Hammers at the very end of a downtrend with wicks piercing support
Shooting stars at the very top signaling that bulls got trapped.
Both preferably with good volume.
For instance, say a bar pierces through trendline support and closes as a
hammer. I personally prefer to see a tick below the lowest area of the bar that
closed before shorting, but regardless of that, would you really short that ? I
don't think so, little things like that help.
In time all these little things start adding up and eventually your accuracy
increases due to screen time.
I do pay attention to dojis as they mark indecision, particularly at S and R
areas and I also study engulfing patterns.
The rest I don't care for.
Anek
Quote from elovemer:
....sorry... i missed that....
... here is another from 2004 ... which you might consider an M within a larger W
.... the reason why you are interested in them is because you would like to profit from them
BRCM chart
Anek,
Thanks for posting the BRCM chart. Somewhat confirms what I've been
thinking....the constant volume bars seem to smooth out the price action. With
Cyber getting transferred over to Schwabb, I may have to think about switching
over to TS. Anyhow, you pretty much nailed the trade I took. Here's how I played
it......
chili
Quote from Anekdoten:
Kid,
I have studied candlesticks and as always they provide one more confirmation not a signal.
The ones that do matter to me are:
Hammers at the very end of a downtrend with wicks piercing support
Shooting stars at the very top signaling that bulls got trapped.
Both preferably with good volume.
For instance, say a bar pierces through trendline support and closes as a hammer. I personally prefer to see a tick below the lowest area of the bar that closed before shorting, but regardless of that, would you really short that ? I don't think so, little things like that help.
In time all these little things start adding up and eventually your accuracy increases due to screen time.
I do pay attention to dojis as they mark indecision, particularly at S and R areas and I also study engulfing patterns.
The rest I don't care for.
Anek
Kid,
Thanks for the kinds words.
Yes, Nihabashi strikes me as a candlestick expert and his contributions to the
forums deserve a round of applause.
Anek
Re: BRCM chart
Quote from cchili00:
Anek,
Thanks for posting the BRCM chart. Somewhat confirms what I've been thinking....the constant volume bars seem to smooth out the price action. With Cyber getting transferred over to Schwabb, I may have to think about switching over to TS. Anyhow, you pretty much nailed the trade I took. Here's how I played it......
chili
Here is a work in progress where I'm making an effort to catch the calls from
a programmatic price action perspective.
This is in the first stages of infancy and there is a lot of work left but even
at this stage you can see how anything bigger than a small stop is unnecessary
and a waste of money.
At this time it's missing to catch some calls and avoiding a call in the chop
it's a whole new algorithm but nevertheless something to illustrate.
The area at 10/05 is a day in transition so obviously nothing to catch there but
it's catching about 85% of the moves so far.
Anek
The test is how it does on a non trending day. Uh, I bet you knew that
already. ![]()
Quote from bmwhendrix:
The test is how it does on a non trending day. Uh, I bet you knew that already.
Anek
Do you trade from the Trade station platform? If so what's your opinion? Great
thread, very helpful.
Re: Re: BRCM chart
Quote from Anekdoten:
Chili,
Very important, Tradestation is great for charting but it does not present the constant volume bars correctly so make sure you research this before making your decision as I would not want to see you with dissapointment.
Some say Multicharts with a good data fee is a good alternative.
This does not seem to affect me one bit in Tradestation but I thought I should mention it just in case.
I'm sure others can help you in this subject a heck of a lot more than I can.
One more thing, excellent trading on BRCM.
Anek
Anek,
Thanks for your continued teachings.
Please clarify regarding the size of the bars vs. instrument.
I've seen 1000 and 1500 share bars for NQ and 5000 for ES.
What size bars do you use for ER2, NQ, ES, etc.?
Thanks in advance.
Bbox,
ER2 750-1000 Volume Bars and 610 Tick
NQ 1000-1500 Volume Bars
ES 2500-5000 Volume Bars
Anek
Quote from Trinitytrader:
Anek
Do you trade from the Trade station platform? If so what's your opinion? Great thread, very helpful.
Taking time off the journal to finish a personal project.
Anek
....i dont know what M top you are referring to... ?
... i only highlighted the M bottom in the second chart i posted....
....cheers ![]()
Quote from Anekdoten:
Elovemer,
That's an M top, which is fairly common.
However, it breaks my heart because it is a "failed" M top.
Good example of "nothing works all the time", obviously.
Now, the M bottom, great sample, thank you. I collect those rare babies. I got three, keep them coming
Maybe the M top failed because the rare ass M bottom said, I'm the king of the hill, move to the side !
Anek
Hi Anek,
Could you post a chart example of what you mean by "close + 1 tick at the
extreme of the closing bar is even safer"?
Also, when you are saying that your trades doesn't take much heat, does that
mean that almost 90% of your trades move immediately (like seconds after entry)
in your favor?
thanks
J, newbie trader
Just in case anyone is interested, guys on other websites are talking about
parabolic curves at the moment !
How do you rate them in your strategy ?
AHG primarily uses HHs and HLs for trend identification, not parabolic curves. And AHG does not stop and reverse on the intersection of the curve and price, which I think is one of the things you do with them, right? AHG doesn't trade against the prevailing trend.
Quote from JtraderK8:
Hi Anek,
Could you post a chart example of what you mean by "close + 1 tick at the extreme of the closing bar is even safer"?
Also, when you are saying that your trades doesn't take much heat, does that mean that almost 90% of your trades move immediately (like seconds after entry) in your favor?
thanks
J, newbie trader
Quote from xiaodre:
AHG primarily uses HHs and HLs for trend identification, not parabolic curves. And AHG does not stop and reverse on the intersection of the curve and price, which I think is one of the things you do with them, right? AHG doesn't trade against the prevailing trend.
Quote from JtraderK8:
Hi Anek,
Also, when you are saying that your trades doesn't take much heat, does that mean that almost 90% of your trades move immediately (like seconds after entry) in your favor?
thanks
J, newbie trader
Why does Anek use "silly" indicators ?
I've been asked many times this question. Criticized by many even as they enjoy
reading the journal.
The simple answer is, I've been trying for quite a while now to trap price
action in some sort of algorithmic way to mimic a fraction of my hand trading in
automation so I can increase my P/L potential. Greed is good, right?
Obviously a vast majority of the charts I post on my journal are indicator free
and at this point my hand trading blows away any automation project.
However, this has been an on going project for quite some time and it is still a
work in progress. Not even in the alpha stages.
Here is a taste of the progress on the ER2 with 6 months past data, can't go any
further on TS using tick charts, unless I buy extra data.
Commission and slippage is accounted for in the results. Every trade has three
exit points so the car size is set as it's minimum, 3. I have not implemented
averaging up into it yet.
Still not pleased but definitely beating the system and yes the algorithm behind
this is nothing but AHG.
Anek
....and the curve.
Posting this as illustration of my automation progress.
Not selling, not sharing just answering why I've been toying with personal
indicators all this time.
Anek
No need to justify yourself to anyone.
Quote from Anekdoten:
....and the curve.
Posting this as illustration of my automation progress.
Not selling, not sharing just answering why I've been toying with personal indicators all this time.
Anek
Hi Anek,
I just signed up on this site and stumbled on your journal. I am a new trader
and am looking foward to going through it. I have been trading YM and cosidering
the ER2. What indicators and tick charts would you recomend. Thanks for your
contribution to helping out other traders. I will pay it forward also when I
can.![]()
C,
Price, Horizontal Lines, Trendlines, Zig Zag Lines, the custom Paintbars I
recommend, that should do it.
Read the journal, it's all in here.
Anek
Quick Question
I know for confirmation we want to look at the close of the bar.
What about when defining highs and lows for trend determination?
For example a lower low is made by a wick, but not by the close. Is it still
considered a lower low?
Quote from Anekdoten:
Bbox,
ER2 750-1000 Volume Bars and 610 Tick
NQ 1000-1500 Volume Bars
ES 2500-5000 Volume Bars
Anek
Re: Quick Question
Quote from macattack:
I know for confirmation we want to look at the close of the bar.
What about when defining highs and lows for trend determination?
For example a lower low is made by a wick, but not by the close. Is it still considered a lower low?
Quote from walter1986:
Anek,
For each contract, do you watch both charts? For example, do you use both the 2500 & 5000 charts on the same day to trade the ES? Is one more important to you, or is it just dependant on that days' volume?
Thanks.
Quote from JtraderK8:
Anek,
When trading the Emini futures (ES, YM,etc), do you tend to switch back and
forth between 24hr and pit session (930-415) depending the upcoming news event?
Or do you keep all days the same? For example, last Tuesday, we did not have any
major news in the market while Monday, Wednesday and Thursday, there were major
news announcements. So in the latter, you would use 24 hr session.
What has been your experience?
thanks
JtraderK8
--------------------------------------------------------------------------------
Not at all, don't even pay attention to that.
Anek
Anek,
Wanting to be sure I understand your answer here, are you saying you don't pay
attention to most news(which I've seen you say before), or that you don't pay
attention to the 24 hr session.
Specifically, I'm trying to figure out if there is any value to the data on the
chart before pit hours.
Thanks
Walter,
Globex low and globex high can be an area of congestion, support or resistance.
Yet, how is this different from any other congestion, support or resistance so I
treat it like any other. Pivots the same. Price action skills will prepare you
for this, whatever it might be.
I don't care for news but sometimes I read about them after the fact as
instructive or curiosity value definitely not trading value.
Anek
Another Quick Question
I'm talking stocks right now. Will probably switch to futures after I do a
lot of research and gain more experience with them.
So let's say a stock is in an uptrend and you're looking to buy during a
pullback. What if a bar finally closes above the previous bar, but it is a down
bar. (caused by a gap higher open).
Is that still a valid bar to go long, or should you wait for an up bar?
Mac
Question is too broad, would need to see a screenshot to examine price action
and all of its surroundings.
Anek
Double Top Question
From earlier thread: Anek said: "When you see a TL break (and that's a close)
and the last high was a LOWER high, imho, don't wait for the swing low to be
taken out, just take it now. Small risk, good reward play".
When you say "lower high" do you mean the wick is lower or the close is lower? I
thought I saw some charts where it appeared you were paying more attention to
the wick to determine if it was a lower high.
I promise I won't ask anymore questions tonight.
Re: Double Top Question
Mac,
Sure.
Imagine an uptrend that starts showing signs of exhaustion.
For instance, failing to create a higher high on that last swing and actually
plotting a lower high (not even a double top).
This tells you something, this is your first confirmation, not enough though
because it could be consolidation.
Then as you closely examine the price action you see a bar close below a
flexible (not too tight) trendline. Not a wick, not a spinning top but something
that convincingly says, I'm closing this below this area. Mark the low of the
candle, and when a tick prints below that closing bar low that creates a good
reward low risk short play scalp assuming the next support area is not too
close.
Anek
Double Bottom Rules - A little confused
It's tomorrow now in some other part of the world, so I am allowing myself to
ask another question.
Double Bottom Rules:
Is the following correct?
1. Double Bottom (not low of day):
-(Aggressive): Buy when the high of the middle swing bar is taken out
-(Conservative): wait for 1 higher high and 1 higher low, then buy
2. Double Bottom (low of day):
-(Aggressive): Wait for 1 higher high, 1 higher low, then buy on a bar that
surpasses the high of a previous bar
-(Conservative): Wait for 2 higher highs, and 2 higher lows, then buy.
3. Double Bottom (all of them):
-If the 2nd low of the double bottom was a higher low, and there is a
significant trend break on the close of a bar, then buy on the next tick that
surpasses that bar.
(ALL VICE VERSA FOR SHORTS)
I know these probably aren't hard and fast rules. Would depend on what the chart
and price analysis looks like. But are these rules correct in the generic sense?
Mac, you seem to be the perfect guy to compile the much awaited the FAQ !
![]()
Burned out so will come to the journal when the energy returns.
Mac, yes and no, dig inside....
Anek
Quote from screenstruck:
Mac, you seem to be the perfect guy to compile the much awaited the FAQ !
...would you mind sharing the other three with me ?
... thanks....i am interested in them too
Quote from Anekdoten:
Elovemer,
Now, the M bottom, great sample, thank you.
I collect those rare babies. I got three, keep them coming
Anek
For AHG method I was using OHLC bars all the time. I realised I must switch
to candlesticks which I have done. I am using QT with IB a/c.
I will much appreciate if someone can post with graphical representation
different types of candle bars and what they might mean. Some link to this info
will do as well.
Again much appreciated and thanks to everybody for making this a great thread.
__________________
A Candle Loses Nothing By Lighting Another Candle
Quote from osho67:
For AHG method I was using OHLC bars all the time. I realised I must switch to candlesticks which I have done. I am using QT with IB a/c.
I will much appreciate if someone can post with graphical representation different types of candle bars and what they might mean. Some link to this info will do as well.
Again much appreciated and thanks to everybody for making this a great thread.
The following Candlestick reference sheet was given to me, I hope this may assist fellow students.
Quote from hwkaiser:
The following Candlestick reference sheet was given to me, I hope this may assist fellow students.
__________________
A Candle Loses Nothing By Lighting Another Candle
Anek,
Why not use larger bars (other than tick) and use intrabar order generation so
you can go back farther in your backtesting? You probably knew this but thought
I'd mention.
Columbus day guys and gals...capital markets closed....
Don't get chopped up today......please...
Quote from monti1a:
Columbus day guys and gals...capital markets closed....
Don't get chopped up today......please...
Anek - enjoying reading your Journal, congrat's on your success
![]()
Anekdoten, I wanted to add my thanks to the many others you have gotten for
starting this thread. I read the first 250 pages but got impatient and skipped
to the end. The best thing I've gotten out of this discussion was convincing me
to get rid of my indicators, which was about as hard as giving up smoking, but I
did it and I'm way better off. All they were doing were confusing me and causing
me to hesitate. My sincere thanks for that.
I noticed you started with YM, then switched to ES, NQ and now ER2. I came to
the conclusion about 6 months ago that ER2 provided the best profit potential,
although the action can be a little hair raising and I got chopped up pretty bad
trading ER2. That, combined with it moving to ICE at some point, convinced me to
switch to ES. But now that you're considering ER2, I'm thinking maybe I was
premature in switching. Are you concerned at all about the move to ICE?
Another thing I wanted to ask about was bid/ask size. Do you pay attention to
that at all? It seems that when there are like 3 times the number of bids
compared to asks it would not be a good time to short, but that hasn't always
proven to be the case. What do you think?
I got a question for you Anek. I know the double tops / double bottoms are
intra-day swing trades and not scalps. I was curious as to whether or not you
played the DT / DB failure trades you take as longer trades as well or if you
possibly reform to some form of a scalp because you've ended up taking the
failure of those setups instead. Might as well post what got my memory stirring
and asked how you might have played this as well. If I remember right, I should
have shorted somewhere in around my red circle. Thanks!
~Cx
Quote from bluedemon77:
Another thing I wanted to ask about was bid/ask size. Do you pay attention to that at all? It seems that when there are like 3 times the number of bids compared to asks it would not be a good time to short, but that hasn't always proven to be the case. What do you think?
Anek
Hope you're chillin'....![]()
Does this qualify as an elusive "M" bottom? Would the 1st swing need to be lower
than the 2nd for it to make your endangered species list?
Quote from screenstruck:
Mac, you seem to be the perfect guy to compile the much awaited the FAQ !
Quote from swingnifty:
Hello
I have compiled few notes from this thread. Maybe its useful for others.
Thanks Anek for the thread.
Best Wishes
NT
Quote from swingnifty:
Hello
I have compiled few notes from this thread. Maybe its useful for others.
Thanks Anek for the thread.
Best Wishes
NT
Nice Job swingnifty...
Quote from swingnifty:
Hello
I have compiled few notes from this thread. Maybe its useful for others.
Thanks Anek for the thread.
Best Wishes
NT
Quote from low_hcp_golfer:
Anek
Hope you're chillin'....
Does this qualify as an elusive "M" bottom? Would the 1st swing need to be lower than the 2nd for it to make your endangered species list?
swingnifty
you have compiled almost 400 pages in one trading manual, thanks for the effort,
your work greatly appreciated!
It might be also very helpful to add some real life trades examples at the end
of the manual.
Quote from Cxinvest:
Yeah I saw that too.
~Cx
Oh my, got really chopped up today.
Tried ER2 for the last 4 hours. -$900. 7/7 losing trades.
Got to get my act together, such a great system and I still blew it. But hey,
I've time to learn and study. Mostly discipline...
Hi,
Net Gain +$24, not a bad day but was up about $100 at one point so gave too much
back.
Did pretty nice on some AAPL trades.
Cheers ![]()
Hi Guys,
Hope all is well
Been away for a bit.
Swifty Great job with the notes.
and the guys who posted the candlestick .pdf's Thanks Alot !
I always wondered what the heck the doji/hammers were all about and it was
explained perfectly
Along with Anek you guys are making this one amazing thread.
Thanks !
(p.s. if anyone trades dax or nikkei mini please pm me)
My Day
Hi @all ![]()
Great thread you are running here. Thanks to all traders who share their
observations and trades.
It´s quite the same style I trade. Naked charts, just s/r, but I need a 1-min
chart to hit the entry (helps me to see when vol. increases/decreases).
I added volume based charts now. It really enriched my trading.
Today´s NQ trades attached. More missed than taken oppurtunities...
![]()
Time is CET (+6)
Have a nice day ![]()
ER2
Quote from rverheyen:
Oh my, got really chopped up today.
Tried ER2 for the last 4 hours. -$900. 7/7 losing trades.
Got to get my act together, such a great system and I still blew it. But hey, I've time to learn and study. Mostly discipline...
Re: ER2
Hi mwald,
Interesting....do you ever go to breakeven after x amount of ticks in your
favour or do you just say either stop or first target of 10 ticks, whatever
comes first then I would presume you go to breakeven after first target hit....
How many trades do you usually do per day and week ?
What is your avg. win / loss percentage, is something like 13 out of 17 or 76%
normal for you ?
Seems like a nice a simple system, good stuff.....
Cheers ![]()
Quote from mwald:
RV,
Take a look at my ER2 chart for today. Enter on the trendline break and use 1 tick past the entry bar for a stop and 10 ticks for a 1st target. 13 winners and 4 small losers.
Note- Chart is Pacific time
Re: Re: ER2
[QUOTE]Quote from Razor:
[B]
Interesting....do you ever go to breakeven after x amount of ticks in your
favour or do you just say either stop or first target of 10 ticks, whatever
comes first then I would presume you go to breakeven after first target hit....
Always B/E at T1, and use judgment otherwise. I`ll tighten up depending on
movement or if running into a PP or S/R line, may even take early profits of 5-6
ticks if hitting a PP.
How many trades do you usually do per day and week ?
I get 10 to 20 T/L breaks on ER2 each day depending on how choppy it is.
What is your avg. win / loss percentage, is something like 13 out of 17 or 76%
normal for you ?
I wish, LOL. But I do very well on chop days and so so on strong trending days.
I used this method with ok results using a 3 minute chart but switched to a
Volume chart after reading this tread. They both work, but different trades win
or loss depending on the chart.
Someone else on this tread said all moves start with a T/L break, so that is all
I use now. BTW, thanks to the input traders have made here I have been
improving. Thanks All.
Re: Re: Re: ER2
Thanks for the reply ![]()
All the best going forward !
Cheers ![]()
Quote from mwald:
[QUOTE]Quote from Razor:
[B]
Interesting....do you ever go to breakeven after x amount of ticks in your favour or do you just say either stop or first target of 10 ticks, whatever comes first then I would presume you go to breakeven after first target hit....
Always B/E at T1, and use judgment otherwise. I`ll tighten up depending on movement or if running into a PP or S/R line, may even take early profits of 5-6 ticks if hitting a PP.
How many trades do you usually do per day and week ?
I get 10 to 20 T/L breaks on ER2 each day depending on how choppy it is.
What is your avg. win / loss percentage, is something like 13 out of 17 or 76% normal for you ?
I wish, LOL. But I do very well on chop days and so so on strong trending days.
I used this method with ok results using a 3 minute chart but switched to a Volume chart after reading this tread. They both work, but different trades win or loss depending on the chart.
Someone else on this tread said all moves start with a T/L break, so that is all I use now. BTW, thanks to the input traders have made here I have been improving. Thanks All.
mwald. Nice work today. I have a few questions. What constitutes a trend line
for you? How many bars minimum?
Do you consider the trend in any manner or just take the breaks as they come?
How long have you been trading in this manner?
It's about as simple as it can get.
Thanks for sharing.
D
I'm glad Swing and others compiled some of the basic Q/As into an easy to
read document because frankly I'm getting burned out from repeating the same
thing over and over again. 99% of the questions are the same thing with very
little new substance, therefore, I encourage readers to start chipping in with
new ideas or making sure you have read the new compiled guides before stepping
forward.
From now on I will limit explanations to new questions only to avoid burning
out, which I admit, it's getting to me.
Attached please find an analysis of NQ from today, which is the best I can offer
at this point as far as illustration goes.
Anyway to the chart....
Easiest chart I've seen in a very very long time.
I did not have a single losing trade, not one, nothing, nada, zero.
Hard rules on the chart implemented for your viewing pleasure.
I'm sorry to say, if you are not killing it at this point on days like this, you
are definitely not getting it and I recommend re-evaluation of the concept.
Anek
Quote from bmwhendrix:
mwald. Nice work today. I have a few questions. What constitutes a trend line for you? How many bars minimum?
Do you consider the trend in any manner or just take the breaks as they come? How long have you been trading in this manner?
It's about as simple as it can get.
Thanks for sharing.
D
Anek:
Thx for the chart, as usual.
Everything is all so logical for you, so calm, so vivid.
Logical entries, exits, risks. It's admirable.
You have a gift for this my friend. Just like a great painter paints
masterpieces you make masterpieces out of charts, congratulations.
Daniel
Quote from Anekdoten:
I'm glad Swing and others compiled some of the basic Q/As into an easy to read document because frankly I'm getting burned out from repeating the same thing over and over again. 99% of the questions are the same thing with very little new substance, therefore, I encourage readers to start chipping in with new ideas or making sure you have read the new compiled guides before stepping forward.
From now on I will limit explanations to new questions only to avoid burning out, which I admit, it's getting to me.
Attached please find an analysis of NQ from today, which is the best I can offer at this point as far as illustration goes.
Anyway to the chart....
Easiest chart I've seen in a very very long time.
I did not have a single losing trade, not one, nothing, nada, zero.
Hard rules on the chart implemented for your viewing pleasure.
I'm sorry to say, if you are not killing it at this point on days like this, you are definitely not getting it and I recommend re-evaluation of the concept.
Anek
Official List of Allowed Indicators for AHG
- Support and Resistance visual aids (TRO stuff is good)
- Trendlines, better if hand placed.
- Highs and Lows visual aids
- Volume based bars, tick based bars
- Paintbars to accentuate price action
- Candlesticks to find extra confirmations
- Market internals, optional (useless to me, maybe I don't how to use them)
- Zig Zag indicators to enhance patterns
- Fibonacci Retracement percentages
- Horizontal Lines
Anything else unless it's a derative to enhance any of the above without
adding lag to it is probably a waste of time.
Anek
Quote from jack411:
Thanks for the chart. I never get tired of seeing your charts and analysis. It really helps me!
Did you ever tell us why you like the M and Ws? I'm thinking it must be a way to help determine general trend direction for the "bigger picture" or at least for that particular day.
Because as far as I can tell, intraday they are played the same as double tops and bottoms.
Mwald,
I like how you are thinking, a birth of a trend hunter, beautiful tactic.
Keep at it and report findings, I think you are on the right track.
Anek
Re: My Day
Tommi,
Keep practicing, use the sim as much as you need to. Eventually if will come to
you and it becomes a natural thing. Lots of prosperity is in the horizon if you
implement the hard work that is required for this kind of stuff.
Anek
Anek
Beautiful chart, I've printed out all 393 pages of the thread so far, in case
your tired of going over the same things you could sell them as trading manuals.
The entire thread currently takes up two entire three inch binders. Thanks for
the help.
Quote from bluedemon77:
Anekdoten, I wanted to add my thanks to the many others you have gotten for starting this thread. I read the first 250 pages but got impatient and skipped to the end. The best thing I've gotten out of this discussion was convincing me to get rid of my indicators, which was about as hard as giving up smoking, but I did it and I'm way better off. All they were doing were confusing me and causing me to hesitate. My sincere thanks for that.
I noticed you started with YM, then switched to ES, NQ and now ER2. I came to the conclusion about 6 months ago that ER2 provided the best profit potential, although the action can be a little hair raising and I got chopped up pretty bad trading ER2. That, combined with it moving to ICE at some point, convinced me to switch to ES. But now that you're considering ER2, I'm thinking maybe I was premature in switching. Are you concerned at all about the move to ICE?
Another thing I wanted to ask about was bid/ask size. Do you pay attention to that at all? It seems that when there are like 3 times the number of bids compared to asks it would not be a good time to short, but that hasn't always proven to be the case. What do you think?
Quote from Trinitytrader:
Anek
Beautiful chart, I've printed out all 393 pages of the thread so far, in case your tired of going over the same things you could sell them as trading manuals. The entire thread currently takes up two entire three inch binders. Thanks for the help.
A. I saw a db and a dt today. What am I missing in seeing these as valid
setups?
Thanks,
D
Quote from rverheyen:
Oh my, got really chopped up today.
Tried ER2 for the last 4 hours. -$900. 7/7 losing trades.
Got to get my act together, such a great system and I still blew it. But hey, I've time to learn and study. Mostly discipline...
Quote from bmwhendrix:
A. I saw a db and a dt today. What am I missing in seeing these as valid setups?
Thanks,
D
B,
You want a mid swing in between not the freaking grand canyon
![]()
Use the support or resistance as a sign of reference or possible
congestion/retracement.
Anek
Quote from Rn86:
swingnifty
you have compiled almost 400 pages in one trading manual, thanks for the effort, your work greatly appreciated!
It might be also very helpful to add some real life trades examples at the end of the manual.
Quote from swingnifty:
Hello
I have archived quite a few of the charts Anek has uploaded, can compile them as a seperate pdf document.
Maybe can also add links to forum pages for download of resources like ELD of Paintbars etc.
More suggestions, welcome.
NT
Solution to the M bottom and W top finally posted on this thread:
http://www.elitetrader.com/vb/showt...440#post1634440
I also encourage others to participate on it.
Anek
Quote from Anekdoten:
I've always been a fan of porn, and it's great distraction for the chop. I'm sure it can be included in the appendix
Anek
Quote from swingnifty:
Can be done, but only if u post the links here, the document contains stuff only from this thread, nothing from outside allowed
Thanks
nt
Quote from Anekdoten:
I've always been a fan of porn, and it's great distraction for the chop. I'm sure it can be included in the appendix
Anek
D,
You are welcome.
I don't think I have tried that stout. In fact the name is so peculiar I
probably never did.
Anek
Quote from Anekdoten:
Mwald,
I like how you are thinking, a birth of a trend hunter, beautiful tactic.
Keep at it and report findings, I think you are on the right track.
Anek
![]()
Quote from dcvtss:
Have you ever tried these? One of my favorites. Again, thanks!
Quote from dcvtss:
Just want to say thanks for a great thread. I've been lurking on it since the beginning and your method kept me out of this morning's chop and put me into a profitable afternoon NQ trade. And to top it off you're a fan of porn and stout, a man after my own heart.
Have you ever tried these? One of my favorites. Again, thanks!
Re: ER2
Quote from mwald:
RV,
Take a look at my ER2 chart for today. Enter on the trendline break and use 1 tick past the entry bar for a stop and 10 ticks for a 1st target. 13 winners and 4 small losers.
Note- Chart is Pacific time
Quote from Anekdoten:
Rverheyen,
I don't like the sound or result of that.
Frankly, the ER2 is for traders that dominate it and had a certain level of training. Why do you think I call it, the beast? Unless this is a rare event I respectfully suggest the NQ.
Anek
monday NQ chart review
Anek ,
I did'nt understand this entry . Looks like you shorted in the upper wick of the
candle just before 12:08. Would have though it would be after Weak candle close
and after candle extreme is exceeded by 1 tick .
__________________
Lets all drink to the death of a clown.
Quote from Anekdoten:
I'm glad Swing and others compiled some of the basic Q/As into an easy to read document because frankly I'm getting burned out from repeating the same thing over and over again. 99% of the questions are the same thing with very little new substance, therefore, I encourage readers to start chipping in with new ideas or making sure you have read the new compiled guides before stepping forward.
From now on I will limit explanations to new questions only to avoid burning out, which I admit, it's getting to me.
Attached please find an analysis of NQ from today, which is the best I can offer at this point as far as illustration goes.
Anyway to the chart....
Easiest chart I've seen in a very very long time.
I did not have a single losing trade, not one, nothing, nada, zero.
Hard rules on the chart implemented for your viewing pleasure.
I'm sorry to say, if you are not killing it at this point on days like this, you are definitely not getting it and I recommend re-evaluation of the concept.
Anek
Re: monday NQ chart review
Quote from babe714:
Anek ,
I did'nt understand this entry . Looks like you shorted in the upper wick of the candle just before 12:08. Would have though it would be after Weak candle close and after candle extreme is exceeded by 1 tick .
Cire ,
thanks for answer , I recall that now
Anek or anyone ,
In playing this DB failure would the exit be on 1st Strong bar ?
or would this be not giving it enough room to work .
__________________
Lets all drink to the death of a clown.
babe,
the Green strong candle did not close BREAKING a trend line hence it would not
be an exit.
Quote from babe714:
Anek or anyone ,
n playing this DB failure would the exit be on 1st Strong bar ? or would this be not giving it enough room to work .
lol golfer im glad we think alike!
Quote from bugsbunny:
lol golfer im glad we think alike!
Swing is on the right track here, the archived charts could be re-named and numbered as to category... i.e. uptrend, chop, entry, exit, stop, etc... then the best sample's of each could be posted with an explanation on it's application.
Quote from swingnifty:
I have archived quite a few of the charts Anek has uploaded, can compile them as a separate pdf document.
Maybe can also add links to forum pages for download of resources like ELD of Paintbars etc.
More suggestions, welcome.
NT
Quote from swingnifty:
Hello
I have archived quite a few of the charts Anek has uploaded, can compile them as a seperate pdf document.
Maybe can also add links to forum pages for download of resources like ELD of Paintbars etc.
More suggestions, welcome.
NT
__________________
Boib
Its easy to make a small fortune if you start with a big one
Choppy day.
I'm up 1/4 NQ point out of 4 trades.
I think I'm learning to not loose my shirt, aka AHG.
Although, I've noticed that if I had given my trades a 'scalp' perspective
today,
I would have locked in a couple of points here and there where I ended up
getting stopped for a loss.
My thoughts are that maybe it is a good idea to think scalp on days like these.
Maybe it's a "no duh" for some of you, but it has presented itself to me today.
-Tech
After my best week yet last week, the market smacks me down. This was my
worst trading day ever I think. Out of 6 trades not one went even a point in my
favor before reversing. Thank god I'm still on the sim!
![]() Sorry just had to vent
Sorry just had to vent
![]()
Solom, Post a chart for constructive input.
Quote from solom113:
After my best week yet last week, the market smacks me down. This was my worst trading day ever I think. Out of 6 trades not one went even a point in my favor before reversing. Thank god I'm still on the sim!
Hi,
Net Gain NQ +$191, did well today and was done by midday.
Did nicely on some AAPL trades as well.
Cheers ![]()
Quote from Razor:
Hi,
Net Gain NQ +$191, did well today and was done by midday.
Did nicely on some AAPL trades as well.
Cheers
not my day...
using a stop directly below the last low (1 tick) worked optimal against me
today.
btw: somebody who traded the nq today? I hope you had at least a 2-tick stop and
did better than me..
Call it a day...
Tommi three of the trades you took were the same ones I took today.
Ya,
I didn't want to give back NQ gains from a good day and decided to just do small
AAPL trades for rest of day after 12pm.
![]()
Quote from Cxinvest:
Sweet! Missed some action after 2 EST though.
~Cx
Quote from Razor:
Ya,
I didn't want to give back NQ gains from a good day and decided to just do small AAPL trades for rest of day after 12pm.
Quote from Razor:
Hi,
Net Gain NQ +$191, did well today and was done by midday.
Did nicely on some AAPL trades as well.
Cheers
Hey,
OK, give me a few mins.
Quote from tommi:
top!
would you be so kind as to mark your trades in the chart?
http://i23.tinypic.com/vioakg.png
Started out at open thinking short because of a potential gap n trap....not
exactly part of AHG's method but I was able to get short with tight stops so
figured risk was justified for potential large reward (as I have said before my
method is mainly AHG but a lot of discretion in there as well if I 'see' a good
r/r trade), as one can see it took one b/e and one small loss before the gap
filled which gave me essentially +10 points (as I added and got +5 points on
each position). So I basically ended up taking a b/e and -1.50 for +10....IMHO a
good r/r and plan followed through nicely.
The final trade was more of a scalp, I would have normally held this for more
and taken a b/e looking for my normal +4 or more target but I figured on a FOMC
day that we may see more chop than trend so took the 2+ points on it.
Hope this helps.
Cheers ![]()
PS: This is a 1200VB chart, I find myself switching back and forth between 400VB
and 1200VB throughout the day.
NQ Trades for 10.09.07
Took one on the chin today but came back to win it all back and then some.
Anek
This is a 1200VB chart, I find myself switching back and forth between 400VB and 1200VB throughout the day.
Chart trades
Something came up, personal, so will be MIA until further notice.
Nothing bad just important.
Have a great trading all, keep increasing that screen time.
Anek
Quote from Anekdoten:
NQ Trades for 10.09.07
Took one on the chin today but came back to win it all back and then some.
Anek
Hey, I try to place them at places I don't think price should go if the trade
is to eventually go in my favour.....usually I don't like stops above 3 points
and usually 2 points is the start and then I quickly move them smaller, 1.50,
1.00, .50, b/e.....once at b/e I usually look for 4+ points.
Hope this helps.
Cheers ![]()
Quote from tommi:
Thanks for the chart.
I switch between 500 and 1500 vb, mostly 1000 vb.
Where did you place your stops?
Thought I would post a chart for once instead of lurking. Things I need to
work on are,
1. Overtrading.
2. Letting winners run.
The thing I did best today was absolutely no big losers. My accuracy was 50%,
but my winners were more than 3 times bigger than my losers. So a nice 8
point/contract NQ profit after commish. I am on a simulator still so I make my
commish 1.5 times actual, to make up for any advantages I may gain on the
simulator. My average loser was 0.93, my average winner was 3.43 after commish.
I guess I just wanted to point out the single most important thing I have
learned since starting, and this thread has helped the most, is that if you keep
the losses small, it is much easier to make money, because you will and should
have some big winners. I have no problem exiting if a trade doesn't seem to be
acting how I think it should act. I agree with Anek, you can always get back in.
cirekindob, what is the difference between the green and the lime green
candles?
ahh, I see...high+close higher than last candle...
ES Today ==>
~Cx
WTG CX
CX - Anek will be proud of that I think, nice trading on ES.... How many net points today?
Quote from Cxinvest:
ES Today ==>
~Cx
Did you guys do anything different today because of the FOMC minutes at 2?
Choppy this AM, did a couple of break even trades and decided to stay out until
a solid trend developed. Looked like one started right before the minutes came
out, but I thought better wait, my first mistake. Saw another opportunity about
2:15, but waited for a retracement that didn't come, my next mistake, so I
missed the big move. Could have got in again after it retraced and then broke
back above major resistance, but wimped out because I thought "this can't go
much higher." WRONG--I'm afraid to look where it is now.
Sometimes I think I'd be better off not paying attention to the economic
calendar at all, but then again sometimes trading on these FOMC event days is
like carting around old dynamite. What do you think? Does the news impact your
decisions or do you just go by the chart and tune everything else out?
Quote from Cxinvest:
ES Today ==>
~Cx
Quote from mwald:
Cx, Nice chart. I notice that there looks like DT at 14:05 relating to the 11:00 high. Is there a specific rule to omit it, such as too much time expired? I only ask because I`m learning.
Anek,
My money management of choice is averaging down although not necessarily on
direction how can I implement this with AHG ?Thank you, great thread.
Avg Down King
Quote from bluedemon77:
Did you guys do anything different today because of the FOMC minutes at 2? Choppy this AM, did a couple of break even trades and decided to stay out until a solid trend developed. Looked like one started right before the minutes came out, but I thought better wait, my first mistake. Saw another opportunity about 2:15, but waited for a retracement that didn't come, my next mistake, so I missed the big move. Could have got in again after it retraced and then broke back above major resistance, but wimped out because I thought "this can't go much higher." WRONG--I'm afraid to look where it is now.
Sometimes I think I'd be better off not paying attention to the economic calendar at all, but then again sometimes trading on these FOMC event days is like carting around old dynamite. What do you think? Does the news impact your decisions or do you just go by the chart and tune everything else out?
Quote from jack411:
Is this in hindsight, or are these the trades you made today?
If these were your trades great job! You nailed it today man!
Cx,
Understand, thanks.
Quote from mwald:
Cx,
Understand, thanks.
Quote from Avgdownking:
Anek,
My money management of choice is averaging down although not necessarily on direction how can I implement this with AHG ?Thank you, great thread.
Avg Down King
Thanks Anek for the today's NQ chart. What do the colors of your entry/exits
signify?
Green ellipse - Initial entry or Adding more to existing position.
White Ellipse - Scale out of existing Position
Yellow Ellipse - Not sure what yellow means
Thanks
DisciplineTrader
Quote from disciplinetrade:
Thanks Anek for the today's NQ chart. What do the colors of your entry/exits signify?
Green ellipse - Initial entry or Adding more to existing position.
White Ellipse - Scale out of existing Position
Yellow Ellipse - Not sure what yellow means
Thanks
DisciplineTrader
Trend Question w/ double bottom
This is a question for anybody who cares to answer. I was still a little
foggy on this point after re-reading:
Let's say you have:
-Double Bottom in a downtrend
-Swing high is passed which can trigger a long entry.
Would the the trend now be considered an uptrend, or still a downtrend?
Would we want to sell the long position and go short if there is a strong down
bar?
From what I've read my guess is that if the double-bottom is the low-of-day that
we would still be in a downtrend until a 2nd higher high and higher low.
If not low-of-day then consider it an uptrend. I'm probably wrong.
Re: Trend Question w/ double bottom
Quote from macattack:
This is a question for anybody who cares to answer. I was still a little foggy on this point after re-reading:
Let's say you have:
-Double Bottom in a downtrend
-Swing high is passed which can trigger a long entry.
Would the the trend now be considered an uptrend, or still a downtrend?
Would we want to sell the long position and go short if there is a strong down bar?
From what I've read my guess is that if the double-bottom is the low-of-day that we would still be in a downtrend until a 2nd higher high and higher low.
If not low-of-day then consider it an uptrend. I'm probably wrong.
Cx,
That was some good reading you did today.
Way to go trading the charts.
Anek
Re: Re: Trend Question w/ double bottom
Quote from Cxinvest:
As far as your question about shorting on a strong down bar you got me confused. Are you asking if a short position should be taken on the first strong down bar that occurs once the double bottom is confirmed and intact above its middle swing??
~Cx
Quote from Anekdoten:
Cx,
That was some good reading you did today.
Way to go trading the charts.
Anek
Re: Re: Re: Trend Question w/ double bottom
Quote from macattack:
Yes. Double Bottom Confirmed. Middle Swing has been surpassed. A few bars later you get a strong down bar.
Maybe it's a judgement call at this point?
Re: Re: Re: Re: Trend Question w/ double bottom
Quote from Cxinvest:
Ok, if the pattern is confirmed and only moves a short ways and price begins to fail to the upside and head south, you have the option to sit and see what happens or potentially play what Anek has developed as the "DB / DT failure play". If I understood it correctly until this point, you look to short on the first pop up following the initial failure. Let's see if we can get his feedback too. Here is an example from the other day of an obvious failure. Hope it helps!
~Cx
Re: Re: Re: Re: Re: Trend Question w/ double bottom
Quote from Anekdoten:
Cx,
Was that one at the LOD ?
Anek
Cx,
Then that means the downtrend is not ready to end. Examining the closing bars
breaking the support area is imperative. On a conservative level you want a pop
up and followed by a failure as your experience grows you will know when to pull
the trigger regardless of a pop up or not.
Anek
Quote from Anekdoten:
Cx,
Then that means the downtrend is not ready to end. Examining the closing bars breaking the support area is imperative. On a conservative level you want a pop up and followed by a failure as your experience grows you will know when to pull the trigger regardless of a pop up or not.
Anek
Cx,
At that point stop market orders should start getting hit like falling dominoes
so as long as previous bar highs are not taken the trend is solid. Definitely no
bright green during that time.
Anek
Quote from Anekdoten:
Cx,
At that point stop market orders should start getting hit like falling dominoes so as long as previous bar highs are not taken the trend is solid. Definitely no bright green during that time.
Anek
Quote from Anekdoten:
You cannot.
This is a winning strategy yours is a losing one.
Sorry to be blunt but averaging down is only for losers and losers alone.
The quicker you convince yourself of this the better.
Stay away from it at all cost it's the fucking plague.
Hope that was crystal clear.
Anek
Ok as explained yesteday I'll be missing in action until further notice.
I'm sure the more experienced journal readers can help the newbies with general
questions.
Good trading.
Anek
With Aneks LOD D/B failure strategy do you just get out of your position or actually reverse your position and take the opposite side
To anyone who can answer: Is it considered an trend if the second high is the exact price level as the previous high or does it acually have to break above the previous high and you do have to higher lows?
Quote from c.profitt:
With Aneks LOD D/B failure strategy do you just get out of your position or actually reverse your position and take the opposite side
Quote from c.profitt:
To anyone who can answer: Is it considered an trend if the second high is the exact price level as the previous high or does it acually have to break above the previous high and you do have to higher lows?
Hi,
Net Loss -$378, bit of a rough day.....did three add trades where I was up
between $80 and $135 on all three only to have them come back to roughly
breakeven. Still getting the hang of when to add, when to scalp out and when to
just take a normal win. Anyway, tomorrow is another day.
Took a small loss trading AAPL.
Cheers ![]()
Quote from TrendPro:
Equal highs is the definition of a double top
An obvious exception that comes to mind is that of an ascending triangle...in which case you would see the equal highs and higher lows as price narrows into the triangle apex.
Quote from TrendPro:
I think your looking at two separate trades. The exit at stop loss somewhere in the middle of the W, then the potential entry short on the overall pattern failure likely below the failed support level where original W tried to form... with the exact short entry dependent on where the next lower high set's up or as weak (bright red) bars form as support fails.
Quote from Razor:
Hi,
Net Loss -$378, bit of a rough day.....did three add trades where I was up between $80 and $135 on all three only to have them come back to roughly breakeven. Still getting the hang of when to add, when to scalp out and when to just take a normal win. Anyway, tomorrow is another day.
Took a small loss trading AAPL.
Cheers
Hey,
Maybe later....have to head out to a meeting.
Cheers ![]()
Quote from Cxinvest:
Post a chart Raz. See if we can figure out what happened.
~Cx
ES Today.
~Cx
Quote from c.profitt:
Would that mean if those two highs were taken out by a new high it would be a considered a trend?
Hey Guys,
I'm doing very well with Anek's system. Perhaps it helps if you take it down
to the most basic levels.
Step A Identify the Trend, Use all the trendlines that you need
Step B Patiently wait for a setup using those strong/weak bars he so kindly
provided
Step C Let price action take you out of the trade
Step D Repeat
Just because one entry did not work does not mean the next will not as long as
the trend
is intact. Another thing that helps is that the strong/weak bars on major
trendlines
are pretty powerful signals. It's crazy but it's hard to lose this way aside
from a crazy day of nothing but chop.
Godspeed, Daniel
Know your patterns
NQ in the morning was nasty, extremely choppy.
Then it produced a Head and Shoulders that failed almost instantly.
Now, if you recall one of my favorite patterns to trade is not the Head and
Shoulder itself but a failed one. God only knows how many bears were trapped on
that thing today. Lucky for us, price action can tells us exactly when to get
out without taking a massive loss when things don't work out.
This is exactly why winners must be ridden as much as possible because things do
fail in trading and absolutely nothing works all the time.
How do we overcome this ?
....by taking only small losses.
Back to my personal matters, just did not want to let this baby go by, they are
a work of art.
Anek
I'll leave the following topic as open discussion.
Head and Shoulders at the LOD ![]()
Hint: not the same as when they pop at the HOD.
....have fun.
Anek
I'm pretty sure I've seen the Tradestation code for the strong/weak bars that
Anek uses, but can't seem to find it. If anyone has it handy and can provide it
again, I would greatly appreciate it.
Thanks.
Here are the two paintbar indicators. Hopefully I've attached them properly and you can download them.
Quote from daniel33:
Hey Guys,
I'm doing very well with Anek's system. Perhaps it helps if you take it down
to the most basic levels.
Step A Identify the Trend, Use all the trendlines that you need
Step B Patiently wait for a setup using those strong/weak bars he so kindly provided
Step C Let price action take you out of the trade
Step D Repeat
Just because one entry did not work does not mean the next will not as long as the trend
is intact. Another thing that helps is that the strong/weak bars on major trendlines
are pretty powerful signals. It's crazy but it's hard to lose this way aside from a crazy day of nothing but chop.
Godspeed, Daniel
OK lets see
HS at LOD would mean that if the pattern actually works the reward is almost
unlimited since there is not much support is that correct anek?
Quote from Anekdoten:
Know your patterns
NQ in the morning was nasty, extremely choppy.
Then it produced a Head and Shoulders that failed almost instantly.
Now, if you recall one of my favorite patterns to trade is not the Head and Shoulder itself but a failed one. God only knows how many bears were trapped on that thing today.
Anek
W
Anyone ,
Tuesday morning , NQ, was this a valid W play ?
__________________
Lets all drink to the death of a clown.
Hi Anek
Thanks for the failed head and shoulders chart pattern today.
When do you enter when you see the a successful Head and Shoulders pattern in
general, is it when you see the a weak bar close below the neckline (horizontal
neckline or a neckline at an angle) ? And place stops above the neckline?
And when the head and shoulder pattern fails in general( not today in
particular), don't you wait till the high of the right shoulder is broken with a
new high bar closing above the right shoulder high?
In today's failed pattern which failed near the LOD, I see in the chart you
entered when the downtrend line is broken, but you waited for a few strong green
up bars to get in. So, when a "failed and shoulder pattern" happens near LOD you
just wait for the downtrend line to be broken and get in early, without waiting
for a confirmation of the right shoulder high being taken off?
Thanks
DisciplineTrader
D,
I very rarely take a head and shoulder neckline break unless it forms at the
very top of the chart as they are only reliable in uptrends. Those that do form
at the bottom tend to fail and I enter in a more aggressive matter in comparison
to a failure at the top.
The same is true for Inverse Head and Shoulders in downtrends.
However, I'm much more enthusiastic about the failures than the pattern
themselves, especially if they form at the "wrong" places.
Sorry guys if I'm leaving questions unanswered currently in a big project.
Anek
Quote from bugsbunny:
OK lets see
HS at LOD would mean that if the pattern actually works the reward is almost unlimited since there is not much support is that correct anek?
Quote from smilingsynic:
Hi, Anek
Not as many as one would think. On a three-minute chart (I don't use cv bars) there was little volume on the bear trap.
Although I have my own approach to trading the NQ (I actually trade the ES more frequently), I do find your journal interesting.
Re: W
Quote from babe714:
Anyone ,
Tuesday morning , NQ, was this a valid W play ?
Thanks Anek for the quick reply.
Goodluck with your project !
How is your AHG automation project coming up?
Thanks
DisciplineTrader
Quote from disciplinetrade:
Thanks Anek for the quick reply.
Goodluck with your project !
How is your AHG automation project coming up?
Thanks
DisciplineTrader
Congestion at Extreme Areas vs Reversals
Make an effort to notice the difference between one and the other.
Usually when price develops a very strong move once it becomes exhausted, it
must rest and consolidates. Mostly because traders are hesistant to jump in at
such levels, they are potentially painful levels and no one wants to get burned.
This is precisely when amateurs start calling reversals or opening positions
after the fact, turning trading into hopes and fears. Please avoid this. This is
when patience will serve you well.
Eventhough reversals are very much possible and offer great risk vs reward this
is exactly why we use and require confirmations. Without the confirmation it is
simply, a gamble and good traders are not gamblers but predators.
Don't fall prey to congestion, congestion offers no hint except the fact that
the previous trend is the strongest but it is also very much tired, at least for
now. From a psychological perspective since you probably missed the whole
initial move you feel frustrated and probably want to ride it all back down (or
up) because the market moves in waves right ? plus you probably feel frustrated
that all this happened right in your face. Well, that's understandable but make
sure an actual good potential setup is developed before stepping into a train.
This is the time when we examine the surrounding support and resistant areas to
see where price might be heading next after we get confirmation(s) so we can
determine our logical targets and see if the risk involved in the trade merits
opening a position when and if the time comes.
Price turns for different reasons and not every reason is significant.
Please remember that.
Hope it helps.
Anek
Good thread Anek ... fulfilling the promise of that first post.
This last point is a great one. One of the worst things that can happen early in
your trading career is to succeed with some spectacular reversal trades. Even
worse if you advertise them to your buddies. Because you've created an internal
monster that can kill you over time.
My personal rule is never to trade against my moving averages and that's
gradually reduced my urge to call tops and bottoms. Internally though, you have
to really, deeply, accept that you are going for the middle bit of the
move.
__________________
------------------------
The things people believe in are usually just
what they instinctively feel is right; the justifications and arguments are the
least important part of the belief.
That's why you can win the argument, prove them wrong, and still they believe
what they did in the first place. You've attacked the wrong thing.
So what do you do? Agree to disagree. Or fight. - C. Zakalwe.
Anek,
In most of your entries, do you think it is best to get in 1 tick above high/low
of prior bar or wait for the closing bar (after completed bar so
tick/volume/minute counter require) to be above/below prior bar's high/low. The
reason I ask is because the more confirmation, the bigger the stop or is it not?
thanks
J
Quote from Anekdoten:
Know your patterns
NQ in the morning was nasty, extremely choppy.
Anek
Quote from bluedemon77:
Sorry if this is a stupid question, but how do you know when you're entering a choppy period? I mean, it's easy to look back and say "wow, that was choppy," but how do you know a trend is ending and you're starting to go sideways? Sometimes it's pretty obvious, like pre-market this morning, but sometimes the swings are big enough with enough breakout to make you think a new trend was starting. I could improve my P&L a lot if I knew the answer to that. I asked this question in another thread I started and basically the answer I got was it can't be done.
Quote from bluedemon77:
Sorry if this is a stupid question, but how do you know when you're entering a choppy period? I mean, it's easy to look back and say "wow, that was choppy," but how do you know a trend is ending and you're starting to go sideways?
Quote from bluedemon77:
Sorry if this is a stupid question, but how do you know when you're entering a choppy period? I mean, it's easy to look back and say "wow, that was choppy," but how do you know a trend is ending and you're starting to go sideways? Sometimes it's pretty obvious, like pre-market this morning, but sometimes the swings are big enough with enough breakout to make you think a new trend was starting. I could improve my P&L a lot if I knew the answer to that. I asked this question in another thread I started and basically the answer I got was it can't be done.
Quote from bluedemon77:
Sorry if this is a stupid question, but how do you know when you're entering a choppy period? I mean, it's easy to look back and say "wow, that was choppy," but how do you know a trend is ending and you're starting to go sideways? Sometimes it's pretty obvious, like pre-market this morning, but sometimes the swings are big enough with enough breakout to make you think a new trend was starting. I could improve my P&L a lot if I knew the answer to that. I asked this question in another thread I started and basically the answer I got was it can't be done.
Quote from dandxg:
One tell-tale way is when the market makes higher lows and lower highs ( or vice versa ), ie. it starts to form a wedge pattern. As the wedge becomes more defined draw it with it out trend lines. Until it breaks and the candle closes stand aside, you with just get chopped up. The alternative is to trade the bounces off the wedge, but this is real high risk. I hope this helps.
The ES is trapped in a 5 point range at all time highs, no surprise there.
You can either ping pong the extremes with miniature stops or....
Wait for breakout bar + 1 tick outside the range, preferably to the upside.
Anek
Hi Anek,
I downloaded the paint bar for the strong and weak bar but I don't see any
difference what should I be looking for? I use tradestations candlestick charts
without the trend, If this helps
Quote from bluedemon77:
It sounds like you're describing a symmetrical triangle or something else?
c.profit ,
change the color of the existing candle sticks to darker green & red
blue,
If I am having trouble finding the chop all I do is look a step up. I find that
when I widen the volume this help to spot the chop and keeps me out till
significant levels are reached. Good luck
Quote from bugsbunny:
c.profit ,
change the color of the existing candle sticks to darker green & red
Quote from bugsbunny:
c.profit ,
change the color of the existing candle sticks to darker green & red
To anyone who can help me I would appreciate it. I am new to the AHG method
of trading. I am having difficulty deciding what time frame chart to trade from
on the ER2. I have a 150 tick, 300 tick, and 600 tick. I find I am getting mixed
signals sometimes on these different time frames. Is there anyone who can give
me some advice as to what time fram would be the best and should I be looking at
different time frames at the same time?
YOur help is appreciated.
Tough 1st half. I will do my 2nd half later. Hope it gets better.
Anek or any other advanced AHG trader,
Would you mind commenting on my trades?
Thanks
J
attachment here
hope you are all making a lot of money right now
M play
Anybody ,
Please tell me this was'nt a valid M play .
__________________
Lets all drink to the death of a clown.
Babe,
Of course it was, why wouldn't it be ?
Anek
Hi all,
Net Gain +$137, yes should have done better with that downtrend; however, I
found myself down over $350 by mid-day so the reality is I did bank almost $500
in that downtrend to get me back to +137
![]()
Had a really nice day on AAPL as well
![]()
Cheers ![]()
Broke the bank in so many ways.
Taking off, not sure where.
Happy trails to you !!!!
Anek
Hey ![]()
Anek, give us a figure pleeeeeaaaseee
![]()
I love to see what is possible out there for me in the future
![]()
Cheers ![]()
Quote from Anekdoten:
Broke the bank in so many ways.
Taking off, not sure where.
Happy trails to you !!!!
Anek
I'm glad to hear I wasn't the only one down this morning. Ended up taking
510.00 per contract on that wild ride down (Thanks to AHG) after being down $290
after this mornings shit.
What a ride that was
This 2nd part.
I could have gotten so much more. Oh well.
Anek,
Would you have added where I have label ed in Magenta color? Do you still keep
stops the same? Say 1st add gets stopped out, and your bias still short. Do you
still keep your original position and add a second time and hope it keeps going
in your direction? Then maybe add a 3rd, 4th or even 5th time? I would love to
see how you traded today. If not, that is fine also because you have shared way
too much. THANK THANK YOU
thanks for lessons and your contributions,
J
Quote from Anekdoten:
Broke the bank in so many ways.
Taking off, not sure where.
Happy trails to you !!!!
Anek
A. When the stouts wear off from celebrating todays action, We would love to
see a chart of your trades, as this was a very mixed day initially, ending with
great opps.
I got chopped up early, but did catch and add to the nice ride down. I am
noticing that all swing failures, say from a downtend, that start with either a
higher low, a double bottom or a higher high with a pullback to a higher low,
all seem to work equally well, just wait for the last high to be closed above
for an entry. Many of those today on the 1000 nq. Just sticking with ones that
involved only single point of s/r. No patterns other than a swing failure. Your
thoughts on this? Which of the marked ones would you not have taken? By the way,
these were not my trades, unfortunately.
Thanks,
D
Quote from bmwhendrix:
A. When the stouts wear off from celebrating todays action, We would love to see a chart of your trades, as this was a very mixed day initially, ending with great opps.
I got chopped up early, but did catch and add to the nice ride down. I am noticing that all swing failures, say from a downtend, that start with either a higher low, a double bottom or a higher high with a pullback to a higher low, all seem to work equally well, just wait for the last high to be closed above for an entry. Many of those today on the 1000 nq. Just sticking with ones that involved only single point of s/r. No patterns other than a swing failure. Your thoughts on this? Which of the marked ones would you not have taken? By the way, these were not my trades, unfortunately.
Thanks,
D
Quote from Anekdoten:
Broke the bank in so many ways.
Taking off, not sure where.
Happy trails to you !!!!
Anek
Quote from bluedemon77:
It sounds like you're describing a symmetrical triangle or something else?
Like this morning, so far (about 11 AM Eastern time now), the ES is in a modest uptrend, but in a very narrow channel, like a 3 point spread from peak to valley. I decided to stay out until it does something more dramatic. Would you guys stay out or jump in at the bottom of a channel and hope you gain enough before the channel breaks down? With a tight stop I guess that wouldn't be too risky, but it doesn't seem worth the small reward, especially so close to the record high.
Anek,
Let me take a deep breath here before I start the "Inquisition".
A) How in the world did you know the NQ would not go below 45 ?
B) Where do you get the nerves to buy all those "Ws" when the sky was falling ?
What keeps you calm, is it the stop?
C) Are we better off trading simmetric triangles only with the direction of the
strong trend ? I noticed you said, only if it breaks downward otherwise ignore,
based on previous trend.
D) I love how you avoid buying the knives unless a reversal formation forms.
Were you waiting for them as price was reaching a meaningful support on the
bigger charts ? Am I right?
E) Do you follow all EMINIS to see if one breaks to get a heads up on another ?
I noticed you saw the NQ die and then took the short on ES *before* the TL
break, that was incredible.
F) Are you human or a robot ? Just kidding.
That was absolutely incredibulous. You are the reason why my wife asks me,
what's up with the chart reading during breakfast, lunch dinner and sex ! rofl
Thank you so much man for that today, thank you so much.
Daniel
Hi everybody.
One little question.
Anybody use Sierra Chart trading NQ with volume chart?
What is your volume setting for trading?
I was mostly using tick chart untill now.
Trying to experiment a little with volume chart too.
Thanks in advance.
P.S. I've read ProfLogig's forum about volume and his square increment
theory,but still interesting to know everybody else setting.
Anek...do you only trade the YM?...if yes why, if no, please explain...thanks!!!
Sierra 1000 - 1500 volume charts. Depends which looks best at the time.
Quote from Vas62:
Hi everybody.
One little question.
Anybody use Sierra Chart trading NQ with volume chart?
What is your volume setting for trading?
I was mostly using tick chart untill now.
Trying to experiment a little with volume chart too.
Thanks in advance.
P.S. I've read ProfLogig's forum about volume and his square increment theory,but still interesting to know everybody else setting.
Quote from increasenow:
Anek...do you only trade the YM?...if yes why, if no, please explain...thanks!!!
Bmw and Tommi, thanks.
ES continues uptrend...1,600 in sight $SPX
Russel top W ?
1000v chart
M top
That looks like a beauty W top Rn86
Another M top on NQ
upon further review .. a double top with middle swing taken out
__________________
Lets all drink to the death of a clown.
Hey,
Net Loss -$81, yup should have cleaned up on that trend but didn't....oh well
Monday is another day ![]()
Did ok on some AAPL trades.
Cheers ![]()
Quote from Anekdoten:
You cannot.
This is a winning strategy yours is a losing one.
Sorry to be blunt but averaging down is only for losers and losers alone.
The quicker you convince yourself of this the better.
Stay away from it at all cost it's the fucking plague.
Hope that was crystal clear.
Anek
Symmetrical Triangle
I got some good lurning today.
Tried to trade a symmetrical triangle.
I would draw my trendlines and see a breakout and take it and it would go
nowhere.
Then I would redraw my trendlines and it would break out the opposite direction
and go nowhere.
Then I would redraw the trendlines again and take another trade thinking I'd
finally catch the move, but wrong again.
So I learned how to draw a bigger and bigger symmetrical triangle.
I think my problem was not waiting for a more impressive bar to break out. Each
time it broke out the bars were pretty weak and it never went far. If anybody
has suggestions on how to avoid this stupidity in the future let me know.
Hi Anek,
I see that an important element of your trading is the confirmation marked by
the close of the most recent bar. I always thought about it as of an arbitrary
moment in the price action, with no particular significance, decided by a round
number of volume or time units. I understand that you have to use it for
backtesting, as usually you don't have access to continuous historical data, but
I don't see why it should be given more emphasis. I see that it works for you,
but I wonder why you consider it so important. Please explain. Thanks.
![]()
Re: Symmetrical Triangle
Quote from macattack:
I got some good lurning today.
Tried to trade a symmetrical triangle.
I would draw my trendlines and see a breakout and take it and it would go nowhere.
Then I would redraw my trendlines and it would break out the opposite direction and go nowhere.
Then I would redraw the trendlines again and take another trade thinking I'd finally catch the move, but wrong again.
So I learned how to draw a bigger and bigger symmetrical triangle.
I think my problem was not waiting for a more impressive bar to break out. Each time it broke out the bars were pretty weak and it never went far. If anybody has suggestions on how to avoid this stupidity in the future let me know.
Re: Re: Symmetrical Triangle
Maybe you can give your opinion too to my question about why the closing of
the bar should be given a special attention? If I start my chart 1 minute later
or 1000 contracts later, all the closings will be different but the price action
will be the same ... ![]()
Quote from dandxg:
Try on a 10 min chart and higher. Make the B/O candle close on the breakout. If you don't wait for the close you often get a fake out. I don't trade these but I do wait for the close to take other entry signals on smaller time frame charts. Make sense?
cnms2:
I too asked him this very same question.
"Why is the close so important to you?"
He said because 90% of his trading is based on highs and lows and until the bar
is closed we don't know what those values will be and that every move he makes
is directly related to the low or highs of previous bars.
Daniel
Thanks daniel33. ![]() I too rely on
bars' highs and lows to read trends, but where the bars close seems of little
importance, except that it is a visible recent price point when looking at the
letest closed bar. When I reviewed the thread I missed your question and
Anekdoten's reply.
I too rely on
bars' highs and lows to read trends, but where the bars close seems of little
importance, except that it is a visible recent price point when looking at the
letest closed bar. When I reviewed the thread I missed your question and
Anekdoten's reply.
Quote from daniel33:
cnms2:
I too asked him this very same question.
"Why is the close so important to you?"
He said because 90% of his trading is based on highs and lows and until the bar is closed we don't know what those values will be and that every move he makes is directly related to the low or highs of previous bars.
Daniel
Quote from Avgdownking:
Your trading is probably lots of small losses and some huge winners mine is the opposite. Tons of small to medium winners and very very few large losses.
ADK
__________________
If at first you don't succeed ...
Re: Re: Re: Symmetrical Triangle
Quote from cnms2:
Maybe you can give your opinion too to my question about why the closing of the bar should be given a special attention? If I start my chart 1 minute later or 1000 contracts later, all the closings will be different but the price action will be the same ...
Hey matey,
Mu suggestion post a chart of all your entries and exits for a typical losing
day (ie: the big losers you say you have every now and then) and also post a
chart of your typical winning day.
Always open to learning and new ideas....the key to life
![]()
Cheers ![]()
Quote from Avgdownking:
Hey man i wish you werent so dense about this. I have a huge respect for what you are doing in this forum and for your trading. One can clearly see from your teachings that you know how to trade based on price action and that is great. Now considering the fact that i am not a daytrader but a swing trader please try to keep an open mind into how AHG can be a monster technique when combined with a responsible form of averaging down. Try to be flexible and see if you can adapt something for me. I only buy support in bullish markets and I only short resistance in bearish markets and also keep in mind I dont average down forever like some crazy lunatics do. Its a reverse form of yours. Your trading is probably lots of small losses and some huge winners mine is the opposite. Tons of small to medium winners and very very few large losses. So what do you say Tutankamen, can we do some trading fusion here ?
ADK
Quote from Razor:
Hey matey,
Mu suggestion post a chart of all your entries and exits for a typical losing day (ie: the big losers you say you have every now and then) ...
__________________
If at first you don't succeed ...
Jimmy, as a former user of the system described by the fella above, with all
due respect, your chart is highly deceptive and one sided. If one were to use
average down/up strategy, that person would have been shorting the market from
the opening to around 1:30Pm when it turned sharply in the other direction. It
seems you are looking at Oct.11 action so let me go over some #s. The market
opened at 1581.50 (give or take a tick), it went from there to 1586.50 (again
give or take a tick). If somebody were to keep buying against the trend by
getting 1 contract for every 1 point climb at the end of the movement, he would
have accumulated 5 contracts at the average price of 1583.50 (again give or take
a tick), THEN, the market would topple and tumble to 1558.50 (again give or take
.... ). Now you do the math: 1583.50 less 1558.50 would give you 25 points per
contract in the green. Now multiply that by 5 and then by $50 and you will get
the amount. Pretty nice chunk of $$$$$. Just to spare you sweating over a
calculator, that comes to 6250 green ones. Not a bad day in any trader's
account.
Now, I do not advocate the averaging down system at all, and making $$$$ with it
is very difficult, requires a lot of $$$ in the account and creates stress
beyond measure (trust me I know). However, with a proper iron clad discipline,
super fat account (250K) and greed firmly in check, it might make money.
MIGHT being the operative word here.
Unfortunately, your chart is illustrating how this system would make a lot of
$$$$ and that is highly deceptive. I was expecting a much better example young
Jedi! LOL
Still love and respect you brother!!!
![]()
![]()
LOL, this is all conjecture on our part until ADK starts sharing some
of the hard and fast regarding his trading, much like what Anekedoten
has shared here, and I've shared on the ES Journal thread.
Here's the gist of it according to what I've been able to figure out:
a) My method make lots of small and medium wins, and always trades with the
trend,
c) Aneke trades with the trend and scales-in on strong directional moves,
averaging-up as it where, with spectacular results,
c) ADK and his method (his words) makes small and medium wins and
occacsionally gets sucker punched by the market,
which of course leaves him reeling on the floor.
![]()
JJ
__________________
If at first you don't succeed ...
Quote from saxon22:
Now, I do not advocate the averaging down system at all, and making $$$$ with it is very difficult, requires a lot of $$$ in the account and creates stress beyond measure (trust me I know). However, with a proper iron clad discipline, super fat account (250K) and greed firmly in check, it might make money.
MIGHT being the operative word here.
__________________
If at first you don't succeed ...
You missed the point Jimmy. Let me restate: In order to illustrate that a
system does not work, you should not provide an example (in this case a chart)
where you are actually illustrating how this particular system on this
particular day would make a ton of money.
See my point?![]()
This might help you guys
If any of you are using Quotetracker I have developed some code and
coinciding paintbars. I personally have written a .dll and autotrade this method
which pretty much enables me to take a load of cash to the bank everyday.
You don't have to autotrade it but I will give the code for the charts if you
like. Here's a pic. Hope this helps.
--GT

Quote from JimmyJam:
Saxon22 you're describing a trader's horror movie movie here, and bad trading, not good trading.
Good trading, just like everything else, m'man, has FLOW.
Good trading, on an intra-day level, should see profits within, oh, say 1/2 hour from your entry. If not, you're usually on the wrong side of the market (in fact, that's a great way to tell).
Good trading is all about taking $5k and turning it into $250k, not starting out with $250k.
Good trading,
JJ
P.S. But if someone wants to do this, hey, it's fine with me ... just don't go around advocating that other traders do it, otherwise, the responsible traders just might have a problem with that.
Re: This might help you guys
Quote from gohstrader:
If any of you are using Quotetracker I have developed some code and coinciding paintbars. I personally have written a .dll and autotrade this method which pretty much enables me to take a load of cash to the bank everyday.
You don't have to autotrade it but I will give the code for the charts if you like. Here's a pic. Hope this helps.
--GT
Quote from saxon22:
Not to completely hijack this thread, but if making over 6K a day is a horror movie to you then I guess you are in another league than I am.
There is no bad trading or good trading. If at the end of the day, week, month year your account is in the + your trading has achieved is objective. Unlike ballet, of figure skating, trading does not have to be pretty, good, fine, ect. It has to be profitable, forget FLOW, this ain't no rap music. Flow has nothing to do with trading, it is about putting $$$$$ in your pocket and it does not matter if it is pretty or not.
As for good trading. It is not going from 5K to 500K in a year (which would be nice). It is about getting that $500 or 1K a day most days and enjoying life. If it takes 250K to produce that kind of returns, that is nothing to sneeze at. A dare you to back test the following system: accumulate only with the long term trend at 5 intervals starting at opening position + 5. Example: Market opens at 1570, first buy (since we are in a long term bull trend) at 1565, then 1560 and 1555. Exit when you are - 3% for the day (7.5K on a 250K account) Sim it and tell me if it works.
__________________
If at first you don't succeed ...
Averaging up/Averaging down? Seems pretty simple to me now. Often we hear
comparisons of trading to starting any kind of business and the failure rate of
new enterprises. I think a similar comparison can be made to expanding a new
business. If it is successful, then expand, If not why would you want to open
another store, add more people, but more equipment, etc.
If the original premise of a business or trade does not work out, I can
understand allowing a little room for a turnaround, but that's it. Throwing
money into a losing business or a losing trade is just plain gambling just to
avoid the pain of accepting the obvious. When I started trading many years ago,
I would often widen my initial stop as the trade moved against me, in order to
give the maket more time to understand that I WAS RIGHT..........I was stupid.
FWIW
Re: This might help you guys
Quote from gohstrader:
If any of you are using Quotetracker I have developed some code and coinciding paintbars. I personally have written a .dll and autotrade this method which pretty much enables me to take a load of cash to the bank everyday.
You don't have to autotrade it but I will give the code for the charts if you like. Here's a pic. Hope this helps.
--GT
[chart]
__________________
If at first you don't succeed ...
Quote from bmwhendrix:
Averaging up/Averaging down? Seems pretty simple to me now. Often we hear comparisons of trading to starting any kind of business and the failure rate of new enterprises. I think a similar comparison can be made to expanding a new business. If it is successful, then expand, If not why would you want to open another store, add more people, but more equipment, etc.
If the original premise of a business or trade does not work out, I can understand allowing a little room for a turnaround, but that's it. Throwing money into a losing business or a losing trade is just plain gambling just to avoid the pain of accepting the obvious. When I started trading many years ago, I would often widen my initial stop as the trade moved against me, in order to give the maket more time to understand that I WAS RIGHT..........I was stupid. FWIW
__________________
If at first you don't succeed ...
Quote from JimmyJam:
a) Aneke has started a thread in which he has been roundly complimented by a small cadre of traders trying to help the beginners cut through about 3 years of of a very painful learning curve. He uses a money management technique which requires a talent that you (and most people) don't have, it's counter intuitive and takes more than the ability to read price action to implement.
__________________
If at first you don't succeed ...
Re: Re: This might help you guys
Quote from billdobson1972:
there are lot of QT users here...care to explain what these paintbar does. i followed your other message u seem to be ready to help others..keep it up friend...
Re: Re: Re: This might help you guys
Quote from gohstrader:
Always glad to help where I can. The top paintbar is simply comparing itself the previous bar close. The bottom bar is a 12/25/3/3 SMI crossover. the SMI (Stoch Momentum Indicator) basically defines the short term trend while the top paintbar gives u a precise entry. I use this along with an automated buy/sell program with a fixed/progressive tick stops and exits. If you notice the chart I am using either 0.5 or 1.0 rangebars candlesticks.
The reason I do this is because it always affords me the opportunity to trade profitably even while a choppy market with whippy 1,3,and 5 minute bars are stopping people out.
There are those that will tell you that sure, you can make money this way, but it will cost u a fortune in commisions. I have to laugh at them after I show them that trading 6-9 contacts at a gain of .50 to 1 point a car far outweighs the loss of the same contract one might trade in a whipsaw market. At least this is what works for me. I also now enter 3, 3, and 3 cars and scale out at pre-determined tick level depending on the market trend for that day and it works for me and my trading personality.
Good Trading to you and hope this helps.
-GT
Paintbar code
It's nice to see the sincerity of this thread, so thanks Anek and the rest of
you guys/gals. I have received over 38 PM's asking for code etc in the last 30
minutes. I will post both the simple SMI crossover code and the other code for
the top pane in the chart posted earlier here so I don't have to spend so much
time replying to all who took the time to Pm me.
The top pane code which I have no name for (feel free to name it yourselves, but
a guy by the name of mjh whom I belive Anek knows gave it to me. MJH also took
the time to help me after I blew up my first account and taught me more about
myself and my fears than anything else)
I will not provide the .dll and some other stuff for my autotrading due to the
fact that it's quite complicated nd is related to software called WealthLab. I
also did not develop it and it was given to me with the premise that I ask the
person who wrote it (mjh) before I ever handed it to anyone. So if you ask him
I'm sure he would provide it to you free.
Paintbar code top pane:
if Bar Open[1]
Paintbar code bottom pane (SMI Crossover)
if (Stochastic Momentum Index(12,25,3,3).Main <
Stochastic Momentum Index(12,25,3,3).Signal) and
(Stochastic Momentum Index(12,25,3,3).Main[1] <
Stochastic Momentum Index(12,25,3,3).Signal[1]) set color to $8080FF
else if (Stochastic Momentum Index(12,25,3,3).Main >
Stochastic Momentum Index(12,25,3,3).Signal) and
(Stochastic Momentum Index(2,25,12,5).Main[1] >
Stochastic Momentum Index(2,25,12,5).Signal[1])
set color to $80FF80
it should also look like this in QT:

Please note that when you post the code into QT as a new paintbar for the SMI it
will see the native SMI (lines that look like a fast stochastic) You have to
open that indicator and make sure that the settings look like this exactly
otherwise the SMI paintbar won't show up:

[Good Trading to all of you.
-GT
GT,
do you know where to start coding dll for QT, any manual or sample code to get
started?
thx
Coming out of the woods for a quick comment since I'm relaxing and taking a
break from trading and the journal to spend quality time with the family.
This thread, my journal, is all about sharing so feel free to discuss anything
that heads into that direction.
Even if your method goes against AHG or uses 10 indicators as long as it is in
the spirit of sharing you got my blessing. Any experienced trader knows there
are possibly an infinite number of ways to trade profitable so an open mind is
necessary.
The one thing I ask is that remains civil.
Keep the spirit of sharing, Karma is a powerful thing, I promise you, the more I
share the more good things I find around the corner. Not only in trading but in
life itself. I am at the pinnacle of my life as it is now and I'm sure there are
more good things to come as long as I keep walking this path which I recommend
with all my heart.
Thanks.
Anek
Re: Paintbar code
Quote from gohstrader:
It's nice to see the sincerity of this thread, so thanks Anek and the rest of you guys/gals. I have received over 38 PM's asking for code etc in the last 30 minutes. I will post both the simple SMI crossover code and the other code for the top pane in the chart posted earlier here so I don't have to spend so much time replying to all who took the time to Pm me.
The top pane code which I have no name for (feel free to name it yourselves, but a guy by the name of mjh whom I belive Anek knows gave it to me. MJH also took the time to help me after I blew up my first account and taught me more about myself and my fears than anything else)
I will not provide the .dll and some other stuff for my autotrading due to the fact that it's quite complicated nd is related to software called WealthLab. I also did not develop it and it was given to me with the premise that I ask the person who wrote it (mjh) before I ever handed it to anyone. So if you ask him I'm sure he would provide it to you free.
__________________
If at first you don't succeed ...
Gentlemen,
Please understand that I am not unwilling to give you any and all of what I
have/use for trading. I have received over 60 PM's all asking for the .dll/API I
use for auto trading and some of you have made snide remarks regarding my
reluctance to "give it up" as one person put it.
First off as I said earlier today, I did not do any of the auto programming. mjh
did it and gave it to me after mentoring me for months. He asked me to not
disclose it to anyone unless I had asked him first about it. So if he answers
one of several e-mails I have sent him and consents--it's all yours believe me.
Im just honoring a promise I made to someone who took the time to bail me out
when I was so down on my luck I can't even begin to tell you. He (mjh) also did
it without asking for a single dime. I didn't even ask him to help me, he
offered after he found out I was struggling.
Secondly, after repeated attempts to pay him something etc., he only asked that
I try to help someone in the future etc. I do not feel in any way qualified to
do that as much as some of the other guys like Anek and JJam and Austin etc.,
but I do know what I use (even before I started auto-trading) works. It's
simple, it fits my trading persona, and it won't kill me if I miss. I have
posted it here today (paintbars etc.) and thats all it is. Simple,
uncomplicated, profitable.
So, if mjh answers his e-mails I have sent ( I have not heard from him in over 5
weeks) and gives me his blessing I will share all of it with you guys. Until
then I will try to help in any other way I can.
I think this Journal that Anek started and everyone else contributes to is a
much needed fresh breath for ETand also believe this is how we will all prosper
mentally as well as monetarily.
Good Trading and sorry for the long winded diatribe.
--GT
I also watch the tape ( raw data time and sales) like a hawk until my eyes wanna
fall out sometimes but now I can almost hear my CPU picking up speed when the
volume starts to move so I am getting better at it. That helps me with the
bigger momo moves.
Quote from Anekdoten:
Keep the spirit of sharing, Karma is a powerful thing, I promise you, the more I share the more good things I find around the corner. Not only in trading but in life itself. I am at the pinnacle of my life as it is now and I'm sure there are more good things to come as long as I keep walking this path which I recommend with all my heart.
Thanks.
Anek
thanks a lot gohsttrader for sharing. I personally would like to do it on my
own in ninja as I am too vested to learn wealthlabs.
Could you please share your method from the point of view of targets and exits
once you enter. I am more interested in the stop losses , trailing stops etc.
Unfortunately Ninja 6.0 does not have rangebars (yet). Version 6.5 beta out in a
few weeks does. So this gives me some time to learn strategy coding.
cheers
SS
Indicators in ELS format
Hi all,
Great thread. It's a big help in removing the clutter in one's trading process
that accumulates over time.
Just wondering if anyone has the s/r and paintbar indicators in ELS format
instead of ELD.
Cheers
wiz
I have very limited experience with SMI but I recall a time when my friend
MJH sent me the function and ELD for evaluation.
This should help those wanting to automatize the system so kindly described by
gohstrader for Tradestation and/or backtest ideas to polish it.
If you find it useful please report any progress findings otherwise we go back
to step 0 and only a certain few gain from it.
Hope it helps.
Anek
And for those just wanting the code....
SMI Function
{Type : Function, Name : SMI}
input:
length1(NumericSimple),
length2(NumericSimple),
length3(NumericSimple);
var:
HH(0),
LL(0);
HH = Highest(H,length1);
LL = Lowest (L,length1);
SMI = 100 * (XAverage(XAverage(C-(0.5*(HH+LL)),length2),length3) /
(0.5 * XAverage(XAverage(HH-LL,length2),length3)));
SMI Indicator once you got the function
Input:Length1(13),Length2(25),Length3(2),AlertLevel(40),
UpColor(green), DwnColor(magenta);
Value1 = SMI(length1,length2,length3);
plot1( Value1, "SMI" );
plot2( AlertLevel, "Sell line" );
plot3(-AlertLevel, "Buy line" );
plot4(0, "Zero");
if plot1 crosses above -AlertLevel then
alert("SMI crosses above buy line");
if plot1 crosses below AlertLevel then
alert("SMI crosses below sell line");
If value1>value1[1] then begin
plot1[1](value1[1],"SMI",upcolor);
plot1(value1,"SMI",upcolor);
end else begin
plot1[1](value1[1],"SMI",dwncolor);
plot1(value1,"SMI",dwncolor);
end;
Hi Anek:
Welcome back. I guess you missed my earlier question. Would you please comment
on why do you consider the closing of the bar an important confirmation point?
Thanks.
Quote from Anekdoten:
I have very limited experience with SMI but I recall a time when my friend MJH sent me the function and ELD for evaluation.
This should help those wanting to automatize the system so kindly described by gohstrader for Tradestation and/or backtest ideas to polish it.
If you find it useful please report any progress findings otherwise we go back to step 0 and only a certain few gain from it.
Hope it helps.
Anek
Quote from cnms2:
Hi Anek:
Welcome back. I guess you missed my earlier question. Would you please comment on why do you consider the closing of the bar an important confirmation point? Thanks.
Thanks ![]()
[QUOTE]Quote from Anekdoten:
Coming out of the woods for a quick comment since I'm relaxing and taking a
break from trading and the journal to spend quality time with the family.
This thread, my journal, is all about sharing so feel free to discuss anything
that heads into that direction.
Even if your method goes against AHG or uses 10 indicators as long as it is in
the spirit of sharing you got my blessing. Any experienced trader knows there
are possibly an infinite number of ways to trade profitable so an open mind is
necessary.
The one thing I ask is that remains civil.
Keep the spirit of sharing, Karma is a powerful thing, I promise you, the more I
share the more good things I find around the corner. Not only in trading but in
life itself. I am at the pinnacle of my life as it is now and I'm sure there are
more good things to come as long as I keep walking this path which I recommend
with all my heart.
Thanks.
Anek [/QUOTE
Anek,
I am extremely impressed by your generosity and willingness to help so many of
us traders that have struggled in the markets for so long. When someone gets
into trading and sees the potential in it for wealth and even more important, a
wonderful lifesyle where your time can be devoted to family and the other things
that make live meaningful. One cannot help be drawn into it. However, so many
people have ended their pursuit in failure, not because of lack of trying but
because of all the false, misleading information spewed out by those who are
trying to make a buck selling their system. You could have easily followed their
course and sold your insights (which would be worth every penny), but instead
chose to give them away. I want to thank you and I feel very lucky to have found
your thread. I hope that you are repaid a thousand times over for your
generosity.
hear hear
C.Profit,
Thank you for your kind words. Change begins with a first step right?
Quick question.
Aside from publications have you ever found the magic indicator, the money
making system for sale at 19.99 or even 9999.99 ? It's all bullshit.
An edge, plus money management, plus discipline and screen time cannot be bought
and automation does not work forever.
The hard truth is a successful daytrader does not need petty cash from any form
of business because everything else pales in comparison unless you start a fund
or take it to next level but that implies complications.
Shoot me in the head before I go back to customers, schedules, accounting,
marketing and all those headaches.
Like I said in a previous post let me be, trading with my hot coffee at home
with balls hanging out of my shorts as the kids kiss me goodbye for school while
I scalp the eminis. I know not a pretty sigh and probably the exception and not
the rule but nevertheless a realistic scenario that does happen from time to
time. ![]()
Anek
Indicator Project
Here is an idea for any Easy Language coder that wants to produce something
useful for him/herself and the community.
A real time indicator that plots the following on the charts:
-Continuous line plot of HOD
-Continuous line plot of LOD
-Continuous line plot of mid point between HOD and LOD
-Continuous line plot of mid point between mid point and LOD
-Continuous line plot of mid point between mid point and HOD
All dynamic and ever changing as HOD and LOD is obviously taken to new levels.
Extra effort. If price is above any of the 3 middle lines such line should plot
green and below red.
Why ? Because due to complacency (bulls and bears meeting half way) you will be
amazed at how many times these points are visited by price throughout the day
sometimes allowing you to buy or short with very low risk and great results.
Hope someone comes forward and creates it, should be a simple but useful
project.
I promise you I'm not wasting your time, combined with my paintbars it's a
beautiful powerful tool ![]()
....and if no one does it I'll do it but would rather use free time for other
things.
Anek
I have a name for it - Anek's market e-motion indicator.
__________________
"TRADE WHAT YOU SEE" - Master Osorico
Chart Explanation
I had a few more PM's for further explanation of paintbars I use in the
chart. Anek, I apologize if I'm taking this off track on you so I'll make this
one quick to finish what I seemed to have started.
BTW--if you guys are thinking of using the paintbars for the YM I strongly
suggest you use nothing lower than 2.0 setting on the range bar candlestick
charts. ).5 or 1 is great for the ER, ES, and ZG.
Ok the following chart shows two colored "paintbars" at the bottom of the top
pane and are really native indicators to QT. (also Sierra and I believe
e-signal).
One is called Woodie's ChopZone indicator (after Ken Wood from Woodie's CCI
club). And the other is called Woodie's Sidewinder.
Both are trend indicators and when you have them syncing in color i.e. powder
blue under green or Brown under Green that's when you have a nice momentum trend
going on.
As I explained before I scalp 1 - 3 points all day long on the ES, ER, NQ, and
ZG but when I see the CZI and Sidewinder line up I'm in for the long haul. I
simply draw a trendline and wait for it to be breached. (Picture Attached)
One more thing, I think someone wanted to know how I manage money thruout the
day. I have two methods but I will only explain one in that the other is built
into my API.
I use Bracket Trader which cost me a flat "one time for life 100 bucks" which
allows me to automatically scale in and out of positions at pretermined points.
ZeroLine trader is another one.
Its just personal preference but both are add-ons for IB TWS.
Strategy is simple. I will use 3 car ER2 example that I actually use for
scalping. When I see my buy or sell (short) point I'm in all 3 cars. First
profit target is 4 ticks, second is 8 ticks and the last one is a "runner" with
a 2 point cap unless I see the brown/powder blue bars with trend as shown in the
chart pic like I did last Thursday. Then I cancel my "runner" cap and go for it.
With Bracket Trader you can click a button and increase or decrease risk in
nanoseconds or you can also flatten or hit the Break-even button. I was asking
if IB had such a tool but they said its in the works but for 100 dollars I can
go get a cup of coffee without worrying about what happens if my computer goes
down or if the market reverses etc.
I do not have any affiliation with either mentioned company FWIW.
Here is a chart of the ES showing CZI and Sidewinder

Good Luck and Good Trading to all of you!!!
Gohstrader,
Carry on, the people love you ![]()
Anek
JSSPMK,
Modified some existing code to obtain a rough draft.
Beta and non tested will still allow a member of the community to contribute.
Move to the side GS, ML, DB etc, the sharing trading community is out there to
get a share of the pie too ![]()
Anek
Back to the woods, have a pleasant weekend.
Anek
Quote from Anekdoten:
C.Profit,
Thank you for your kind words. Change begins with a first step right?
Quick question.
Aside from publications have you ever found the magic indicator, the money making system for sale at 19.99 or even 9999.99 ? It's all bullshit.
An edge, plus money management, plus discipline and screen time cannot be bought and automation does not work forever.
The hard truth is a successful daytrader does not need petty cash from any form of business because everything else pales in comparison unless you start a fund or take it to next level but that implies complications.
Shoot me in the head before I go back to customers, schedules, accounting, marketing and all those headaches.
Like I said in a previous post let me be, trading with my hot coffee at home with balls hanging out of my shorts as the kids kiss me goodbye for school while I scalp the eminis. I know not a pretty sigh and probably the exception and not the rule but nevertheless a realistic scenario that does happen from time to time.
Anek
Quick look at the SMI
Guys -Here's a quick look and a brief description of the SMI. With a little
Practice you can use it for spotting trends and reversals. Use it with the
paintbars to scalp/trade with the trend up or down.
Explanation of SMI: (Quote source unknown)
"While similar to the Stochastic Oscillator, the SMI displays where the close is
relative to the midpoint of the recent high/low range, as compared to the close
relative to the recent high/low with the Stochastic Oscillator. This result is
an oscillator that ranges between -100 and +100 and can be a bit less erratic
than an equal period Stochastic Oscillator.
The oscillator is comprised of two lines, the SMI (green) and the moving average
of the SMI (red). When the close is greater than the midpoint of the range, the
SMI will be positive. When the close is less than the midpoint of the range, it
will be negative.
The interpretation of the SMI is virtually identical to that of the Stochastic
Oscillator. The most basic pattern to trade from is to buy when the SMI falls
below -40 and then returns above it. Sell when the SMI rises above +40 and then
falls back below that level. Another trading signal is buy when the SMI rises
above the moving average, and sell when the SMI falls below the moving average."
and a pic of how I use it:

I hope this helps.
-GT
Error message
I keep getting an error message when i try to save the top pane indicator in QT paint bar editor . Anyone have an idea what i'm doing wrong ?
__________________
Lets all drink to the death of a clown.
Re: Chart Explanation
Quote from gohstrader:
Ok the following chart shows two colored "paintbars" at the bottom of the top pane and are really native indicators to QT. (also Sierra and I believe e-signal).
One is called Woodie's ChopZone indicator (after Ken Wood from Woodie's CCI club). And the other is called Woodie's Sidewinder.
"The ones you should ignore (for now) because they require greater
skill to consistently profit from or
simply, the sideway ones:
Congestion/Indecision = higher lows, lower highs (Symmetric Triangle
formations)
Consolidation = horizontal lows/highs" - Anek
The way I approach a pennant is by looking at MACD's histogram. There has to be
something that points to a direction where price is more likely to go at a time
of a breakout. ImO it ain't enough to assume that a pennant forming during an
uptrend day will provide a bullish breakout, of course it is logical, but not
enough.
At the attached charts on left there is 2 minute chart & 1 minute on right. On 2
minute chart we see a histogram below the centreline and what's very important
it has put in a bullish pattern where 2nd dip is higher than 1st (similar to
price oscillation W).
1 minute chart's histogram provides a trigger point, there was a bearish
pattern, but as we got closer to 8.30am data release histogram has put in a
bullish pattern (it's below centreline and 2nd dip higher than 1st). And that
2nd higher dip is indeed a trigger, GO LONG
![]()
That's how I trade pennants. The end.
__________________
"TRADE WHAT YOU SEE" - Master Osorico
Re: Error message
Quote from babe714:
I keep getting an error message when i try to save the top pane indicator in QT paint bar editor . Anyone have an idea what i'm doing wrong ?
__________________
If at first you don't succeed ...
J,
Here is a more dramatic example as this one makes a trend reversal.
Of course, price action also gave it away.
Anek
.......and the mighty one.
The triangle of the YM daily
Anek
To conclude I don't pay attention to divergence but some seem to play it
effectively so more power to them.
Anek
Sorry, but to me SMI is just another oscillator, with all the warts and wrinkles.
The only indicator one needs is price. WHY? All others are irrelevant. The
sooner traders learn this the faster they will get close to being successful.
Secondary indicators other than volume are nothing but distractions and in this
market no one needs distractions. Secondary indicators are calculated off of
price. Why use second best when you have the best? PRICE! PRICE! PRICE!
JMHO ![]()
__________________
Dinoman
Re: Error message
Quote from babe714:
I keep getting an error message when i try to save the top pane indicator in QT paint bar editor . Anyone have an idea what i'm doing wrong ?


For the ongoing indicator project - go to Kreslik.com and look for TRO PLOT -
simple indicator to plot up to seven user inputs.
Use as input High for HOD, Low for LOD, (High+Low)*.5 for midpoint between HOD
and LOD, (High+(High+Low)*.5)*.5 and (Low+(High+Low)*.5)*.5 for upper and lower
midpoints respectively.
Quote from Rn86:
For the ongoing indicator project - go to Kreslik.com and look for TRO PLOT - simple indicator to plot up to seven user inputs.
Use as input High for HOD, Low for LOD, (High+Low)*.5 for midpoint between HOD and LOD, (High+(High+Low)*.5)*.5 and (Low+(High+Low)*.5)*.5 for upper and lower midpoints respectively.
__________________
Dinoman
Rn,
In TS is HIGHD(0) and LOWD(0) so for Tradestation the correct inputs would be:
Use as input HighD(0) for HOD, LowD(0) for LOD, (HighD(0)+LowD(0))*.5 for
midpoint between HOD and LOD, (HighD(0)+(HighD(0)+LowD(0))*.5)*.5 and
(LowD(0)+(HighD(0)+LowD(0))*.5)*.5 for upper and lower midpoints respectively.
Good quick solution Rn.
Anek
Quote from dinoman:
With all do respect this stuff is a totaly disservice to all that follow this threads originality!
These are nothing more than distractions after distractions.
Anek can correct me if he feels I am wrong and I will shut my pie hole.
defining highs and lows
Anek,
First off, great journal. It is very rare to have someone share as unselfishly
as you have- thank you. I have been reading as much as possible through this
journal (gotten pretty big) and I have what is probably a dumb question for you:
How specifically do you define a high or low?
Is it a one bar reversal ie trending up, and then you get one down bar? Does it
have to break the low of the previous bar? Does it have to be a 3 or 5 bar
pivot? A certain point or percentage retracement?
I know that 50% retracements are ideal, but obviously they don't always happen,
especially in strong reversal trends that have very shallow retracements and are
difficult to jump on.
It may be an very silly question, and possibly answered elsewhere in the
journal, but one I am interested to hear your views on. I have a method that I
use for determing a high/low/pivot, and hindsight makes all things clear, but
the hard right edge can make the clearest of things murky in the heat of battle.
Thanks in advance.
TJ
Quote from dinoman:
With all do respect this stuff is a totaly disservice to all that follow this threads originality!
These are nothing more than distractions after distractions.
Anek can correct me if he feels I am wrong and I will shut my pie hole.
Quote from Anekdoten:
I find amazing value in Fibonacci Retracements.
In fact, on Thursday due to this "distraction" you speak of, I managed to call the low of the NQ sell off with plenty of advanced noticed and was only off by 3 ticks using Fibonacci plus support and resistance values on the multi day charts. What are the odds on that when NQ was free falling?
Perhaps Daniel who was present can post a log.
You could say it was coincidence but after all these years trading I will tell you it is not because I see it time after time.
On Friday, breaking .50% gave me a solid green light, breaking .618 solidified my suspicion of a possible full retracement, etc etc etc. These points of complacency are no joke my friend.
I do agree that price is all you need and oscillators are distractions, no offense to anyone, but horizontal lines based on Fib for Zig Zag and S/R analysis is some serious powerful stuff and probably the only real "predictor" I've ever found in trading.
It gives you sense of power, weakness, probable points of support and resistance and a whole lot of more stuff but running late for dinner
The fact that you work with price alone speaks loudly of your skill but when it comes to "El fib" you are missing out
Anek
__________________
Dinoman
Fibonacci Illustration for Thursday on NQ.
Dig in folks, more candy for the brain!
Anek
The Fibonacci multi day illustration I was analyzing on Thursday.
BTW, to some the 61.80 is 23.60% but got the bad habit of drawing them always in
the same direction, just thought I would clarify that.
Anek
PS: Typo on chart, loss = lost
The Fibonacci illustration for the conclusion of the analysis.
I close the chapter with the elusive question one more time.
Coincidence ?
My personal humble opinion... NO WAY !
![]()
Anek
I got to hand it to you Anek I love it when you let us take a look at your
trading mind. You got a gift for this. Say, would you be interested in
formulating an averaging down version of your trading style? Im serious here, if
you are anywhere near the West coast or willing send me a PM. Im also a trend
follower but I take different precautions to avoid the chop noise and fakes.
Looking forward to your response and keep up the good work, some seriously good
trading stuff you teach here.
ADK
Quote from dinoman:
The only indicator one needs is price. WHY? All others are irrelevant. The sooner traders learn this the faster they will get close to being successful. Secondary indicators other than volume are nothing but distractions and in this market no one needs distractions. Secondary indicators are calculated off of price. Why use second best when you have the best? PRICE! PRICE! PRICE!
JMHO
__________________
"TRADE WHAT YOU SEE" - Master Osorico
Quote from Anekdoten:
J,
Here is a more dramatic example as this one makes a trend reversal.
Of course, price action also gave it away.
Anek
__________________
"TRADE WHAT YOU SEE" - Master Osorico
fib numbers
Hi Anek,
Of course fibonacci Numbers work, all that's required for them to work is that
enough people pay attention to and act on them for us to track their trades, in
order to anticipate low risk / potentially high reward trades. The very fact
that the markets react on or very close to these levels regularly shows that
enough people do in fact pay attention to these numbers.
On the other hand, usually T A indicators are tricked up to each individual
traders feel for the markets and therefore produce a broad range of outcomes.
This implies less direct impact on the markets for most of them, and makes them
much harder to follow for intelligence purposes.
Best Regards
Johno
real time fibs
Hi Anek,
A quick question if I may, one of your charts appears to have a continuously
updated Fib function, is that possible on TWS and Quote Tracker.
Thanks
Johno
Anek,
Thanks for the tip on how to use Fib differently. I never thought it would be
used that way. Last friday, it must have caught alot of Fib traders by surprised
as many of them shorted without a stop around 50-61.8% retracement levels. I was
one of them but I did take my loss because I always have a stop. Small loss too
and glad I took my stubborn cap off and decided not to keep shorting the market.
thanks
J
Re: real time fibs
Quote from Johno:
Hi Anek,
A quick question if I may, one of your charts appears to have a continuously updated Fib function, is that possible on TWS and Quote Tracker.
Thanks
Johno
Quote from JtraderK8:
Anek,
Thanks for the tip on how to use Fib differently. I never thought it would be used that way. Last friday, it must have caught alot of Fib traders by surprised as many of them shorted without a stop around 50-61.8% retracement levels. I was one of them but I did take my loss because I always have a stop. Small loss too and glad I took my stubborn cap off and decided not to keep shorting the market.
thanks
J
Hi Anek,
Thanks for the fibonacci illustration of NQ. For the the Thursday's illustration
, in the "fib.illustration.1.jpg" you posted earlier at "10-13-07 09:43 PM", can
you please tell me what the colored lines are. Is it the mid lines thing you
mentioned earlier.
Dark Green moving line near the highs -- HOD (updates dynamically as a new high
is formed)
Light Green moving line near the lows --- LOD (updates dynamically as a new low
is formed)
Pink moving line --- 50% Fib retracement or the mid line between HOD and
LOD(updates dynamically )
And the other two, the middle of the midline and HOD and middle of midline and
LOD, so its like 25% and 75% fib retracement. You had to code them to plot these
lines dynamically or configuring TRO indicator did the purpose.
As you said earlier, you use these dynamic lines only for "target assesment"
after you enter a trade and not for entry assesment, is it correct.
I appreciate your time and help.
Thanks
DisciplineTrader
D,
Ya I simply used the TRO plot with the idea RN presented but with the corrected
functions of Tradestation.
Perhaps I was not clear on the previous post. You can use it for entry and
targets, as always combined with price action, just don't use it for trend
detection because in that respect, price does not lie unless it's a fake.
This technique takes screen time and it's hard for me to present some hard
rules. My best suggestion is to use it and study it carefully because it is a
very strong predictor.
The one tip I can provide is to examine the amount of times these areas of
"complacency" have meaning to the traders. Kind of like the "meet me half way"
phrase...., in the end, Fib or not, that's all it really is, a mid point in the
battlefield, followed by more midpoints and then some. If you look carefully,
most waves got these retracements and ext
Characteristics and peculiarities of price action is how I really see it.
Anek
Thanks Anek. I appreciate it.
Thanks
DisciplineTrader
Quote from Avgdownking:
I got to hand it to you Anek I love it when you let us take a look at your trading mind. You got a gift for this. Say, would you be interested in formulating an averaging down version of your trading style? Im serious here, if you are anywhere near the West coast or willing send me a PM. Im also a trend follower but I take different precautions to avoid the chop noise and fakes. Looking forward to your response and keep up the good work, some seriously good trading stuff you teach here.
ADK
Opinion on Market Delta tool
Anek or anyone, did you try market delta software for finetuning trade entry
using AHG?
I am not yet skilled in tapereading, so was trying to see if this tool can be
used as an alternative to tapereading to look inside the strong/weak bars.
Thanks
DisciplineTrader
D,
No interest in MD ![]()
Anek
Thanks Anek. Can you please suggest a good way to learn tapereading skills. I
know its tough to attach snapshots( as its dynamic), but any tips to improve
tapereading skills.
Time and Sales is like a "pace indicator" or "volume spike indicator" right?
Thanks
DisciplineTrader
Quote from disciplinetrade:
Thanks Anek. Can you please suggest a good way to learn tapereading skills. I know its tough to attach snapshots( as its dynamic), but any tips to improve tapereading skills.
Time and Sales is like a "pace indicator" or "volume spike indicator" right?
Thanks
DisciplineTrader
Ghost scalping
Gohst,
Regarding your money management , would your initial stop be 4 ticks same as 1st
Target or just 1 tick under initial entry bar ?
At what point do you go to break even ?
Do you simply enter with market orders as soon as the colors match ?
Also did'nt understand what determines aggressive versus non agressive entry .
Thanks for your help .
__________________
Lets all drink to the death of a clown.
Indicator Project
Here is an idea for any Easy Language coder that wants to produce something useful for him/herself and the community.
A real time indicator that plots the following on the charts:
-Continuous line plot of HOD
-Continuous line plot of LOD
-Continuous line plot of mid point between HOD and LOD
-Continuous line plot of mid point between mid point and LOD
-Continuous line plot of mid point between mid point and HOD
All dynamic and ever changing as HOD and LOD is obviously taken to new levels.
Extra effort. If price is above any of the 3 middle lines such line should plot green and below red.
Why ? Because due to complacency (bulls and bears meeting half way) you will be amazed at how many times these points are visited by price throughout the day sometimes allowing you to buy or short with very low risk and great results.
Hope someone comes forward and creates it, should be a simple but useful project.
I promise you I'm not wasting your time, combined with my paintbars it's a beautiful powerful tool
....and if no one does it I'll do it but would rather use free time for other things.
Anek
__________________
js
Quote from Cxinvest:
ES Today.
~Cx
Will post tomorrow's trading... have been doing it on my own just havn't had
time to post with midterms.
In the spirit of sharing... here is my weekend research. Good luck all.
And another...
Quote from kidPWRtrader:
Will post tomorrow's trading... have been doing it on my own just havn't had time to post with midterms.
In the spirit of sharing... here is my weekend research. Good luck all.
Try zooming up. The images are actually really high resolution so you should be able to get them as big as possible.
I can't see those charts. Have you personally tried to zoom in on them? I have, they are not readable to me- at all.
Readable on my end. Hmm... did I screw something up and not know about it...
It works fine....you just need to open it in microsoft word and then enlarge the document to 150 %....if you are interested.
Major frustration.![]()
I can't believe I'm losing money n NQ today.
I think I move my stops too tight too early. Seems today the min logical stops
are between 3 and 5 points.
I think discipline is my #1 objective.
-Tech
Tough day too even though it looked easy because of the clear downtrend. Got
chop to death from 11-1 p EST trying to short the market after missing the big
move down. Maybe I need to learn to recognize the chop zones or stop after 2
consecutive losses. OH well.
Hope it gets better later on. Looking for shorts only at the moment.
Some of my trades you cant see as I was taking them off of trendline breaks
and strong candles on smaller time frame.
Not my best day... Ran 2 winners really nice for like 120. Then lost a few 3 50
dollar trades a pop so barely positive for today if any. PnL is I believe 90.
Not bad, but worst day paper trading last week.
Hopefully tomorrow will be better.
I will attempt to trade later on today if I see anything pop up before going to
school.
O yea... got chopped real bad trying to play the symmetrical triangle. I didn't
show all my trendlines on the picture because I needed to reboot in the middle
of the trading session. Next one will be better.
Post some charts so we can some where some of the trades went wrong and try
to figure out why. Some good trending today thanks to fear
![]()
![]() .
.
~Cx
Anek or anyone, who is trading YM with AHG what volume charts are working
fine.
Which would give similar pace as the NQ 1000 or 1500?
Thanks
DisciplineTrader
Quote from disciplinetrade:
Anek or anyone, who is trading YM with AHG what volume charts are working fine.
Which would give similar pace as the NQ 1000 or 1500?
Thanks
DisciplineTrader
I guesse I'm glad I'm not the only one finding the day a bit difficult. I did well this morning on the way down and then gave it all back and then some in the chop. Bad day for me -670.00. But it aint over till it's over
As requested, my papertrades for today.
9 trades, 1 winner as noted on the chart.
All comments are welcome (sorry for the big chart).
http://images.sierrachart.com/uploa...UploadImage.png
Make it -790.00![]()
Hi,
Net Gain +$148 on NQ, traded ok but could have rode a couple for more
gains....tomorrow is another day ![]()
Made out ok on some AAPL trades as well
![]()
Cheers ![]()
-$500 here.
Took a few trades on ER2. Just experimenting..
Total PnL for day... + ~350
EDIT: Caught EOD rally. Up to 500 for the day. Out to school.
Broke lots of rules, but still did really well today. Need to stay away from
breakouts and only play high reward/low risk plays.
Quote from Razor:
Hi,
Net Gain +$148 on NQ, traded ok but could have rode a couple for more gains....tomorrow is another day
Made out ok on some AAPL trades as well
Cheers
I don't want to get too confident, I know I should not because whenever I do
the market humbles me silly.
....but God, Im toying with the NQ ![]()
Remember the mid line indicator project, check the resistant points today.
What a sweet sweet downtrend.
Anek
2175 was the 50% fibs
2167 was the 61.80%
Price tried to reverse hard in those areas but couldnt take the mid point
between lod and the daily mid point.
Coincidence ? ![]()
Anek
Quote from bmwhendrix:
-$500 here.
Quote from Anekdoten:
I don't want to get too confident, I know I should not because whenever I do the market humbles me silly.
....but God, Im toying with the NQ
Remember the mid line indicator project, check the resistant points today.
What a sweet sweet downtrend.
Anek
Midline indicator code is on page 432 of the journal if anyone wants it. If anyone has any ideas for enhancement or strategy post it and I will try to code it.
__________________
js
I tried to fairly analyze the NQ today.
If I traded like this in realtime with a disciplinary stop at most recent swing
H/L, I would have cleaned up. But instead my eyes and mind seems too be lacking
in discipline on many fronts. I guess it is all part of the education.
Chart is analyzed. These weren't actual trades.
Gotta get robot skills!![]()
-Tech
Tech,
Once you get past the basics and know what should be done the only thing left to
clean house is the complete dominance and understanding of your psychology.
Anek
Here is why 2175 and 2167 were significant in the NQ today.
Anek
A. NQ. Poor performance largely due to trading at work, exiting trades during
disruptions. ![]() I may just have to go
to a longer timeframe.
I may just have to go
to a longer timeframe.![]()
Quote from Anekdoten:
Tech,
Once you get past the basics and know what should be done the only thing left to clean house is the complete dominance and understanding of your psychology.
Anek
Quote from bmwhendrix:
A. NQ. Poor performance largely due to trading at work, exiting trades during disruptions.I may just have to go to a longer timeframe.
Quote from jashanno:
Midline indicator code is on page 432 of the journal if anyone wants it. If anyone has any ideas for enhancement or strategy post it and I will try to code it.
Quote from Trader273:
I'm just curious what indicator that is. Looks like Donchian channels to me.
Best days, best setups
Here is an idea that might or might not help.
Today the market had a clear sense of direction as opposed to days where it has
no idea where it wants to go.
Same thing happened last Thursday and Friday. These days are fairly easy to
trade, when you can't tell for sure what's the predominant trend, just stay on
the sidelines until your skill level increases with time.
Like it has been said in the past, sometimes the best trade is no trade.
Remember, you don't have to trade every day to have a great month.
Patience is a valuable asset in trading not only to wait for the best setups but
for the best days.
Anek
NQ today. Fear still invoking volatility hence trendyness and $$$.
~Cx
Cx,
Don't let the mini swings inside the big swings misguide you.
Let me know if this made sense.
Anek
Quote from rverheyen:
As requested, my papertrades for today.
9 trades, 1 winner as noted on the chart.
All comments are welcome (sorry for the big chart).
http://images.sierrachart.com/uploa...UploadImage.png
Averaging up
Anek,
I hope this is not too much of a pain:
I swingtrade, in a somewhat similar fashion to what you do scalping...am
interested in precisely how you scale up your position if it goes your way...
could you direct me to the part in your thread where you discuss your method,
criteria etc (if you did, that is)?
Thanks!
__________________
Vienna
Vienna,
Scale up on subsequent confirmations but only when you were blessed enough to
catch the birth of a new major trend.
For instance:
If long and next resistance became support, that's an extra confirmation.
If riding a trend, bounces off the major trendline.
etc...
Hope it helps.
Anek
Quote from Anekdoten:
Cx,
Don't let the mini swings inside the big swings misguide you.
Let me know if this made sense.
Anek
Vienna,
Sample for ES.
Anek
Quote from Cxinvest:
Yeah I know exactly what you mean. What you are speaking of is an art though. Deciphering that they are merely mini swings in real time instead of major is a whole other story then in hindsight. With your experience, how do you filter mini from major as they occur?? Thanks for the input as always.
~Cx
Quote from Anekdoten:
Cx,
Absolutely.
Here are a few things you could do.
Time frequency.
Volume frequency.
Price frequency.
...and of course, the big picture.
Anek
Trophy for anyone averaging down with AHG
![]()
You can tell when the stouts are kicking in right ?
Anek
All,
My hats off to Anek for starting this thread and many others for their great
contributions. I'm seriously struggling to achieve a modicum of consistency in
profits.
I'm religious about cutting losses quickly which is probably why I'm still
alive.
I've gone through the entire thread and think I get it; this strategy is about
straightforward as it gets; but I'm just not able to make money.
I think I'm l doing something fundamentally wrong; I always seem to get on the
wrong side of the market (like today). Surely it can't be difficult to make even
1 lousy ES point on a day like today! Well I lost 3 and quit in frustration
(fear of more losses)
Anyone have any words of wisdom?
thotspeed
Scaling In
Many thanks Anek.
-How often do you keep adding?
- same size as original unit or decrease?
I heard one good rule, which is don't add unless the stop of the last position
would be above (for a long) the entry price of the one before (assuming you have
moved the stop up so that the stop of your whole position is also the stop of
your last entry)...
It seems that this method reduces your reliability somewhat but makes a killing
when you get into a big move...
__________________
Vienna
Thot,
Some easy samples today.
Anek
Re: Scaling In
Vienna,
Averaging up is not for everyone, I tell you that much.
It decreases your accuracy but when you are right you make a killing.
It also allows to you use leverage with discipline and cut ALL your losses
short.
I keep adding as long as the trend keeps going like the Energizer Bunny.
Anek
Try analyzing today's chart like did.
It showed me the contrast between what I see after the fact and in realtime.
-Tech
Quote from thotspeed:
All,
My hats off to Anek for starting this thread and many others for their great contributions. I'm seriously struggling to achieve a modicum of consistency in profits.
I'm religious about cutting losses quickly which is probably why I'm still alive.
I've gone through the entire thread and think I get it; this strategy is about straightforward as it gets; but I'm just not able to make money.
I think I'm l doing something fundamentally wrong; I always seem to get on the wrong side of the market (like today). Surely it can't be difficult to make even 1 lousy ES point on a day like today! Well I lost 3 and quit in frustration (fear of more losses)
Anyone have any words of wisdom?
thotspeed
Re: Re: Scaling In
Quote from Anekdoten:
Vienna,
Averaging up is not for everyone, I tell you that much.
It decreases your accuracy but when you are right you make a killing.
It also allows you use leverage with discipline.
I keep adding as long as the trend keeps going like the Energizer Bunny.
Anek
__________________
Vienna
Re: Re: Re: Scaling In
Vienna,
Ya every add should be a trend confirmation that also happens to be a
retracement.
Anek
Quote from Anekdoten:
Here is why 2175 and 2167 were significant in the NQ today.
Anek
My chart didn't attach. These are the fibs using snapmode in tradestation.
Jaxon,
So that's what that little bottom does lol
Thanks ![]()
Anek
Market-E-Motion Indicator Update
Changes: Noticed that my high of the day color and low of the day color were
reversed.
Additions: If the high is above the high of the previous day then we get a
yellow line.
if the low of the day is below the low of the previous day then we get a purple
line.
Lets keep the suggestions coming!!!
__________________
js
Here is a sample of what the indicator looks like
__________________
js
Jashanno,
Looks good.
If you change any of the variables to inputs then the user can choose the color
or style at will.
For instance:
Input : HodColor(DefaultValue);
Anek
Can I make a suggestion to anyone struggling to time their entries. When you see a weak candlestick, go into a lower time frame and see if a wedge or trend line or something similar is being broken. Enter appropriately... this will offer good r/w and a better entry if you are good at it.
Kid,
Good suggestion.
Also remember that a strong bar or a weak bar is nothing more than an
"engulfing" signal.
The more it engulfs the more significant it is. Obviously engulfing a 3 tick
doji is not a big deal, and so forth.
Anek
I shoot for entry prices right around one of the fib levels, but sometimes when the market starts to move it moves fast and while I'm waiting around for it to come back to the fib level I end up missing the move. Is it better to miss a move and hope you can hop back on later or get a not so great price and end up with a wider than normal stop? Any guidelines you guys use for this?
Quote from bluedemon77:
I shoot for entry prices right around one of the fib levels, but sometimes when the market starts to move it moves fast and while I'm waiting around for it to come back to the fib level I end up missing the move. Is it better to miss a move and hope you can hop back on later or get a not so great price and end up with a wider than normal stop? Any guidelines you guys use for this?
Hi,
I see a lot of stuff on here with code etc that produces support / resistance
lines, fibs, whatever......IMHO I suggest taking everything off your chart for a
week or two except price and price only (candle stick or bar) and see how that
works out for you. I am not saying don't manually draw in a trendline or
horizontal line where you see support or resistance or draw in a rough 50%
retrace line but IMHO having something auto print a dot, line, special colour
bar etc etc is just something that is going to cloud your judgement.....start
with a pure price chart and manually draw in what ya need to as the session
progresses and you 'see / feel' where lines should be drawn in.....I am no
expert that is for sure but I have been at this a long time and one thing is for
certain, anytime I have anything printed on my chart auto besides price it turns
into another reason to question, 2nd guess, doubt, ponder and plain old cock
up....LOL
Just try it, you may be surprised.
Cheers ![]()
PS: I will look at the daily pivot points which are drawn in auto on occasion
but that is a secondary chart and I never use that to actually enter or exit a
trade, just something I may look at to get my bearings once or twice a day.
Probably so insignificant I should not have even mentioned it......not to
mention that when I do take them pivot points into consideration they usually
cock me up.....hmmmm, perhaps I will stop looking at them immeadiately, yup
sounds like a plan ![]()
Razor,
I have absolutely no problem watching price and nothing but price.
However, I will respectfully point out that you do not know the power of "50%"
or the "meet me half way" point in relation to any two points.
50% is the best kept secret in trading
Anek
Quote from Anekdoten:
Razor,
I have absolutely no problem watching price and nothing but price.
However, I will respectfully point out that you do not know the power of "50%" or the "meet me half way" point in relation to any two points.
50% is the best kept secret in trading
Anek
Howdy my teacher Anek ![]()
I agree the 50% is powerful which is why I suggested drawing in your own 50%
area after 'seeing / feeling' like hey, that last move was big enough, fast
enough, important enough, whatever to justify manually drawing in the 50%
retrace.....my concern is that some traders will just have these programs
drawing in 50% lines all over the shop along with other squigilly lines, dots,
etc etc and not really get the feel for what they are trading off of, it takes
two seconds to draw in a 50% retrace line after one 'sees / feels' that the
prior move justifies some attention on a retrace.....again JMHO and I am not
trying to over step my bounds here as I know I have a
loooooooooooooooooonnnnnnnnnnnnn
gggggggggggggggg way to go but just thought perhaps trying the price thing could
help some traders that are in a state of confusion with all the hoopla on their
charts..... ![]()
Cheers ![]()
I made this chart for Razor.
Anek
PS: BTW, keep the good work up.
Razor,
I also hear what you are saying and you are right. Perhaps it's wiser for the
newcomers to start with price alone and then add at their own pace.
Maybe it's time for AHG v2.0! ![]()
Anek
Quote from Razor:
Howdy my teacher Anek
I agree the 50% is powerful which is why I suggested drawing in your own 50% area after 'seeing / feeling' like hey, that last move was big enough, fast enough, important enough, whatever to justify manually drawing in the 50% retrace.....my concern is that some traders will just have these programs drawing in 50% lines all over the shop along with other squigilly lines, dots, etc etc and not really get the feel for what they are trading off of, it takes two seconds to draw in a 50% retrace line after one 'sees / feels' that the prior move justifies some attention on a retrace.....again JMHO and I am not trying to over step my bounds here as I know I have a loooooooooooooooooonnnnnnnnnnnnn
gggggggggggggggg way to go but just thought perhaps trying the price thing could help some traders that are in a state of confusion with all the hoopla on their charts.....
Cheers
Cheers ![]()
Believe me I am always watching for the 50% area retrace; however, like I said I
think drawing it in manually after watching the move is good for those learning
price action....JMHO ofc ![]()
Cheers ![]()
Quote from Anekdoten:
I made this chart for Razor.
Anek
PS: BTW, keep the good work up.
You got it buddy ![]()
Quote from Cxinvest:
I hear ya Raz, I love my naked charts too
~Cx
Anek & tech,
Thanks for the chart and suggestion. Everything always looks clear to me after
the fact--i.e. duh, how could I miss that!
But I don't seem to see it happening in real time.
thot
Could not resist posting the AH uptick move
![]()
Good night all.
Anek
Quote from Anekdoten:
Could not resist posting the AH uptick move
Good night all.
Anek
Quote from Cxinvest:
Lol. How's about you send me a Stout in the mail everytime price hits one of those levels eh? Sounds like a plan to me!
~Cx
Anyone interested in using the ET Chatroom feature? We could create an AHG room to discuss market in realtime instead of (or in addition to) coming here after the bell.
Hey,
My concern is that myself and others trying to learn this game will let other
peoples ideas, charts, expectations etc influence their personal view of the
chart / price action etc......
......it could be a good thing and bad thing, so not sure.....hmmmmm
Sorry for the indecision...
Cheers ![]()
Quote from Jaxon:
Anyone interested in using the ET Chatroom feature? We could create an AHG room to discuss market in realtime instead of (or in addition to) coming here after the bell.
Wow, that was pretty cool Anek. BTW, I created the indicator for those using
NinjaTrader. So far it matches the chart you posted
I also agree with Razor regarding the real time chatroom.
thanks all
J,
Thanks for creating it for the Ninja users, heard great things about the
software platform too.
At this point I feel I have mastered how to read price action correctly and when
I'm mistaken due to a fake or sudden change of heart in the market place I take
my quick stop and move on to the next trade.
Taking that quick stop is extremely important in the overall success of a trader
and why shouldn't you, as you are bound to make many bad trades for the rest of
your trading career.
Anyway, the point of all these babbling is that I have moved past price action
studies (comes natural now) and been working hard on researching the actual
target predictions, obviously in the direction of price action.
I said at the beginning of this journal that I felt the hardest and last area to
master in trading was the exit and well, that's what I've been working on
lately, quite extensively I might add. These levels can usually be even stonger
magnets than actual support and resistance, crazy.
Slowly making some real solid progress in all of this. Sometimes it's actually
quite scary and that's when I say, ok it's time for one more Stout.
Glad to hear there is a Ninja coder among us.
See ya guys tomorrow.
Anek
BTW NT traders,
I made the new highs and low lines transparent because I feel I don't need it.
Just want to keep my charts clean and simple with only 3 mid lines. Looking back
a few days, I can see how important these levels are.
I trade primarily YM using 1000V as my trend guide and 333 V for entries. (Read
about Proflogic and his volume charts, but made it alot simpler, going through
all the 7-9 squares makes my brain hurt, lol)
\
Quote from jashanno:
Here is a sample of what the indicator looks like
Quote from Anekdoten:
Best days, best setups
Here is an idea that might or might not help.
Today the market had a clear sense of direction as opposed to days where it has no idea where it wants to go.
Same thing happened last Thursday and Friday. These days are fairly easy to trade, when you can't tell for sure what's the predominant trend, just stay on the sidelines until your skill level increases with time.
Like it has been said in the past, sometimes the best trade is no trade.
Remember, you don't have to trade every day to have a great month.
Patience is a valuable asset in trading not only to wait for the best setups but for the best days.
Anek
...just wanted to offer a few thoughts on this idea of pure charts, ect.
Please keep in mind, it is not my intent to provoke or offend anyone here...
Last week we talked about the frustration of trying to trade a trend following
system during trendless chop. I pointed out that discerning chop in real time is
often a pretty tough nut to crack. Today we are seeing a lot of talk about the
frustration of using an intra-day trend following system on a nice strong trend
day and not profiting from the trend.
It is my thought here that it can help the learning process for those new to the
study of price action to have visual que's on the chart as a point of reference
as price structure develops during the trading session. For example, the little
HH, LL notations on the chart that Anek first introduced back at the beginning
of the Journal. Nice simple, objective and consistent notations that any skill
level of trader with a little discipline of method can follow along with in
real-time. Anek's new technique of these dynamic 50% retracement lines provide a
similar consistent visual reminder of the trend direction, or lack thereof.
For example, looking at Anek's NQ chart from this morning as price was riding
the red line down, the bright red bars pushing that red line lower, and where
the shallow bounces were not able to get above the first line of resistance,
above the 25% level, it was reasonably safe to conclude in real-time the overall
flow of trading this morning was moving in one direction. The first meaningful
pause in the trend, the bear flag that formed during lunch, tried 3 times and
was also unable to break through Anek's first line of resistance. Honestly, this
is really typical price action on a trend day.
Another suggestion for those starting out is to be consistent in your approach.
If these visual que's of price action help the learning process, then you should
pick one and use it. The goal here is to be saying "well yeah thats a down
trend", but you eventually want to get to the right edge of the screen, so your
saying it while its happening, not at the end of the day looking back. Trading
is largely a process of gaining experience with the typical price action we see
most day's. Using a consistent approach or perspective (these visual que's)
helps, because you start recognizing the same things setup day after day.
Anek has quietly mentioned this point, but I sense it's not being recognized
with the importance it deserves so I want to emphasize it here once again... If
you don't understand clearly what is happening, the best thing to do is stay out
until things become very clear. For those getting started with AHG, begin by
looking for the really obvious trades, the no brainer's (which this morning
was). This takes patience, to sit quietly and wait, but patience is an essential
skill in trading.
Anyways, in reading the comments and studying the charts being posted, I can't
help but wonder if some folks are struggling with selling fresh lows.... selling
the close of that first bright red bar as price breaks for the red line ? I
honestly suspect this may be one source of some of today's frustrations.
Unfortunately, visual que's on the chart will probably not resolve this issue.
Thanks Anek for the "Marketemotion" idea. These 50% and 25% mid lines seem to
act as powerful guideline reference levels.
Thanks Jashanno for coding it for Tradestation.
Also thanks JtraderK8 for Ninja coding and making the colors as user input. I
just loaded it in Ninja.
I appreciate it.
Thanks
DisciplineTrader
TrendPro,
Excellent commentary.
Anek
Still a little confused on the basics
What do you look for if there is a steady uptrend, and then a reaction takes
out a swing low?
Do you still look to buy the next strong up bar, or do you wait and see if
congestion or a downtrend is beginning?
It seems like breaking a swing low is a weak move, but technically you would
still be in an uptrend since that is just 1 lower low.
Mac,
Examine trendlines, fib levels and volume.
Ok time for bed otherwise I won't be able to play the morning, one that should
be fun.
Anek
Quote from rverheyen:
As requested, my papertrades for today.
9 trades, 1 winner as noted on the chart.
All comments are welcome (sorry for the big chart).
http://images.sierrachart.com/uploa...UploadImage.png
Quote from Anekdoten:
R,
Where did you get those penis looking arrows from ?
Anek
Here's the "Marketemotion" indicator in Ensign
![]()
You can change the colors to whatever you like but I like these.
opm8
Any guidance how I can put fib lines in QT?I have tried but cant find. Thanks
QT probably supports paint bars but I donot know how to use them . Some help
there also much appreciated.
__________________
A Candle Loses Nothing By Lighting Another Candle
Here's the "Marketemotion" indicator in Ensign
You can change the colors to whatever you like but I like these.
opm8
Jashanno,
Thank you for the download. I used it with tradestation and it came up under my charts. Did I do something wrong? How do I get it on my charts like shown in some of the example? Thank you in advance.
__________________
js
Quote from TrendPro:
I can't help but wonder if some folks are struggling with selling fresh lows.... selling the close of that first bright red bar as price breaks for the red line ? I honestly suspect this may be one source of some of today's frustrations. Unfortunately, visual que's on the chart will probably not resolve this issue.

Hello
25%, 50% & 75% lines for Amibroker.
Thanks
nt
Thanks for that Tradestation indicator. I changed the mid lines from halfway
between high and mid to .382 and .618.
However, I am having a problem with the indicator in that it messes up the price
axis on the right side of my chart. Anyone else see a problem here? Look
carefully at your charts with the indicator. I will post a pic later.
jaxon, refer to my last post.... i think this should fix what you are talking about. If not let me know and I will look at it tonight.
__________________
js
Thanks for the commentary TrendPro...its what I need to focus on in order to put it all together.
Anyone know the TRO name for the HHLL function for eSignal? Thanks
Quote from jimmyz:
Thanks for the commentary TrendPro...its what I need to focus on in order to put it all together.
Cprofit,
YOu can just drag and drop the indicator on the bottom subgraph to the top price
data chart in TS.
Quote from swingnifty:
Lots of times keep waiting for additional conformation and by the time I get doublly sure the SL point looks far away, gives vertigo
Hope lots of screen time, will cure it gradually.
sn
Quote from opm8:
Here's the "Marketemotion" indicator in Ensign
You can change the colors to whatever you like but I like these.
opm8
__________________
JDConner
Quote from osho67:
Any guidance how I can put fib lines in QT?I have tried but cant find. Thanks
QT probably supports paint bars but I donot know how to use them . Some help there also much appreciated.
Quote from gohstrader:
all you have to do in QT is draw a normal trend line from your points that you want to use for Fibs.
Next-Right Click directly on the trendline and choose "Set Fibonnaci re-tracements. You can also choose to extend them.
Lastly--If you only want certain Fib levels to show on your charts then go to Options then Edit Preferences then Charts then Fibonnacci and check off the levels you want.
Hope this helps
-GT
__________________
A Candle Loses Nothing By Lighting Another Candle
hi QT user there,
hi QT user there,
need some help..i want to learn and automate my trading using IB and QT. can you
please point me to some links to read some stuff on various ways i can
program..it would be get if i can get hands on some examples also...i am new to
this but not new to programming as thats my bread and butter...
Quote from gohstrader:
all you have to do in QT is draw a normal trend line from your points that you want to use for Fibs.
Next-Right Click directly on the trendline and choose "Set Fibonnaci re-tracements. You can also choose to extend them.
Lastly--If you only want certain Fib levels to show on your charts then go to Options then Edit Preferences then Charts then Fibonnacci and check off the levels you want.
Hope this helps
-GT
__________________
Lets all drink to the death of a clown.
Absolutetly horrible performance by me today. Ended up just negative with commissions. Way overtrading. I knew I shouldnt have traded today because of other stuff on my mind... o well.
Quote from kidPWRtrader:
Absolutetly horrible performance by me today. Ended up just negative with commissions. Way overtrading. I knew I shouldnt have traded today because of other stuff on my mind... o well.
Quote from kidPWRtrader:
Absolutetly horrible performance by me today. Ended up just negative with commissions. Way overtrading. I knew I shouldnt have traded today because of other stuff on my mind... o well.
Afternoon was nasty. I think being "slightly negative" for the day is a good
thing.
~Cx
Been holding a long trade more than 8 hours today, when it failed to make a
break and retraced bought some puts to hedge. Looking for a bounce and a strong
breakout to all time highs ![]()
__________________
"TRADE WHAT YOU SEE" - Master Osorico
Nasty choppy day.
That's what the anchor chart is for, at least in NQ, check how it is trapped
inside a big symmetric triangle, unless those ends are broken it's going to jump
up and down silly.
When NQ was flirting with the lows in the afternoon with no real follow through
I got confirmation that it was not the right day to break the trendline holding
the bottom of the triangle so I bought it aggressively and made up for the two
minor losses I had in the morning and managed to close the play with a very nice
gain. Once again, why an anchor chart is helpful. Must always be in touch with
the big picture. This market is not yet ready to decide. Perhaps tomorrow with
all the plethora of economic data plus earnings it finally does. Speaking of
earnings, nice to see INTC beat by a penny, no real fan but friend works there
so thought I would cheer for him since he's got investments in it
![]()
Was a light trading day for me, four trades total due to the more than obvious
chop.
Two minor losses
One break even
One homerun fading the lows as explained above.
Tomorrow should be more decisive.
Then at the eod I decided to buy NQ at the low of the triangle as a swing
because of the risk vs reward i saw.
....and kaboom +20 instant points, can't complain with that. Definitely, stout
time.
Anek
Hi,
Net Loss -$265, ok here it is, was down by more than $500 before 1030am est
doing some really undisciplined, rookie crap....anyway, managed to ride the
trend back up and recover 1/2 the loss and wads done by 12pm est. Silly stuff
but I have not done anything this foolish for months so I will just write it off
as a one off......back at it tomorrow.
No equity trades today.
Cheers ![]()
Anek,
Can you please post when you took the symmetric triangle play near end of day
with a chart if possible.
Thanks
DisiplineTrader
D,
Sure and I'll post the live commentary.
15:53 * Anek buys NQ 71.25 (crazy swing long)
15:54 Anek Playing the bounce on the multi day triangle
15:55 Anek Basically if Im wrong, small loss, if Im on the right side could be a
potentially monstrous play
16:45 * Anek sells NQ 92.00 from 71.25 for +20.75 half position out stop to BE +
5.00
Stout time my friend.
Anek
I was out today.... could someone give me a brief market summary?
![]()
![]()
![]() or point me to something....
or point me to something....
![]()
![]() I see dow and s&p down on the
day, nasdaq up on the day, and everything up sharply after the bell.... screwy,
huh?
I see dow and s&p down on the
day, nasdaq up on the day, and everything up sharply after the bell.... screwy,
huh?
edit.... ok, I see everything, including nasdaq, was down at 4pm but everything
up after the bell...
Thanks Anek for the chart and the log. I appreciate it.
Is this log from a chatroom thats available for AHG 'ers.
Thanks
DisciplineTrader
Quote from disciplinetrade:
Thanks Anek for the chart and the log. I appreciate it.
Is this log from a chatroom thats available for AHG 'ers.
Thanks
DisciplineTrader
Thanks for the support guys. I am always really harsh on myself, though. I
feel that I should have broke positive but it was my discipline that forced me
into crappy trades.
Anek... this ones for you.
Today I had some good trades somewhere in the middle of the day I was up around
200. Then I proceeded to keep getting trapped into what I thought were new
trades both short and long and I would get stopped out for small losses in each
case.
I have been working off of 333 vol charts for the nq and i enter on a
channel/trendline break as well as an engulfing candle. This gets me some
entries into some really strong trends where you have v tops and bottoms (ie,
the ping ponging back and forth in the triangle).
I just didn't have the skill I think to trade this way and make the turns as
fast as I needed to.
Is there any reason to go for 3-5 point scalps on my timeline? I feel I could if
I just practiced more on days like today.
If I could trade today, I definitely could do any other day.
I will mark up what I should have done later today and then post what I did as
well.
I have a feeling that if I referred back to my anchor char more often and only
took the v tops and bottoms at major support/resistance the r/w would have been
better and today might have actually payed out well...
Thanks.
Quote from Anekdoten:
Was a light trading day for me, four trades total due to the more than obvious chop.
jashanno, thanks, I made those small changes and Market-E-Motion looks great
now! ![]()
Quote from Jaxon:
Unless they went ahead and started the chatroom without me, my guess is that dialog took place in Anek's head.
Quote from Anekdoten:
D,
Sure and I'll post the live commentary.
15:53 * Anek buys NQ 71.25 (crazy swing long)
15:54 Anek Playing the bounce on the multi day triangle
15:55 Anek Basically if Im wrong, small loss, if Im on the right side could be a potentially monstrous play
16:45 * Anek sells NQ 92.00 from 71.25 for +20.75 half position out stop to BE + 5.00
Stout time my friend.
Anek
__________________
"TRADE WHAT YOU SEE" - Master Osorico
Kid,
For patterns and good risk vs reward plays you need volatility today was a very
dull day, albeit very much expected.
We had three trending days in a row, that's the exception not the rule.
As soon as you see swings lasting minor points and trend changing back and forth
like some bisexual without a clue, then you know it's time to sit on your hands.
Anek
J,
Woa is that chart like that or are the stouts making it look psychodelic!
![]()
Good call bud, I saw that one coming around noon today but wanted see the LOD
hold first, and hold it did.
Anek
Nah. it's me being arty farty ![]()
__________________
"TRADE WHAT YOU SEE" - Master Osorico
Blue,
Read a post above where I describe how to call the chop. One reminder, I had
some minor losses today, sometime it's inevitable and you can tell only after
it's happening.
Here are a few tips:
- On the big charts, is price trapped and congested?
- Any triangles around ?
- Any rectangles ?
- Is the market clear on the current direction ?
- The daily range is it tight ? as in narrow ranged day.
- Was the previous day range a wide one ?
- Are immediate trends changing every 30 min ?
- Are all the Market E-motions lines crossed like if it's no mans land ? good
example today was NQ
Hope it helps.
Anek
Quote from Anekdoten:
Kid,
For patterns and good risk vs reward plays you need volatility today was a very dull day, albeit very much expected.
We had three trending days in a row, that's the exception not the rule.
As soon as you see swings lasting minor points and trend changing back and forth like some bisexual without a clue, then you know it's time to sit on your hands.
Anek
Quote from kidPWRtrader:
But... there is a way to trade them as after all it is a trend, just on a smaller time frame.
Is this smaller time frame just not worth the points per click for you?
Ok... you knew this was coming haha. Care to expand on the last comment?
Ultra scalping ?
I only do that via automation., think its beyond the scope of this journal.
Anek
Gotcha. Just wondering. That's not really what I should be focusing on right
now anyways and probably the same for most people in the journal.
As always, thanks for encouraging (and not punishing) curiosity.
Quote from TrendPro:
...those bright red bars are a pretty strong signal in and of themselves.
its a bit of a catch-22 situation when you stop and think about it... there are two basic ways to enter during a strong trend...
1. once the weak bar signals start triggering, indicating the direction is down and you want to get short... you don't want to chase price so you wait for a bounce to get in, this alleviates the vertigo mindset of selling the low. The dilemma here is when the bounce forms you have no idea if another weak bar will come along after you enter, that is you have no firm confirmation the downtrend is resuming. So in this case you enter on the bounce without confirmation and hope the downtrend resumes.
2. same scenario as 1 but now you wait for that confirming weak bar to enter on, which puts you into this vertigo mindset because by definition the weak (bright red) bar is closing at a new low. The risk here being you just sold the low and the market quickly bounces or reverses right back into your face. So you have the confirmation but also an increased perceived risk of selling a new low.
Either way, to play in a strong trend you must pick a poison.
Most traders never participate in the strong trend moves because they are the hardest to step into, to step up to the plate and swing at that 95 mph fastball.
So in this case, its not so much a matter of screen time, and really more a matter of getting comfortable with the inherent risk of this style of trading.
Anek's suggestion of a lot of time, months, on the trading simulator makes a lot of sense. So simulator time, getting really comfortable with the pace of trading in a strong trend. This is where the feel of price action comes to life.
Best of luck in your trading
Quote from kidPWRtrader:
Ok... you knew this was coming haha.
You waited for confirmation as always?
![]()
By the way... since i've read your thread and started trading futures (sim) I
havn't had a down day in 2 weeks (the first week I was really off by myself but
the second week I got a lot of confidence from the journal to be able to execute
the plan). Today was my first loss...
I should probably preface this by saying that I have been swing trading equities
for about a year before this and was following a similar style. However, I have
always thought that my time frame did not suit my psychology and this is only
reaffirming this.
So its not overnight success, but the culmination of bits and pieces that i've
picked up along the way that were useful.
Your journal has had the greatest impact on my trading in the time span that it
took me to absorb the contents out of anything i've done throughout the year.
Quote from Anekdoten:
Blue,
Read a post above where I describe how to call the chop. One reminder, I had some minor losses today, sometime it's inevitable and you can tell only after it's happening.
Here are a few tips:
- On the big charts, is price trapped and congested?
- Any triangles around ?
- Any rectangles ?
- Is the market clear on the current direction ?
- The daily range is it tight ? as in narrow ranged day.
- Was the previous day range a wide one ?
- Are immediate trends changing every 30 min ?
- Are all the Market E-motions lines crossed like if it's no mans land ? good example today was NQ
Hope it helps.
Anek
Just a comment for my friends who have only dome sim trading. Funny how when
you go from sim to real money, the levels of emotion generated by fear, greed
and the fight or flight instinct become so exagerated. It's when I'm in such a
weakened state that the lizard brain takes over. I'm sometimes surprised at what
it has done when I review the day's trades. Today was back on track after a
Lizard day yesterday. ![]() (Lizards
want that fly right now!)
(Lizards
want that fly right now!)
Please take a moment of your time to examine this chart.
Slice and dice it anyway you like. Some might know what it is some might be
surprised.
If possible post your comments on the journal.
Thank you.
Anek
Looks like 1929 or 1987 or........next week
![]()
It's an exercise to see who's really on top of the game and who's scratching
balls ![]()
Anek
its the NQ weekly chart the 2 lines
are
2371.25
1996.25
this is the NQ futures of course
still trying to figure out what u are pointing out
Ya I would have guessed chart of the Naz
![]()
anek both lines represent a lower high of the down trend from
2000/2001 to 2003
are u saying that since we closed above the last lower high from 2001 we are on
our way up?
EDIT
or maybe the triangle being broken and next ressitance is at second line of
2371.25 so easy to get up there?
Bugs,
Once the market decides when it's ready to choose it's next direction, should or
when it's up these are my targets.
Reversal formation, swing high was developed.
In case there are any doubts, the Nasdaq is our leader in the market right now.
My personal targets
2300 - 2400 (possible aggressive pullback around this area) then 2500 - 2650+.
Forget the fundamentals, the news, the fears, the crappy stuff you read on ET,
CNBC, Bloomberg or that pay newsletter you love so much.
This is AHG on the weekly chart and the Nasdaq is looking more bullish than Ron
Jeremy on Viagra while on his prime.
Time the entry, start very slow, add on confirmation and never ever average
down.
If I don't reach most of my targets within a reasonable time I will close the
journal.
Anek
anek
would u be so kind to explain what reversal formation u are seeing ?
is it on the weekly chart ? can u please explain
is the swing high on the weekly as well
thxs in advance
Bugs,
Believe it or not, the reversal formation was the multi year low on the weekly
chart years ago.
Clear W formation whose mid swing was taken out by a closing bar at the absolute
lows.
Now a major swing high has been accomplished, we need resistance to become
support, this has yet to happen.
The near term signal will be a breakout to the upside outside the current
triangle on the multi day charts.
I started way early based on an inverse head and shoulder on the daily charts
(sadly not as early as that W shows) and have been adding ever since, kids
future if you will.
Anek
dang bugs! you figured that out quick.
![]() I was feeling very clever when
I switched the @NQ chart to weekly and, bingo... but you had already posted.
I was feeling very clever when
I switched the @NQ chart to weekly and, bingo... but you had already posted.
![]()
Jaxon,
Good job figuring it out on your own.
The point of the exercise is that we must be aware of the big picture in the
instrument we trade and that does not just mean the daily chart.
Yes, even as an intraday scalper.
Always refer to the weekly, daily and multi day charts when doing your homework.
Anek
What do you mean by a multi day chart? I've got daily, weekly and monthly
buttons.
That weekly chart does make it look like the NQ had a long way to go. 38.2% is
"only" 2689.50
BTW, here is an ultra scalper +>
http://www.brooklynvegan.com/img/music/scalper.jpg
Jaxon,
Thank you for all your kind words.
Anek,
If you are ever in the LA area, PM me and we are going to
Yummi!
And for the rest of you , a simple TS indicator which displayes timer countdown,
LOD,HOD , current and last bars HL & close.
enjoy
bugs
Hi Bugsbunny,
Thanks for the indicator.
Can you please attach a chart showing what this indicator plots and how you use
it, so that for those of us who are on Ninja can try to convert it to Ninja.
Thanks
DisciplineTrader
Jaxon,
Here is an example of what I refer to as a Multi Day Chart.
Notice the current wick high on that last bar which is why I decided to take
profits around that area.
It has "yet" to break out/down.
Interesting thing is that I think the key to the market (all e-minis) lies on
this chart right here.
The 2205 and 2160 areas are extremely important in the next development phase.
Learn to recognize the bearish hemisphere from the bullish one and what's the
line in the sand.
Remember, the Nasdaq is leading.
It is extremely important, always, at all times, be aware of the big picture,
without it, you would not know how far your good trades can go.
Good luck tomorrow, off to bed.
Anek
PS: Little divergence sample on the chart for the divergence fans. Don't ask,
I'm not one of them ![]()
Anek, thanks for the chart and explanation. I actually have a similar view using 25000 share bars.
Jaxon,
My pleasure.
Also notice how the width of a day gives you the daily volume perspective.
Looks like on 10/10 only Razor and I scalped it
![]()
Anek
Sure DT
here is the jpg, its very simple just makes it easier to know when the bars are
finishing , also you no longer need to click on the bar and figure out the H/L
etc...
Thanks Anek for the multiday charts, showing the NQ line on sand levels.
Also thanks Bugsbunny for the chart.
Thanks
DisiciplineTrader
Anyone use mb data feed with Ninja trader?
I cant seem to get past price data. I have to run the days in order to store the
data and I cant seem to find a way around this.
As such, I didn't even see that big triangle forming that anek posted because I
started out trading es and dont have enough price history with the NQ.
Hi kid,
i use mb with ninja and its the same story. i belive that mb is just a real time
data platform but since it has no charting , it does not save any data. the only
way i know how to save it is having NT connect to MB. if you find other
solutions please let me know
Anek,
Would you consider 2 consecutive candles as a valid DT/DB setup? Or would you
rather see some candles in between? Obviously, price action following the
possible DT/DB would confirm the setup.
Hope this is clear.
Low
NQ Update
Bull flag formed on the 2 day chart
The downside this morning was the pennant formation.
After the low test, an inverse head and shoulder formed, combined with the 2 day
chart bullish formation we retraced the downside all over again and took the
opportunity to take some more profits.
* Anek sells NQ (scales out) 2199 from 2171.50 for 27.50 trailing below uptrend
line.
Test of times still 2205
Still Looking for more upside.
Anek
Ugly move here during lunch, typical crap of upcoming OEX.
Might get stopped out soon.
Anek
nice trading. Would you mind telling us the time of day you entered?
thanks
J
J,
Look at my posts yesterday.
Anek
Anek,
Is that a double top playing out in NQ from around 2199.50, starting from
around11:46 EST? Missed it though.
Thanks
DisciplineTrader
Closed the swing on the ugly lunch move and cashing the balance for aprox
+20.00
Skipping the afternoon.
Skipping OEX.
Hope everyone has a good weekend.
Anek
What is OEX? Option expiration?
thanks
J
Yes,
OEX is options expiration. It is this Friday.
Anek(anyone),
Is a failed inverse head and shoulders a viable pattern?
Nice little HS fail move this morning on NQ. I didn't catch it, but I've seen
these before. Seems to me that they need attention.
-Tech
http://www.elitetrader.com/vb/showt...yed#post1620367
Quote from BoyBrutus:
http://www.elitetrader.com/vb/showt...yed#post1620367
Quote from BoyBrutus:
http://www.elitetrader.com/vb/showt...yed#post1620367
Wrong attachment last file (no downtrendlines).
Quote from Techdoodle:
Is this in response to my post?
If not, sorry for jumping to conclusions.
I meant a failed inverse head and shoulders breakout only to fail and reverse.
It's no longer a dragon in my book.
-Tech
Nice.
~Cx
Importance of Anchor Charts
NQ
On the multi day chart NQ 5000 share bars, 60ish support trendline was holding.
On the 1000 a W formation right on that area at the LOD.
W formation at major support? Was does that spell ?
Dual confirmation.
Targets using the Market E-motion line.
Someone with the tools can post the visuals as I'm off to get massively wasted,
then wash off the hangover to treat the family with a nice weekend.
Sometimes it is that simple and that easy.
Taking off until further notice, good trading all.
Anek
Nevermind just took a quick shot....
Anek
Quote from osho67:
Any guidance how I can put fib lines in QT?I have tried but cant find. Thanks
QT probably supports paint bars but I donot know how to use them . Some help there also much appreciated.
Hi ![]()
Net Gain +$108, traded ok, could have taken more plays but wanted to book a
profit on NQ's today after yesterdays performance.
Did very well trading AAPL ![]()
Cheers ![]()
The NQ just hit my second target at 2191 the following Market Emotion.
Sadly most of the positions were sold at 85 still it demonstrates the power of
such simple but intuitive tool.
Anek
Anek off.....!
PS, traded afternoon and got to -100 by clearing head and getting back to basics.
Dangit keep on screwing up attachments...
Last exit is on the red candlestick I think. Don't know why it didnt show up.
Anek.....80k......what in the world, awesome man, congrats !
Looks like from your odd P&L posts that you are pulling in over a million a
year.....one day I will be there, good stuff man, nice to see you help others as
well ![]()
Cheers ![]()
Quote from Anekdoten:
Importance of Anchor Charts
NQ
On the multi day chart NQ 5000 share bars, 60ish support trendline was holding.
On the 1000 a W formation right on that area at the LOD.
W formation at major support? Was does that spell ?
Dual confirmation.
Targets using the Market E-motion line.
Someone with the tools can post the visuals as I'm off to get massively wasted, then wash off the hangover to treat the family with a nice weekend.
Sometimes it is that simple and that easy.
Taking off until further notice, good trading all.
Anek
Anek, please please please explain this to us. I am a 3 lot piker that has
money in bank, but due to previous negative experience I am not trading size,
just 3 lots in FDAX, which does generate good gains, but seeing your PnL, well
Jeez man, I want some of that ![]()
I guess question is when, how & what made you decide to increase size. Please
post everything related. I am guessing you haven't always traded size.
Thank you, Thank you, Thank you!
N.B. Normally I type TY for thank you
![]()
P.S. I feel that I am ready from both experience & knowledge point to make a
switch (my equity curve has grown since I started scaling out), but
phychologically I am sort of afraid to increase size, fucking too concerned with
losing again.
__________________
"TRADE WHAT YOU SEE" - Master Osorico
Tech
You can not make a indicator plot on QT. Only choice would be to make a paintbar
to show the color of range. Or email support and request the indicator to be
added.
AAA30
JSSPMK,
It's all in the journal. Everything needed aside from discipline and screen time
is right here on this journal.
Small stops, letting the winners run, discipline, money management, screen time
up the ass, etc.
You start with baby steps. When you have solid evidence of consistency without a
shadow of a doubt you gradually increase car size and you keep this cycle
with full responsibility. No consistency no increase, in fact, decrease.
Once your accuracy starts turning for the better you implement averaging up
techniques and when you are blessed enough to catch the birth of a trend you
break the bank.
And last but definitely not least you never ever average down because it is not
about being right but about making money, responsibly, calmly, patiently and
with confidence.
Shutting systems down to live a bit.
Anek
Quote from AAA30:
Tech
You can not make a indicator plot on QT. Only choice would be to make a paintbar to show the color of range. Or email support and request the indicator to be added.
AAA30
Here is an example of what you could do in QT for a visual reference. Just picked random colors for the example.
These are the rules for the above.
if (((Bar Close- Day Low)/(Day High - Day Low)) > 0.75) and (((Bar Close- Day
Low)/(Day High - Day Low)) < 1) set color to $002400
if (((Bar Close- Day Low)/(Day High - Day Low)) > 0.5) and (((Bar Close- Day
Low)/(Day High - Day Low)) < 0.75) set color to $003737
if (((Bar Close- Day Low)/(Day High - Day Low)) > 0.25) and (((Bar Close- Day
Low)/(Day High - Day Low)) < 0.5) set color to $00254A
if ((Bar Close- Day Low)/(Day High - Day Low)) < 0.25 set color to Black
It will not show the values for targets, this would have to be done manually
with fib lines on your charts, but it will give you a quick reference on where
you are in relation to the days range.
AAA30
Quote from AAA30:
It will not show the values for targets, this would have to be done manually with fib lines on your charts, but it will give you a quick reference on where you are in relation to the days range.
AAA30 [/B]
AAA,
One more thing.
Today the Paintbars are showing complete inaccuracy in relation to previous
days. Sounds like a bug.
Also, lower Paintbars always show as really thin.
Is there a setting you know of to expand them to the height of the pane?
btw, I changed the script to show default fib levels.
See attached.
-Tech
Tech,
I have not tested this out in real time so you will have to watch it to see if
it is accurate. I appears that it calculates from the time you apply it so
historical values may not be correct.
To make the band larger select edit on the paint bar indicator and choose Show
on Full background.
AAA
Thanks AAA.
Ironically, historical is accurate. Except for today.
Thanks for your help.
-Tech
Quote from Anekdoten:
JSSPMK,
It's all in the journal. Everything needed aside from discipline and screen time is right here on this journal.
Small stops, letting the winners run, discipline, money management, screen time up the ass, etc.
You start with baby steps. When you have solid evidence of consistency without a shadow of a doubt you gradually increase car size and you keep this cycle with full responsibility. No consistency no increase, in fact, decrease.
Once your accuracy starts turning for the better you implement averaging up techniques and when you are blessed enough to catch the birth of a trend you break the bank.
And last but definitely not least you never ever average down because it is not about being right but about making money, responsibly, calmly, patiently and with confidence.
Shutting systems down to live a bit.
Anek
__________________
"TRADE WHAT YOU SEE" - Master Osorico
Conclusion of Phase I
You will find many pieces of the puzzle on this chart.
Please notice the following AHG key elements at work:
- The engulfing paintbars for entries and exits when riding meaningful trends
although plenty of examples are scattered in the journal in this area
- Unnecessary large stops, the option of re-entering
- Meaningful Patterns
- Pattern failures
- Reversal Pattern confirmation
- Trendlines at work to help you stay with the trend and knowing when it might
be over
- The magic "tick" confirmation after the breakout closing bar when a pattern
forms
- The powerful synergy between macro and micro charts, knowledge of key areas
- The complete elimination of lagging indicators
- Comparison of narrow range (yesterday) and wide (today), more volatility is
good for traders
- Market E-Motion lines for measuring strength of the trend and possible targets
plus areas of congestion, highly powerful stuff. A swiss army knife, learn this
tool well.
I feel Phase I of AHG is complete.
Feel free to discuss the tasks and methods at hand among you all. I will now
take a much needed rest and when the time is right for me, I will return for
Phase II.
If I'm forgetting something I'm sure it's somewhere in the journal.
Screen time and practice should be the priority now along with avoiding the root
of all evil, the chop.
Until the next time.
(to be continued)
Anek
Cheers matey ![]()
Go enjoy your much needed break from the madness of ET
![]()
Quote from Anekdoten:
Conclusion of Phase I
You will find many pieces of the puzzle on this chart.
Please notice the following AHG key elements at work:
- The engulfing paintbars for entries and exits when riding meaningful trends although plenty of examples are scattered in the journal in this area
- Unnecessary large stops, the option of re-entering
- Meaningful Patterns
- Pattern failures
- Reversal Pattern confirmation
- Trendlines at work to help you stay with the trend and knowing when it might be over
- The magic "tick" confirmation after the breakout closing bar when a pattern forms
- The powerful synergy between macro and micro charts, knowledge of key areas
- The complete elimination of lagging indicators
- Comparison of narrow range (yesterday) and wide (today), more volatility is good for traders
- Market E-Motion lines for measuring strength of the trend and possible targets plus areas of congestion, highly powerful stuff. A swiss army knife, learn this tool well.
I feel Phase I of AHG is complete.
Feel free to discuss the tasks and methods at hand among you all. I will now take a much needed rest and when the time is right for me, I will return for Phase II.
If I'm forgetting something I'm sure it's somewhere in the journal.
Screen time and practice should be the priority now along with avoiding the root of all evil, the chop.
Until the next time.
(to be continued)
Anek
Anek, thanks a million for your efforts.
Since I am a keen indicator user I would like to ask you this:
Why have you joined the cliche mob by calling indicators 'lagging' when I can
dig out better fills (using an indicator) than you using price action only. I
mean I know indicators are generally referred to as lagging, but come on man,
you hurt my feelings ![]()
__________________
"TRADE WHAT YOU SEE" - Master Osorico
Thanks Anek. Truly an informative and well presented thread.
You are a rare breed.
Trvl
Thanks Anek
You are a great Ajahn (buddhist word for a compassionate teacher).
I had given up and I thought I will never be able to trade futures. You have
given me a new hope.
I have got Suri book as well and I am studying and practicing paper trading. I
hope I will make some grade.
Thanks so much
__________________
A Candle Loses Nothing By Lighting Another Candle
AHG
What an amazing journal and an even more amazing person .
The lightbulb finally went on for me .
Eagerly awaiting AHG2
Thanks Anek.
__________________
Lets all drink to the death of a clown.
Thank You
Anek, I would like to add my thanks to those that you have already received.
Having only recently even considered daytrading, I'm mindbogglingly lucky to
have found your journal. I am truly grateful for what you are sharing.
AHG's methods are right up might my ally, and I am enjoying myself as I continue
to learn how to apply them correctly (still sim trading.)
I've been thinking about what you described as the powerful synergy between
macro and micro charts. Very interesting. One thing that this analysis will help
me do is determine when I should be averaging up vs. simply scalping
retracements.
For example, last night I saw your posts on the NQ multiday chart, where you
noted the importance of the last swing high/lows (2205/2160), so when the LOD W
formed at 2160 I was comfortable averaging up. If it had fallen below that level
I would have been shorting and averaging up because it would have been a double
top confirmation.
Tonight I see a similar possible opportunity. In charts that show the action of
the last 4-6 sessions, it seems the emini markets will open thursday at a
particularly bearish point. In the ES and the ER2, there's a trendline test of a
downswing, and in the NQ there's a possible bounce in a rectangle. I included a
screenshot.
NQ seems to have the most choice as to where to go next. The resistance in the
ES and ER2 looks stronger.
I wont do anything that price action doesn't confirm with bearish patterns/bars,
and most definitely am not averaging down.
Also, I am VERY interested in Phase II.
Thank you again for what you're sharing. Im still very new, so please anyone
tell me if what Im thinking is flawed.
Re: Thank You
Thanks herbert. Great charts.
I definetely know where my bias lies for tomorrow.
As always. I take and I give. A little something from me as everyone else has
contributed so much I still feel like a freerider.
Some things I have found helpful last few days... and in my analysis today as
well.
When buying breakouts keep a stop behind the trendline as the price rises/drops.
Do not wait for your initial stop to be hit... stay on your toes.
if you enter on a channel/trendline break and new channel/trend line forms do
not try to buy cheap if the new one is broken. This isn't buying cheap, this is
buying a reversal. If the new trendline is broken, sell early. At the very
least, its a loss of momentum and sideways action. Worst, a change of trend and
you take a bigger stop than you need to. You can always get back in.
In a pattern failure wait for definite signal of resumption of major trend in
place before pattern. As always, dont wait for your initial stop to get hit.
These types of reversals should carry through enough to where you should be in
profit right away; therefore, use trend lines.
Images attached show both examples.
Re: Re: Thank You
Last time trying to post image... (have given it several times I dont know
whats going on here... )
Will try to post again tomorrow...
To Anek:
Thanks for everything. Awaiting your return and the next journal. You have
signicantly impacted my trading and most likely my life.
I am only 19, so one day, you better believe it that I will return some favors
to those around me. In fact, I'm president of an investing club here at the univ
of arizona. Ironic, huh? Anyways... though I am sure very little people will
appreciate I already have given some talks about how I use price in equities and
who knows maybe ill use camtasia and show an actual trading session next
meeting. Most people don't believe trading is possible at all, but for some, it
changes lives. I have been lead in the right path here and there by several
people since starting icnluding yourself. I intend to do the same...
Re: Re: Re: Thank You
Sorry for flooding the thread.. keep getting more things to say/ask.
Random Question:
I am looking for a datafeed / brokeraging service that has decent commissions,
gets historical data, and doesn't take a lot to open.(not more than 5 grand
prefered) Can anyone give me some leads? Mb charges 5 roundtrip but no
historical data.
Also... do any services offer free time and sales and DOM. I don't get them with
my mb account. If not free, for how much?
Also... to people that pm'ed me about MBtrading and historical data. I havn't
found a great alternative. Opentick was suggested and that looked good for YM
but nothing else. Looks like we are stuck for now...
Try taking a look at
www.mirusfutures.com
You will need to use Ninjatrader but ticks all your other boxes
Re: Re: Re: Re: Thank You
Quote from kidPWRtrader:
Sorry for flooding the thread.. keep getting more things to say/ask.
Random Question:
I am looking for a datafeed / brokeraging service that has decent commissions, gets historical data, and doesn't take a lot to open.(not more than 5 grand prefered) Can anyone give me some leads? Mb charges 5 roundtrip but no historical data.
Also... do any services offer free time and sales and DOM. I don't get them with my mb account. If not free, for how much?
Also... to people that pm'ed me about MBtrading and historical data. I havn't found a great alternative. Opentick was suggested and that looked good for YM but nothing else. Looks like we are stuck for now...
__________________
"TRADE WHAT YOU SEE" - Master Osorico
Ninja E-Motion
For those using Ninja Trader here is the E-Motion indicator in source form
(.cs).
It includes configurable colors etc.
Sorry if someone already has done/posted this... but I didn't see it so created
my own.
Anek -- Thanks so much for this thread and for rising the tide for all of us!
KidPWR,
When I was your age, I was also looking for inexpensive alternatives to intraday
data and that ended up doing more damage than good. If you are planning on
making daytrading your main source of income and relying on price as your main
indicator, it is best to subscribe to reliable data providers like Esignal, TS,
or Mirus Futures(one I use). They are expensive but you sure don't want any data
glitches. It happened to me and it costs me alot of money.
However, if you are doing EOD analysis for US stocks, then I recommend YHOO
(Free) because the data comes from CSI and they are very reliable. But you will
have to use another software to get the data from them, like Amibroker.
hope it helps,
J
Anekdoten,
In the P&L thread, you advised yesterday that you made about $79k.
http://www.elitetrader.com/vb/showt...176#post1645176
Those are very impressive numbers. I'm just curious to know approximately how
many trades you made, and the approximate size, in contracts, of these trades.
I'm just looking for off-the-cuff, ballpark numbers. And was it all NQ?
__________________
I'm handing you no blarney
Ugly arse day on the YM. Sitting on my hands for 3.5 hours waiting out this
chop can be boring.
Oh well, I guess like they say sometimes the best trade is no trade at all
![]()
Quote from Thunderdog:
Anekdoten,
In the P&L thread, you advised yesterday that you made about $79k.
http://www.elitetrader.com/vb/showt...176#post1645176
Those are very impressive numbers. I'm just curious to know approximately how many trades you made, and the approximate size, in contracts, of these trades. I'm just looking for off-the-cuff, ballpark numbers. And was it all NQ?
Umm, I am pretty sure he doesn't trade 1 contract...LOL
Quote from version77:
IF it WAS NQ, he made 3,950 pts. Astronomical...
I'd like to see an execution report to see if it was real or not...
Quote from Razor:
Umm, I am pretty sure he doesn't trade 1 contract...LOL
__________________
I'm handing you no blarney
Quote from Thunderdog:
Obviously. Only Jack could do that sort of thing with one contract. Even so, some basic stats of Anekdoten's trading yesterday would be enlightening.
__________________
If at first you don't succeed ...
Hi ![]()
Will results until end of week and then monitor this off and on since Anek is on
a break ![]()
Net Loss -$120, traded ok, just sporatic OEX I guess.
Didn't do so hot on AAPL either.
Cheers ![]()
Have no Idea the sizes Anec trades, but adding in 20 or 30 cars every pullback on a good run a couple of times in a day, adds up quickly. I think we all can see it looking over the charts at the end of the day. It's seeing it and dealing with it in real time that Anec does so well.
I cannot even think how that kind of money is made in a day but I do think it
is ironic that people register just to visit this thread to trash it.
Dont want to show your real anonymous id guys?
![]()
Quote from screenstruck:
I cannot even think how that kind of money is made in a day but I do think it is ironic that people register just to visit this thread to trash it.
Dont want to show your real anonymous id guys?
50 boxcars and a 75 point down move, what is the enigma?
Meanwhile back at the ranch, anyone positioning to catch the break out of the ST
forming in the ES?
Quote from anvil993:
50 boxcars and a 75 point down move, what is the enigma?
Meanwhile back at the ranch, anyone positioning to catch the break out of the ST forming in the ES?
Sniff..sniff.. Anyone else smell that? LMAO! [/QUOTE]
Earlier this month an ES trader who posts regularly to the P/L thread posted a
100k loss and no one questions his integrity. Well, if you can lose 100k in a
day it is also possible to take 100k out of this market. Why not focus on
getting your own trading to that level instead of trashing a trader who shares
with others?
Don't pay attention to these losers (scarrylarry, enigma2, etc.). They probably live at home with their parents, paper trade, and post under different names all day.
__________________
st
Quote from JimmyJam:
He's left a trail that is over a year long.
If you can't see it in his writings, asking for more and more physical proof is just foolish.
Even if you did see the number of contracts traded, unless you knew HOW he was trading, they wouldn't mean anything in and of themselves.
Good trading,
JJ
__________________
I'm handing you no blarney
Anek ( and other people) have given of their free time (what little there is
of it) to help other traders. To respond in kind with sincerity all day long is
hard on the mental senses.
Anek's a good trader, and he's been posting great info and from what I've read,
has actually made some people more profitable.
So....lets keep this thing positive and in the true spirit of what ET is
supposed to be--a place to share and vent your frustrations with the
market...not each other.
Think about this..there aren't many other threads on ET that really try to help
the "other" guy so what's gonna happen when this one is gone due to the 'good
guys" getting tired of the BS??
Best thing to do is IGNORE the detractors and focus on what YOU can do the help
the OTHER guy. You won't be able to keep what you get unless you give it away.
Good luck and good trading to all of you!
GT
The envy and jealousy is so very clear among the losers and skeptics.
Anek frequently visits an IRC channel to share his views in a closed channel
that is mostly European. Take a wild guess as to what is his origin???
Not just today but on a daily basis he is about the only person there that
massacres the market.
Today, as always no exception.
This is from today.....
* Anek buys NQ 85 (1st unit in), intraday swing
* Anek buys NQ 88.25 (2nd unit in), intraday swing
etc etc
Take a wild guess as to where he sold???
Yep, right at resistance while averaging up like a madman and doing it all via
live plays.
Envious losers you should be glad he decided to share some of his trading
wisdom.
Daniel
Quote from Anekdoten:
10-17-07 07:08 PM
Conclusion of Phase I
...Feel free to discuss the tasks and methods at hand among you all. I will now take a much needed rest and when the time is right for me, I will return for Phase II...
Until the next time.
(to be continued)
Anek
Quote from Thunderdog:
10-18-07 08:37 PM
You're reading more into my post than is actually there. I'm not asking for proof, and I'm not trying to figure out the details of what Anekdoten is doing. I simply remarked that the reported profit was very impressive and so I was curious about trade size and frequency. You may wish to re-read my original post on page 467 of this thread (which you quoted).
__________________
"Don't judge each day by the harvest you reap, but by the seeds you plant."--Robert
Louis Stevenson
For what is worth, I asked Anek what other ET posters he thought offered high
quality material to learn from in the ET forums and he listed three.
One of them was NihabaAshi, spoke very highly of his wisdom and quality posts.
The other one was the market commentrary of Ivica? Spelling there might be a
little off.
The last one was future something 71, need to check my notes.
Thought I would share and take this opportunity to thank (Mark) for the
commitment to help among us struggling traders.
Daniel
Quote from daniel33:
The envy and jealousy is so very clear among the losers and skeptics.
Can someone who creates indicators for NinjaTrader please PM me? Thanks!
Meanwhile back at the ranch, anyone positioning to catch the break out of the
ST forming in the ES?
Quote from Cxinvest:
Gotta pop pretty soon, or turn into goop.
~Cx
Long ASTI from today. Up a good chunk ...
Going long DMAN tomorrow.
Also doing futures.
In an attempt to trick the uploader... I'm pasting the image that I wanted to
show a few days ago onto a word document.
The first illustration refers to a fake triangle breakout to upside. Notice how
hard it breaks down after it passes the entry to the other side of the triangle.
The second illustration is to show that sometimes you have got to admit that you
lost a trend and you have to wait for the pullback. If the trend comes back in
to give you another chance, odds are that the backing and filling is going to
lead to consolidation or a reversal. So... pull your order and wait for another
opportunity.
What Anek posts as a P&L is in know way related to the integrity of the
thread.
The only P&L that matters is your own !!!
The early pages of this thread provide eneough information to consistantly take
money out of the markets.
He never claimed to make a million a month.....he has some huge win days over
40, 50k+ etc, then some 'normal' days probably between 2 - 10k and then some
small losing days every now and then. He has stated this many times. Every month
we have some chop days which he will either take a small loss on or small gain,
some normal days where he will do OK, and then he breaks the bank on the trend
days where he adds to his winners. I am not sure why this is so hard to believe
for some people
Anyway, like someone said already, no matter what you believe about his PnL the
one thing that is crystal clear is that Anek has devoted many hours of his time,
almost daily, to help other traders out, just read through and look at his posts
here with charts and quick responses to questions asked of him and you will soon
realize that he had one goal in mind, to help other traders PERIOD.
Don't worry be happy ![]()
Cheers ![]()
Ditto Razor!!! I think we are seeing some of that bad psychology here, that
many people, not just traders, can never surpass. They remain losers because of
their own faults and the only way they can deal with this is try to bring others
down, since they are failures at bring themselves up.
Nothing new. Just no place for it here.
Just a follow-up to my prior post of inquiry, if I may. It seems to have
raised some animosity. That was not my intent.
My inquiry on page 467 of this thread was respectful and genuine. However, I
have two observations regarding the subsequent response from some of the
posters, none of whom were addressed in my post. First, I note the immediate
defensive response, as though the subject of my inquiry was a delicate and
fragile figurine that needed protecting. Second, I'm surprised that those of you
who are following Anekdoten's method are not at least as curious as I am. If I
were following his method, which I am not, then I would likely be even more
inquisitive. Why do mere questions pose such threats to some of you? Is this a
business? Or is it a religion, where you can only ask so much before it starts
to unravel before your eyes, so that you have to keep the hard questions at bay?
I'm not implying that Anekdoten and his methods fall under this latter category,
however, some of you are behaving as though they do.
Where is your own natural curiosity?
__________________
I'm handing you no blarney
Folks,
There was a specific thread setup for these types of discussions long
before Anek started this thread.
I just can't think of a better place to post such questions and debates outside
that other thread that has been occurring after Anek announced he was
going to take a break from trading and a break from sharing his methodology.
Simply, to prevent trashing his thread any further with the arguments...
Please take your discussion to the thread designated for such at the below link.
http://www.elitetrader.com/vb/showt...threadid=101845
As a reminder, once Anek returns or a moderator gets involved after receiving a
few complaints...
Further, you all know your posts are going to be deleted and/or this
thread will be closed.
Therefore, you may as well start posting in an area where your words will remain
intact long after this thread has concluded.
Thus, nobody is trying to silence the questions concerning his P/L statements
that were posted elsewhere by him...
I'm just trying to inform those with questions that this thread isn't designated
for such.
Mark
__________________
"Don't judge each day by the harvest you reap, but by the seeds you plant."--Robert
Louis Stevenson
This system is very enlightening. It has helped my trading immensely. the
logic of it strikes home.
What is Anek's PnL? Who cares. To satisfy my curiosity is how well the system
works for me.
We all know the posters who are trying to sabotage the thread. And we can all
recognize the new ones.
Let's IGNORE them.
Please, please ignore them.
-Tech
Quote from NihabaAshi:
Folks,
There was a specific thread setup for these types of discussions that has been occurring after Anek announced he was going to take a break from trading and a break from sharing his methodology.
Simply, to prevent trashing his thread any further with the arguments...
Please take your discussion to the thread designated for such at the below link.
http://www.elitetrader.com/vb/showt...threadid=101845
As a reminder, once Anek returns, you all know your posts are going to be deleted.
Therefore, you may as well start posting in an area where your words will remain in tact long after this thread has concluded.
Mark
__________________
I'm handing you no blarney
Question on the close plus 1 tick for entry ln a break out. If the previous high is exceeded, but then pulls back leaving the wick higher, does that wick then become the high to be exceeded for a new closing high, since it has run all the stops up to that level or do you still just wait for a close above the previous high which may then be lower than the earlier wick?
As someone has already stated, these methods are nothing knew.
Hypothetically if Anek didn't make a dime, the stuff that he is teaching really
works and he isn't asking for anything from anyone. He isn't teaching a magical
method, he isn't selling a system.
His purpose was to prove that trend following and price is all you need. He has
done that. His p/l is irrelevant. Anyone who has traded successfully knows that
this stuff works. If you guys are really questioning the validity of the
methods, you guys might want to look at your own results and maybe start
following the thread.
No one here worships Anek. However, for you to come and shit on someones thread
who has helped others immensely and asked for nothing in return is just not
understandable in the least bit. You guys must have problems of your own.
Questioning his validity and trashing Anek are 2 seperate things. You guys have
made your points and are simply sticking around to ruin the thread.
Quote from Thunderdog:
...Why would my question not be relevant in the very thread where Anekdoten has outlined his method since it pertains to his performance using that very method?
Quote from Thunderdog:
...Would the information I requested not be of any value to those members who are following his approach?
All I was looking for was a few sentences from Anekdoten in due course...
__________________
"Don't judge each day by the harvest you reap, but by the seeds you plant."--Robert
Louis Stevenson
Quote from bmwhendrix:
Question on the close plus 1 tick for entry ln a break out. If the previous high is exceeded, but then pulls back leaving the wick higher, does that wick then become the high to be exceeded for a new closing high, since it has run all the stops up to that level or do you still just wait for a close above the previous high which may then be lower than the earlier wick?
Here are the stats:
-122 private messages of "I miss you Anek" ?
-several emails with porn to taunt ?
-wives and sisters offered as reward ?
Due to popular demand, the madman and his stouts are back.
Let's talk AHG!
Anek
Welcome back dude! ![]()
Quote from Anekdoten:
Here are the stats:
-122 private messages of "I miss you Anek" ?
-several emails with porn to taunt ?
-wives and sisters offered as reward ?
Due to popular demand, the madman and his stouts are back.
Let's talk AHG!
Anek
I thought it was a mistake when I got this message:
Reply to post 'AHG - Profitable Strategy for Struggling Traders'
...like ghost or something.
The only anek I could get was searching under your name for posts.
Welcome back!
NQ Analysis for 11.01.07
Carnage day for the indexes, particularly YM. NQ was very stubborn confirming
once again that tech is the strongest sector right now. Still, it felt the
selling pressure and touched the double bottom created on Halloween during fed
day, a bottom I was expecting as target with a greedy smile when I saw that
panic emerge during the afternoon.
NQ is the instrument I've been concentrating on lately, particularly because I
feel extremely comfortable with it so will limit myself to NQ analysis, for now.
IMHO the indexes, like in boxing, were saved by the bell at 4PM because in the
afternoon the momentum was there. Surprisingly it did not continue in the
afterhours of the night. Possibly waiting for an Asian response, most probable
the job news of Friday morning.
Quite an easy day to trade for the AHG system. As always stops are small,
usually based on ticks above/below entry bars with a possibility of re-entry on
a stop out assuming the trend is intact to avoid big losses.
Being aware of the all meaningful support and resistance areas of the bigger
picture (bigger chart) is not only a plus but a very strong ally in trading,
even daytrading. It allows you see how much you can press it, like today and
that elusive 2210 at the end when you were supposed to cover.
Attached please find positive opportunities that were found intraday.
Some potential entries that resulted on small losses were omitted for the sake
of simplicity. As you know by now, small losses are a necessity in trading and
they should not scare you at all. It's big losses you want to shy away from.
Accept them as a trading expense, like comission, will help you keep your peace
of mind. No one blew up from a day of multiple small losses. Needless to say,
AHG gave you the possibility of many many winners today, including some home
runs, as it gave me and for that, I'm thankful.
Anek
Anek,
Welcome back.
No PMs sent by me, but glad you are back!
![]() Had I known you were counting I
would have sent a few.
Had I known you were counting I
would have sent a few.
Glad to see you back!
![]()
i'll be following along - as always
Welcome back Anek, and thank you brother!
Daniel
Thanks for continuing the thread - DB question
Hi Anek,
Thanks for continuing the thread. I appreciate it.
I saw your NQ 25000 volume chart you posted in another thread. I see a DB you
marked on 10/24 around noon. How do you trade these bigger picture DB's ? Do you
like take them with bigger stops based on the 25000 vol. chart?
Is there anyway to take these bigger picture excellent DB setups with reduced
risk (similar to small risk in 1000 volume chart) ? May be something like a
trendline break or some other setup in 1000 vol chart (with wind on the back
from 25000 DB setup) and target the 25000 trendline break?
Thanks
DisciplineTrader
D,
There are different ways to play this.
The bigger the chart, the bigger the stop but the bigger the target, so
technically you play them the same way, just adjusting car size to make up for
the higher risk.
Typically when I see something interesting in the big charts I look for a
harmonic entry on the smaller chart to reduce risk even further.
Remember that reversal formations on meaningful support and resistance areas are
extremely powerful and this is exactly where many pros milk it the most.
Good trader friend says the little people watch the small charts while the big
boys the big charts. We can get an edge while watching both, at least I think so
![]()
However, this requires the greatest patience as these special setups don't come
very often.
Anek
Filtered time and sales
Lately I've been experimenting with only watching the tape for big orders, feel
I can read the tape much better and with less distraction when I only pay
attention to the big orders and exclude the little people.
After all, the small car lots are just noise.
Here is a sample of how clear price action was on the filtered tape today.
Smooth as baby's butt, no pedophiliac implications intended, I do have a baby
![]()
Anek
Yes!! ![]()
Thanks Anek.
(This space for rent)
In case Timothy Sykes decides to advertise in the AHG thread, after all that guy
is marketing his book everywhere !
![]()
Anek
Scaling out on DB Setup - is my scaling out targets flawed?
Hi Anek,
Can you please tell me if my scale out method is flawed?
I am taking the DB setups, which are working well. But I am trying to understand
where to scale out. For some reason (may be it feels comfortable), I am doing
the following way:
Taking it with 3 NQ contracts( multiples of 3). I am keeping Target1 (1/3rd out)
- as 2 NQ points, T2 ( other 1/3rd out) - as 4 NQ points, T3(last 1/3rd out) -
as the size of DB ( the distance from low point of DB to the middle up point).
After the T2 hits, I am keeping my stop on remaining to breakeven. And after my
T3 hits, I am trying to see for a pullback and ride it till trendline breaks on
1 contract. (1/3rd size).
For example on the 10:15 EST NQ DB setup, my risk on each contract was 4.5 NQ
points, with entry around 2226.
Total risk for 3 contracts was coming to 13.5 NQ points (4.5 * 3).
Total reward including my T1,T2,T3 was coming to 12.5 NQ points( 2 + 4 + 6.5 ),
without including the 1 contract reentry on pullback after my T3 hit. I missed
the reentry after my T3 hit.
Overall Reward : risk ratio = 12.5 : 13.5 = 0.9 : 1
And it is less than 1:1 and I was trying to get 2:1, so that when a DB works for
me, it more than covers any failed DB setups.
Is my target taking scaleout method flawed? The reason is if another DB setup
fails, then I loose more. So, was trying to find if taking T1 2 points, T2 4
points and T3 DB size and then after T3 is filled looking for a re-entry on 1
contract (and trail 1 contract till trendline breaks), is it it good or are
there flaws.
Or do you think it is safe to keep T1 as DB size itself and scaleout like 1 or 2
contracts when hit.
Thanks
DT (DisciplineTrader)
D,
It all depends on what kind of DB we are talking about but I don't like those
close targets of yours, I prefer price action to guide me as to when I exit.
There are many types
- Massive formation at the LOD after heavy downside
- A little shit refusing to give up on support
- A W in the middle of the trend signifying congestion of the current trend
....etc etc.
Assuming a massive one, then the answer is be very greedy because price is
severely oversold (a term I hate) and it has a very good chance of being a trend
reversal.
Use a very flexible trendline to guide you and watch how price makes higher
swings, and ride it for as much as you can. Ideally I want my first target to be
at the very least as big as the reversal formation. After that do not exit until
the trendline breaks and be aware of any upcoming major resistance points or
psychological areas (NQ's 2250 comes to mind).
If it forms on a massive support area of the big charts, treat it like the
Dragon Pattern once you see the two legs at support and downtrend line break
enter then add on the swing high confirmation a second unit. This feels like
Deja Vu because it is exactly how I played the Double Bottom on FOMC day at the
2210 area.
Once again be very aware as to where that DB formed and how significant the area
is, this sentence alone will make you a lot of money as you get more
experienced.
Anek
Frustration, Risk and the Acceptance of Small Losses
Nothing works all the time, I think we can all agree with this. If you don't,
time to adjust cause nothing does.
With that in mind don't bet the house on any setup because we never know for
sure if it's going to work or not. However, if your trading allows the runners
to run, like AHG suggests, then a loser here and there should not frustrate you,
not only should the loss be relatively small compared to the winners but as I
said numerous times they are necessary and inevitable in profitable trading,
notice what I said, profitable trading.
Losing small is ok, don't be like the rookies who just hate to be wrong, the
first sign of a real trader is when you see him/her losing quite often, albeit
losing small. Why ? Because it's not about being right but about making money.
Feel like a broken record but some things must be emphasized over and over
again.
Hope it helps.
Anek
Welcome back! This news is definitely worth a few stouts.
~Cx
Thanks Anek for the reply on my scaleout method. I appreciate it.
Thanks for the tip to treat DB as dragon pattern, when it happens near massive
support area.
Thanks
DisciplineTrader
I've been driving myself nuts all day trying to figure out how I would have
caught some of the trades on your chart.
Thanks for posting that.
Question:
What setup gets you in the very first red circle on your chart?
The market wasn't open very long, so how do you know the trend is down, or are
you just taking a chance there because of the red down bar.
In hindsight it looks easy as pie, but in real-time not so much...........at
least not for my dumb ass.
Quote from Anekdoten:
NQ Analysis for 11.01.07
As always stops are small, usually based on ticks above/below entry bars
Anek
__________________
Lets all drink to the death of a clown.
thanks anek !!!! welcome back !!!!!!!!
A. Sorry, my wife has backed out of the deal. She didn't think you were coming back. An extra case of stout should put it about even though.
Welcome back Anek!
Failed Head and Shoulders in NQ 25000 vol chart?
Hi
Is NQ attempting to do a failed Head and Shoulders pattern on 25000 volume chart
?
Thanks
DT (DisciplineTrader)
Hi
Looks like "failed Head and Shoulders" didn't work and "Head and Shoulders" is
in play in NQ 25000 vol. chart. Also along with Double top setup happening well
in 1000 vol. chart.
DT (DisciplineTrader)
i am new at this but its lovely to have you back!!!![]()
![]()
D,
The conclusion to the overnight swing, target reached.
Anek
Quote from ajaykakkad:
i am new at this but its lovely to have you back!!!
__________________
A Candle Loses Nothing By Lighting Another Candle
Thanks Anek for the chart on target reached. I took a part of it with the
Double Top trigger from the morning.
Looks like NQ bounced off that trendline around 10:07 EST. Did you see any other
pattern which hinted a reversal around NQ 2191. When did you reverse to take the
long ?
Thanks
DT (DisciplineTrader)
Beautiful W on NQ at support.
Those babies, dual confirmation, really are free money.
Anek
Thanks Anek for that W post. My bad that I missed it.
Thanks
DT
Quote from Anekdoten:
Frustration, Risk and the Acceptance of Small Losses
Nothing works all the time, I think we can all agree with this. If you don't, time to adjust cause nothing does.
With that in mind don't bet the house on any setup because we never know for sure if it's going to work or not. However, if your trading allows the runners to run, like AHG suggests, then a loser here and there should not frustrate you, not only should the loss be relatively small compared to the winners but as I said numerous times they are necessary and inevitable in profitable trading, notice what I said, profitable trading.
Losing small is ok, don't be like the rookies who just hate to be wrong, the first sign of a real trader is when you see him/her losing quite often, albeit losing small. Why ? Because it's not about being right but about making money. Feel like a broken record but some things must be emphasized over and over again.
Hope it helps.
Anek
__________________
Boib
Its easy to make a small fortune if you start with a big one
Ugh! Other than catching a nice chunk of that first big drop, I feel like
I've been beating my hand with a hammer!
![]()
Gotta re-read my AHG notes. Not sure why I'm sucking ass today!
![]() Indecision? Confusion?
Indecision? Confusion?
Done for the day while I'm still in the green. Have to review this weekend.
Nice to have you back Anek.
Quote from Anekdoten:
Here are the stats:
-122 private messages of "I miss you Anek" ?
-several emails with porn to taunt ?
-wives and sisters offered as reward ?
Due to popular demand, the madman and his stouts are back.
Let's talk AHG!
Anek
Quote from bluedemon77:
A very pleasant surprise. Now I have a reason to read ET again! Glad to have a positive influence back here amidst the trolls, posers and just plain nasty folks that seem to dominate the conversations here.
NQ Alert
Massive W formation on NQ multi day charts.
Happening as we speak, wait for confirm.
Anek
Thanks Anek for the W alert. Is it on the 25000 NQ vol. chart ?
I see price is trying to break the down trendline(which started today morning)
on this chart. Are you waiting for a candle close above 2219.75 on this chart?
Thanks
DT
Anek..... sorry it took so long to comment but a big thank you for providing such a truly splendid thread........one of the all time best on elite trader these past 6 years.....
Welcome back Anek.
Looks like that W has a decent break... so far
-Tech
Sweet Jesus that making me happy.
Anek
Absolutely brutal, lovely, sexy, you name it with dual confirmation from
bigger chart which had the very same formation so you could easily average up on
the extra subsequent confirmations.
Kind of like recursive Ws.
Attaching the smaller chart.
Anek
...and the big chart.
Anek
Thanks for the great charts Anek. I appreciate it.
Thanks
DT
D,
No problem, as you prob noticed the small chart broke the trendline so it was
time to take most profits out of the table.
Question now is, if this pullback is a bullflag .
Time will tell but on a Friday afternoon low volume chop suey, I'm not placing
any big bets especially with the big W pay off which is money for me to keep,
mine all mine, all mine mine mine
![]() childish representation of
preservation of capital!
childish representation of
preservation of capital!
Anek
FXI
double bottom.
![]()
King,
Good going confirmed and all.
BTW, what kind of acid trip chart is that ?
![]()
Anek
Quote from Anekdoten:
King,
Good going confirmed and all.
BTW, what kind of acid trip chart is that ?
Anek
King,
I only do indexes, you should read the whole journal, bet you learn a thing or
two.
Anek
Anek,
Can you label where your entries were? Today, I took most of the DBs on NQ on
the way up but got stopped out. I was using a 1000V on NQ.
Here are my entries. All longs.
1. 1142 EST @ 2204.5 -1.5
2. 1212 EST @ 2214.25 BE
3. 1230 EST @ 2217.25 BE
4. 1243 EST @ 2221.25 -1.5
They all seemed to work in hindsight but maybe got unlucky. Kinda frustrating.
Stopped trading as I felt i was getting emotional.
thanks
Jtrader
Anek,
Congrats on the excellent trades !
In the morning near market open, short on the Double Top worked well. Do DT's
which form in overnight session(sometimes lot of hours between 2 tops in the
overnight DT's) are also reliable?
What are the horizontal lines you marked on the bigger chart (15000 vol chart)
you posted ? Are they like S/R levels you marked with price swing action or are
they from something like Market E Motion on bigger chart ( not sure if
MarketEMotion works on bigger chart).
Also on 5000 vol. chart, today's price action looks like a big dragon pattern( I
hope I got it correctly), is it correct?
Thanks
DT
NQ Analysis for 11.02.07
Had an amazing day with only two losses, a minimal one in NQ trying to catch the
falling knife without confirmation like a rookie and the same play on ES were I
gave up 2 points for lack of discipline and thinking I am omnipotent to call a
bottom in a strong downtrend, a foolish thing to do.
The good news is the winners were in the double digits and one incredible home
run that made my day shine. Couple of averaging up plays on retracements during
strong trend that elevated profits a bit.
Needless to say, I will try to learn from the two dumb mistakes so I can further
improve my trading. Trading is a learning process that never ends.
Once again, NQ continues to reward me very nicely and days like this confirm
that I'm in the right instrument doing the right things.
Have a great weekend everyone.
Anek
A. On your last 2 shorts and last long trade, were you entering on a trendline hit?
Quote from disciplinetrade:
Anek,
Congrats on the excellent trades !
In the morning near market open, short on the Double Top worked well. Do DT's which form in overnight session(sometimes lot of hours between 2 tops in the overnight DT's) are also reliable?
What are the horizontal lines you marked on the bigger chart (15000 vol chart) you posted ? Are they like S/R levels you marked with price swing action or are they from something like Market E Motion on bigger chart ( not sure if MarketEMotion works on bigger chart).
Also on 5000 vol. chart, today's price action looks like a big dragon pattern( I hope I got it correctly), is it correct?
Thanks
DT
Quote from bmwhendrix:
A. On your last 2 shorts and last long trade, were you entering on a trendline hit?
Thanks Anek. I appreciate it.
The 50% Fibonacci is as you said very powerful and as you pointed, its amazing
how today's LOD ended up at 50% of the multiday big swing.
Have a nice weekend everyone !
Thanks
DT
Linear Regression Envelope
Works on TS and Multicharts
Quite useful for spotting channels automatically without the need to draw the
lines manually.
Code attached:
inputs:
Length( 100),
EndDate_YYMMDD( 0), { 0 or YYMMDD, constant; if EndDate_YYMMDD = 0,
EndTime_HHMM ignored and last bar on chart used }
EndTime_HHMM( 0), { 0 or HHMM, constant; EndTime_HHMM ignored if 0 }
ExtRight(true) ,
Linewidth(0),
Linestyle(3),
NumDevs(2);
variables:
EndDate( iff( EndDate_YYMMDD < 500000, EndDate_YYMMDD + 1000000,
EndDate_YYMMDD ) ),
LRV( 0 ),
LRVAgo( 0 ),
TLLRV( 0 ),
TLLRVHI(0),
TLLRVLO(0),
StdErrEnv(0),
CumStdErr(0),
AvgStdErr(0),
EnvWidth(0),
Flag( 0 ) ;
StdErrEnv=NumDevs*StdError(C,Length);
CumStdErr=CumStdErr + StdErrEnv;
AvgStdErr=CumStdErr/Barnumber;
if Flag = 0 then
{ Insert a lin reg line for the first time and set it's color and extents }
begin
if EndDate = 1000000 and LastBarOnChart then
begin
LRV = LinearRegValue( C, Length, 0 ) ;
LRVAgo = LinearRegValue( C, Length, Length - 1 ) ;
TLLRV = TL_New( Date[ Length - 1 ], Time[ Length - 1 ], LRVAgo, Date, Time, LRV
) ;
TLLRVHI = TL_New(Date[Length - 1], Time[Length-1],LRVAgo+IFF(StdErrEnv
end
else if Date = EndDate and ( Time = EndTime_HHMM or EndTime_HHMM = 0 ) then
begin
LRV = LinearRegValue( C, Length, 0 ) ;
LRVAgo = LinearRegValue( C, Length, Length - 1 ) ;
TLLRV = TL_New( Date[ Length - 1 ], Time[ Length - 1 ], LRVAgo, Date, Time, LRV
) ;
TLLRVHI = TL_New(Date[Length - 1], Time[Length-1],LRVAgo+IFF(StdErrEnv
end ;
if Flag = 1 or Flag = 2 then
begin
if Length <= 50 then TL_SetColor( TLLRV, Red ) ;
if Length > 50 and Length <=100 then TL_SetColor( TLLRV, Green);
if Length > 100 and Length <=200 then TL_SetColor(TLLRV, Cyan);
if Length > 200 and Length <=400 then TL_SetColor(TLLRV, BLUE);
if Length > 400 and Length <=800 then TL_SetColor(TLLRV, Yellow);
if Length > 800 then TL_SetColor(TLLRV, White);
TL_SetColor( TLLRVHI, Green );
TL_SetColor( TLLRVLO, Red );
TL_SetSize(TLLRV, Linewidth);
TL_SetSize(TLLRVHI, Linewidth);
TL_SetSize(TLLRVLO, Linewidth);
TL_SetStyle(TLLRVHI, Linestyle);
TL_SetStyle(TLLRVLO, Linestyle);
TL_SetExtLeft( TLLRV, false ) ;
TL_SetExtLeft( TLLRVHI, false );
TL_SetExtLeft( TLLRVLO, false );
if ExtRight then
begin
TL_SetExtRight( TLLRV, true );
TL_SetExtRight( TLLRVHI, true );
TL_SetExtRight( TLLRVLO, true );
end
else begin
TL_SetExtRight( TLLRV, false ) ;
TL_SetExtRight( TLLRVHI, false ) ;
TL_SetExtRight( TLLRVLO, false ) ;
end;
end;
end
else if Flag = 1 then
{ Reset the end-points of the flag-1 LRLine at each new bar after it has been
drawn
for the first time; this effectively results in a new LRLine each time. }
begin
LRV = LinearRegValue( C, Length, 0 ) ;
LRVAgo = LinearRegValue( C, Length, Length - 1 ) ;
TL_SetBegin( TLLRV, Date[ Length - 1 ], Time[ Length - 1 ], LRVAgo ) ;
TL_SetBegin( TLLRVHI, Date[ Length - 1 ], Time[ Length - 1 ],
LRVAgo+IFF(StdErrEnv
TL_SetEnd( TLLRVHI, Date, Time, LRV+IFF(StdErrEnv
Screenshot of the ulitity attached
Anek
Thanks for the code Anek.
I get "Numerical expression expected here" when verifiying. Maybe some ")" were
left off?
TLLRVHI = TL_New(Date[Length - 1], Time[Length-1],LRVAgo+IFF(StdErrEnv
TLLRVLO = TL_New(Date[Length - 1], Time[Length-1],LRVAgo-IFF(StdErrEnv
Perhaps due to width the forum is stripping part of the code.
Here is the ELD to make it easier.
Little tip, you can load multiple instances of the ELD at once with different
length to obtain a Linear Regression Envelop for the immediate trend and a
medium one.
As much as you want really but I think more than two is overkill.
Load on your anchor chart too.
Anek
NQ Weekly Analysis for 11.02.07
Have not looked at the other indexes but to say NQ has a mind of its own lately
is an understatement.
My study conclusion shows a bullish Nasdaq despite weakness in the other
indexes.
Attached please find chart analysis of some recent swings or overnight plays
taken and key areas identifying the bull move confirmation including subsequent
confirmations of next resistance barriers along with support areas that could
indicate upcoming consolidation or a change of a trend.
There is something else important on that chart that I did not mention, waiting
to see who's first. ![]()
Hope it helps.
Anek
Hi Anek,
Thanks for the NQ analysis and also for the Linear Regression Envelope.
I know some of us are on NinjaCharts, if any of AHG-ers faimiliar with Ninja
programming, can translate the code to Ninja code, I would appreciate it.
Thanks
DT
Filtered Time and Sales
Hi Anek,
Regarding the Filtered Time and Sales you posted earlier, what "size filter" do
you use for NQ? So, with this filtered T and S, do you also have regular T and S
window (non filtered one) open to see if the market volume is like dead.
Also can you please tell me what you use for ES,ER2 and YM( I know you no longer
trade YM much,but if you have to).
I appreciate it.
Thanks
DT
Re: Filtered Time and Sales
Quote from disciplinetrade:
Hi Anek,
Regarding the Filtered Time and Sales you posted earlier, what "size filter" do you use for NQ? So, with this filtered T and S, do you also have regular T and S window (non filtered one) open to see if the market volume is like dead.
Also can you please tell me what you use for ES,ER2 and YM( I know you no longer trade YM much,but if you have to).
I appreciate it.
Thanks
DT
Thanks Anek.
Thanks
DT
Quote from Anekdoten:
NQ Analysis for 11.02.07
The good news is the winners were in the double digits and one incredible home run that made my day shine. Couple of averaging up plays on retracements during strong trend that elevated profits a bit.
Have a great weekend everyone.
Anek
Quote from Anekdoten:
STEP 4 MONEY MANAGEMENT
As you get more experienced, I highly recommend you use an average up
approach. More on this later, until then, use the same car size
on every play and for God's sake DO NOT AVERAGE DOWN unless you are
just trying to get fills for your intended car size, never
surpassing it. I previously stated and those that known me for a
while know I advocate averaging up. I feel this is an advanced money
management technique and for now I am not disccusing it to avoid
confusion/mistakes.
STEP 5 DISCIPLINE
I'll be blunt. Trading is not for the irresponsible. Break the rules
and you will eventually lose big, period. Trading will forgive
you if you were wrong on a play even several ones, it won't forgive or tolerate
idiocy and stupidity. All I need to say on this and you have been
warned.
Anek [/B]
Cokes,
This is not part II, this is just a continuation of AHG to fill any possible
blanks.
There is a lot of discussion on the journal regarding averaging up. It is
absolutely the holy grail of money management. Now, it requires skill in reading
price action and exhaustive dominance of your trading psychology because it will
decrease your accuracy while requiring an accurate trader, therefore, it is most
definitely for advanced traders. Units are added on additional confirmations
that the trend is only getting stronger, protective stops are trailed based on
support and resistance geometrics to protect your capital and your recent gains.
It's only appropriate for certain days, days where there is panic or euphoria.
As far as discipline, once again as explained several times in the journal, it
is your most important asset as a trader.
There is a very good chance I'm not the best trader in the ET forums, probably
not the best money manager either but I'm willing to bet one unit, that when it
comes to discipline, I'm up there with the very best and if proven correct, I
will bet you an additional unit that the day I lose the disciplinary edge, I
will lose them both.
Anek
NQ is also forming a reverse head and shoulders where the right should is at
the neckline.
The neckline also forms a triangle with the upward trendline. It's not a
symmetrical triangle so I'm not sure it has a lot of value.
http://images.sierrachart.com/uploa...UploadImage.png
Quote from Anekdoten:
NQ Weekly Analysis for 11.02.07
Have not looked at the other indexes but to say NQ has a mind of its own lately is an understatement.
My study conclusion shows a bullish Nasdaq despite weakness in the other indexes.
Attached please find chart analysis of some recent swings or overnight plays taken and key areas identifying the bull move confirmation including subsequent confirmations of next resistance barriers along with support areas that could indicate upcoming consolidation or a change of a trend.
There is something else important on that chart that I did not mention, waiting to see who's first.
Hope it helps.
Anek
A. Comparing your entries of trendline hits vs. lower low + 1 tick. What kept you from going short on breaks of the 4 supports I added to your chart of yesterday. I tried a couple of them, which of course went nowhere. In retrospect I see that the distance to the lower trendline from any of those possible entry points is minimal, if it were viewed as a resistance level. So the room to play is minimal. Such a sell would really be a gamble on a break of that resistance line instead of a bounce which has a higher probability. Is this it? As opposed to a more dramatic sell off where a pullback may not even come back all the way to test the last swing low. In that case a lower close +1 tick would be more appropriate. Sound about right?
Quote from rverheyen:
NQ is also forming a reverse head and shoulders where the right should is at the neckline.
The neckline also forms a triangle with the upward trendline. It's not a symmetrical triangle so I'm not sure it has a lot of value.
http://images.sierrachart.com/uploa...UploadImage.png
B,
If price is trading in a channel, for the sake of argument, lets say a downtrend
channel, expect it to bounce up and down with a bearish tendency. Now, to ensure
your stops are small, even in a downtrend you want to short high, and in an
uptrend you want to buy low, this is where the trendlines of the channel help.
This is not the same with formations, a solid confirmed reversal formation is
quite alright for entering at the lows but this is not the case of channels.
Hence why I suggest the trendline channels usage as guidance. The formations
price will form at the extremes do tell good info, so make sure you pay
attention. In yesterday's case the downtrend channel formed a bear flag as it
broke the channel to the downside, I was almost certain price was ready to fall,
but it failed miserably. Naturally I took my small stop and realized that price
was not ready to go to lower lows because if a confirmed bear flag failed, which
is one of the most reliable formations for downside, the failure should be
applied accordingly. The subsequent move was higher lows from the bear flag
pattern until it finally broke out of the channel. However, that was
predictable. As explained in the past, failures are sometimes as powerful or
even more powerful than patterns themselves.
Notice that during rectangle consolidation, where price is bouncing off support
and resistance there is no predominant side to choose between the two, in this
case, look at the whole day and choose the side that has been winning all day
long, if no clear definition, simply stay out and wait for better setups or wait
for a confirmed breakout that aligns with the predominant intraday trend.
Anek
whooaaa...journal back up.....
welcome back..Anek...I've got some reading to do.
As point B was the low of the big trend. The H&S is, in a way, at the bottom.
Quote from Anekdoten:
Correct.
The possible inverse h and s and the triangle at the edge were the missing patterns in the chart.
However, just like H and S work better at the very tops, Inverse H and S work better at bottoms, so it's position is not optimal. The rest is still valid.
Anek
Quote from rverheyen:
As point B was the low of the big trend. The H&S is, in a way, at the bottom.
R,
Look at this one:
That's how I like them.
Anek
R,
Here is one from the daily chart.
Anek
Quote from Anekdoten:
There is a lot of discussion on the journal regarding averaging up. It is absolutely the holy grail of money management. Now, it requires skill in reading price action and exhaustive dominance of your trading psychology because it will decrease your accuracy while requiring an accurate trader, therefore, it is most definitely for advanced traders. Units are added on additional confirmations that the trend is only getting stronger, protective stops are trailed based on support and resistance geometrics to protect your capital and your recent gains. It's only appropriate for certain days, days where there is panic or euphoria.
S,
Thank you. I know you advocate averaging up as well so if you could take the
time to post a few charts related to CL that would be great.
I must admit I'm not a student of crude but always looking forward to new tests
and adventures.
Anek
Quote from Anekdoten:
Valid point but I still prefer the head of the inverse head and shoulders to mark the absolute lowest point of the picture in study. It does look ok, particularly since it has confirmations from other patterns including the downtrend line break but definitely not optimal.
Anek
testing
Hi anek!
Welcome back, love the thread. I really feel like I have learned a lot from
reading it. My question: is it possible to test your strategy at all? I find
myself still not having the confidence MYSELF to believe in the system when I am
executing it real time (even on the sim. I take the sim very seriously
![]() I was thinking maybe if I
manually go through a week's worth of trading bar by bar and mark my entries,
and then test different exit strategies for that group of trades and do this for
a few weeks that might be a good approach? I just want to come up with something
that I have the CONFIDENCE to execute time after time.
I was thinking maybe if I
manually go through a week's worth of trading bar by bar and mark my entries,
and then test different exit strategies for that group of trades and do this for
a few weeks that might be a good approach? I just want to come up with something
that I have the CONFIDENCE to execute time after time.
I know you have mentioned testing a few times and I'm not sure if you are just
doing tradestation type tests or some kind of testing like the kind I'm talking
about.
Also, I don't know about others following the thread, but I feel like I would
benefit a lot if you marked your exits also as well as entries on your charts.
That way I could go "hmm so this is where anek took profits with this kind of
trade."
Oh well just my thoughts, thanks for any help!
S,
I will make the following colors official now:
Red = Short
Green = Long
White = Exit
Yellow = Point of interest
Anek
Don't forget that, even with a mechanical system or very strict rules, there
is allways the traders subjectivity.
This counts especially for exits imo.
I understand that. I guess the problem I have is that it's hard for me to
have a plan for my exit, because I'm not sure which exit style is better. When I
am in a trade I find myself asking, should I get out if price goes below the low
of the last two bars, or should I switch over to HA bars and wait for a color
change? Maybe I should just shoot for that next resistance point. I'm just
trying to find a way to feel comfortable with some kind of exit methodology so
that I am less unsure during the trade.
Edit: Not when I am in a trade, I know people will say "you plan the trade
before you enter it" and I know that. What I mean is, even when I am planning
the trade that is setting up, I don't know which exit to plan for, because I
don't know which is most appropriate.
S,
I suppose it depends on the kind of play:
- Reversal Patterns (greedy targets)
- Channel scalps (logical targets)
- Trend scalps(logical targets)
Between price action and the market emotion lines it should not be too difficult
at this point. Use trendlines at all times. When a trendline is not appropriate
then you should not be in a trade to begin with as you should flee from the
chop.
Before you fire the trade make sure you a target that surpasses the risk is
doable. If it did not work then so be it but I'm trying to teach people here how
to beat this game and this is done with small losses and well all kinds of
winners, including home runs.
Do not let the misconception that greed can affect your trading. Fuck that,
greed is good. Fear and stupidity are the ones you need to pay attention to.
When you are wrong, don't blink twice, when you are right, press it as much as
you can.
Protect your capital and shoot for the moon, even if you must lose 2-3 times in
a row before finally getting what you are after. If not today, tomorrow.
Here is a sample of me live trading on Friday..... examine my greed and you know
what, I was not greedy enough.
(Anek) ES Double Bottom formation
(Anek) pullback buyable
(Anek) breakout out of the downtrend channel incoming
* Anek buys NQ 17.25
(Anek) NQ Resist 22, once broken, 24 (mid between Hod and Mid), 26.50 (Pivot)
subsequent easy targets
(Anek) either that or stop out below uptrend line
* Anek sells NQ 5.25 at first target of 22 2nd 24 then 26
(Anek) come to papa 24
* Anek sells NQ 7.25 26 next target
(Anek) NQ 24 Meaningful Resistance, its mid point between HOD and MID, but Pivot
above it, so hoping it breaks for the touch of daily pivot to collecto go $
* Anek buys NQ 21.50 (add)
(Anek) TL Support
* Anek sells @ final target of 26 for +9.00 and 5.50 on averaging up
Same thing I teach here.
Anek
PS: The following play corresponded to the last green circle on the chart.
Anek, Thank you for the charts and for the hard work.
Not long ago you told me you were going to check the 233 tick chart on NQ. What
did you think ?
If a trader was a very patient person and wanted to master one setup, which one
would it be ?
Thank you mate.
Daniel
D,
Right, forgot about the 233.
Attached please find a side by side comparison of both charts.
No personal preference, both look great for AHG and NQ.
As far as your one setup question, that is easy if you got exceptional patience
and discipline.
Double Bottom/W formation after selling exhaustion at a meaningful support area
backed by the anchor chart. If you are serious about mastering it study volume
between the two legs, it will help.
Quite simply, the most powerful formation in pattern trading.
Anek
thanks for the reply!
Quote from solom113:
thanks for the reply!
ES and NQ correlation
Hi Anek,
Thanks for the trading log of Friday. I appreciate it. I see your comment ES
formed double bottom and then you buy NQ 17.25. I think ES formed DB around 3:12
EST and around same time NQ started to reverse to go up. So, do you use the ES
double bottom setup information as a sign to look for possible NQ reversal?
How much of correlation do you think is there between ES and NQ, or like ER2/YM
and NQ. And how do you use the correlation to trade NQ.
Thanks
DT
Re: ES and NQ correlation
Quote from disciplinetrade:
Hi Anek,
Thanks for the trading log of Friday. I appreciate it. I see your comment ES formed double bottom and then you buy NQ 17.25. I think ES formed DB around 3:12 EST and around same time NQ started to reverse to go up. So, do you use the ES double bottom setup information as a sign to look for possible NQ reversal?
How much of correlation do you think is there between ES and NQ, or like ER2/YM and NQ. And how do you use the correlation to trade NQ.
Thanks
DT
Thanks Anek.
Thanks
DT
AHG Bars
After quite some time working on price action paintbars I think I'm finally onto
something.
Should you have any requests let me know, and I will post your request, as I'm
still in the early stages of development and could use a little robustness on
the testing.
Attached please find a comparison between AHG Paintbars (Beta) and Heikin Ashi
bars below.
Input is appreciated.
Anek
Welcome back Anek.
I know that you don't use time bars because they have too many wide range bars,
but... could the wide range bars v narrow range bars be an edge to ones
analysis? Reason that I ask is because I am still new to volume bars and have
been trying it out and the minute data still seems clearer to me although the CV
bars provide clearer trendlines/channels.
Maybe it's because I am using 512 CV bars for nq for entries and I am not used
to anything this quick in the first place, so a lot of the signals I get shake
me out or are too fast...
Can someone whose successful trading one type of data transition back and forth?
I'd imagine they could, but I want your input on this matter...
Kid,
You must use whatever allows you to read price action best.
If it's time based bars, go for them.
What works for me might not be appropriate for you and vice versa.
Anek
Thanks Anek for the AHG Paintbar(Beta) chart.
How does it look on NQ and ES daily chart?
Thanks
DT
Quote from Anekdoten:
Kid,
You must use whatever allows you to read price action best.
If it's time based bars, go for them.
What works for me might not be appropriate for you and vice versa.
Anek
D,
NQ Daily
Anek
D,
ES Daily
Anek
Thanks Anek. So, the AHG Beta shows NQ daily is continuing its bull trend.
And it is showing that ES is moving between uptrend and downtrend back and forth
in daily chart, with currently in downtrend.
Thanks
DT
Quote from Anekdoten:
NQ Analysis for 11.01.07
Attachment: nq.11.01.07.jpg
This has been downloaded 242 time(s).
Anek
Quote from nkhoi:
in this picture, there was comment about 'magic tick' so I read all 480+ pages to find out but I am still not sure what magic tick is! Is it a dragonfly doji?
Stocks - Daily Charts
Anek,
Have you applied your method to daily stock charts? I was looking at a few and
they really don't seem to move like an intraday futures chart.
You don't really have the swings and the nice formations and the double tops,
etc....(some do, but a lot more don't seem to)
Do you have to go down to hourly or a smaller timeframe charts?
Quote from nkhoi:
in this picture, there was comment about 'magic tick' so I read all 480+ pages to find out but I am still not sure what magic tick is! Is it a dragonfly doji?
Quote from Anekdoten:
N,
..
Credit to Suri Duddella.
Anek
Quote from Anekdoten:
N,
When you see a bar closing above or below S or R stay alert but the signal will come when the bar's high or low is pushed by one tick. This is known as dual confirmation or as I like to call it, the magic tick
Credit to Suri Duddella.
Anek
Re: Stocks - Daily Charts
Quote from macattack:
Anek,
Have you applied your method to daily stock charts? I was looking at a few and they really don't seem to move like an intraday futures chart.
You don't really have the swings and the nice formations and the double tops, etc....(some do, but a lot more don't seem to)
Do you have to go down to hourly or a smaller timeframe charts?
Tell you what, since I've already done a considerable amount of work on this
with my other method, if someone will point me to the page on this journal with
the latest version of the rules, I'll code it and run it through my data mining
software.
I'll report back the results based on my stable of solid performing stocks from
the other method.
Quote from Anekdoten:
N,
When you see a bar closing above or below S or R stay alert but the signal will come when the bar's high or low is pushed by one tick. This is known as dual confirmation or as I like to call it, the magic tick
Credit to Suri Duddella.
Anek
Quote from macattack:
I think the magic tick is:
When a trendline is broken or support or resistance is broken you can enter right away...........or if you want extra confirmation you can wait for the breakout bar to be taken out by 1 tick.......the "magic tick". This is a tip from the great Suri Dudella.
A lot of times you will see a breakout bar and then it will just end up being a dud or a trap. Amateurs will be attracted to it like flies to a cow patty, but not you my friend, you are a professional. You will patiently wait for the "magic tick".
paintbars
Your paintbars look good. Do you have the code for them? I have not had time
to trade futures for awhile since I work most days.
Currently trading forex real money. I may dollar cost down once on a forex trade
if my original stop is not hit. I have never tried dollar costing up. I may want
to one day... Seems a good strategy and obviously what most retail traders don't
do, which is probably why you succeed.
Psychologically, that is hard for me. Also, having more losers than winners
would be also hard for me. Also, adding more contracts to a trade even though I
have been profitable for over a year is very hard.
Currently, I have a 10% edge ie 60% wins 40% losers with losers just slightly
higher dollar amts than winners.
Quote from Anekdoten:
AHG Bars
After quite some time working on price action paintbars I think I'm finally onto something.
Should you have any requests let me know, and I will post your request, as I'm still in the early stages of development and could use a little robustness on the testing.
Attached please find a comparison between AHG Paintbars (Beta) and Heikin Ashi bars below.
Input is appreciated.
Anek
Quote from daniel33:
Anek, Thank you for the charts and for the hard work.
Not long ago you told me you were going to check the 233 tick chart on NQ. What did you think ?
If a trader was a very patient person and wanted to master one setup, which one would it be ?
Thank you mate.
Daniel
A. For what it's worth. This is my current attempt at a synthetic trendline break indicator. Just playing with programming thoughts, not suggesting using indicators. Looks similar to ANEC bars.
ahg
Anek: I am new to trading but reading this thread over a few times has been
enlightening, to say the least. Hope you don't mind a few noobie questions.
For trading ES would u suggest 5000 or 10000 vol?
In a strong uptrend when the retrace is shallow (less than 50% fib) do u
recommend entering on a close and a "magic tick" above the last HH meaning with
a break of former resistance now becoming support?
Let me add my thanks to the hundreds of others who follow your great work.![]()
Re: Stocks - Daily Charts
Quote from macattack:
Anek,
Have you applied your method to daily stock charts? I was looking at a few and they really don't seem to move like an intraday futures chart.
You don't really have the swings and the nice formations and the double tops, etc....(some do, but a lot more don't seem to)
Do you have to go down to hourly or a smaller timeframe charts?
Quote from discrat:
Ha Anek,
Give some good examples of this specific Setup if you get a chance. Thanks a bundle for everything.
Also, Anek what do you think of Stealth Traders 3 Bar reversal set up as it applies to HH,HL LL,LH ?? He mentioned about it many moons ago earlier in this Thread, Thanks !
Re: Re: Stocks - Daily Charts
Quote from johnpinochet:
I'll second this question.
I only traded futures up through this year and then I discovered something interesting that I decided to try on stocks. I was quite surprised to find out that it works just as well if not better in stocks than in my bond futures.
So, with that in mind, does the AHG strategy work in stocks? FWIW, I found my specific bond futures method to work extraordinarily well in the heavily followed stocks, in particular any heavily followed Chinese stock like BIDU or Brazilian stock like RIO. I add the last sentence in the event that someone would like to experiment and start off on a possible right track from the beginning.
TIA,
John
Quote from billp:
A question please. In your experiences what are the chances of success with the 'magic tick' (example any rough % success/loss ratio)? The reason I asked is because support//resistance are usually zones and as for trendlines, they can differ slightly depending on software and the trader. Also, I have seen many times where the magic tick appear but it does not result in a true breakout. Just trying to understand here. Thanks
Re: paintbars
Quote from oraclewizard77:
Your paintbars look good. Do you have the code for them? I have not had time to trade futures for awhile since I work most days.
Psychologically, that is hard for me. Also, having more losers than winners would be also hard for me. Also, adding more contracts to a trade even though I have been profitable for over a year is very hard.
Quote from rverheyen:
I think mastering one setup should be your first goal. But then add another, master it again. Next...
Quote from bmwhendrix:
A. For what it's worth. This is my current attempt at a synthetic trendline break indicator. Just playing with programming thoughts, not suggesting using indicators. Looks similar to ANEC bars.
Re: ahg
Quote from einstein:
For trading ES would u suggest 5000 or 10000 vol?
In a strong uptrend when the retrace is shallow (less than 50% fib) do u recommend entering on a close and a "magic tick" above the last HH meaning with a break of former resistance now becoming support?
You are attacked because you are teaching just about how to do everything
right, for free.
This interferes with ======>
Snake Oil Sponsors. Successful traders that did not have the luxury of someone
to hold their hands in the early stages. Jealousy. Skepticism created by typical
human behavior and selfish traders.
What you are doing here is just plain old rare.
Hopefully no one has placed a reward for your head yet.
VZ
Can anyone recommend charting software that allows my to build volume charts
and paint the bars like Anek does?
So you need Volume Bars and Home Built Indicators (for the paint bars and that
neat pivot h/l indicator).
Thoughts?
B
Anek: Thank you for your prompt reply. Much appreciated. Notwithstanding the core AHG entry (2HH etc), I notice you take many entries on a break of the TL with the so-called "magic tick". Obviously, this is something u can do with your experience before the standard trend is established based on the 2HH, 2LL definition. What do u look at regarding price action which gives you greater confidence entering on a TL break before the pure trend swing points are printed? Thanks.
Official AHG Polls
A) AHG Helps
B) AHG Harms
Three rules.
One vote per user.
Each user must have a minumum of 10 posts.
Each vote should be placed on my journal.
I encourage old timers of ET forums to participate.
Until I have 100 votes total, I will stop posting on my journal to advocate the
voting.
Anek
Anek: I vote A. Altho I haven't posted very much I have read the thread twice thru and have adapted it for trading. It works!
hey anek...it's hard being a nice guy huh?
Keep it up and don't let the haters get to you.
btw...if you're a fake, you're doing a great job too.
so either way, you're good! ![]()
Anek, please don't feed the trolls. It just detracts from the thread. Let people vote by either participating positively in the thread or post elsewhere in ET - there are certainly many other places to spew negativity.
Quote from Anekdoten:
Official AHG Polls
A) AHG Helps
B) AHG Harms
Three rules.
One vote per user.
Each user must have a minumum of 10 posts.
Each vote should be placed on my journal.
I encourage old timers of ET forums to participate.
Until I have 100 votes total, I will stop posting on my journal to advocate the voting.
Anek
__________________
Boib
Its easy to make a small fortune if you start with a big one
Guys,
When the trolls show up please do not respond and please do not
quote them. Either action just gives them the attention they crave, and it makes
my work harder in removing the garbage. Thanks.
Magna
I vote A. Anek, you helped me a lot.
"A" for absolutly!
I agree, why let it get to you? I mean it's obvious that there are a lot of
people here that definitely appreciate your work and what you are doing. Why let
one or two people ruin that? Put them on ignore and continue on
![]()
A
A
i vote A
Anek,
please dont listen to nay sayers. keep postings it help a lot.
would also like to see u r trade entries on chart. if its possible. gives us an
idea what a master trader would do.
A
And I have to say F-that to those that made you feel you had to do this.....
So sad.
A
My vote is obviously "A"
Anyone who posts a "B" can kiss my f*cking ass!
A
A
most helpful thread ever on ET
don't take the trolls seriously , they just want to pull someones chain and get
a reaction
__________________
Lets all drink to the death of a clown.
A = Absolute Appreciation and Accolades.
A+
I very seldom follow threads, the last one that grabbed my attention because of
quality information was Optioncoach's historic home run.
Screw the trolls, you do a great job and I'm amazed at your ability to respond
as promptly and as thoroughly as you usually do.
Thank you.
A+
A
This was the easiest poll I ever took: A
Anek,.. My vote is A
AHG Helps. If possible I would vote 101 times, one more than 100, just like the
magictick confirmation ![]()
DT
Quote from low_hcp_golfer:
My vote is obviously "A"
Anyone who posts a "B" can kiss my f*cking ass!
Quote from pvg80713:
??????????????
scarylarry was being like this and he was deleted ...
I was deleted because I asked if he had a better solution ?
A
A
I vote A+. I think you have a excellent thread and it is helping me.
And, I would like to repeat Magna's request in case anyone missed it.
Quote from Magna:
Guys,
When the trolls show up please do not respond and please do not quote them. Either action just gives them the attention they crave, and it makes my work harder in removing the garbage. Thanks.
Magna
What anekedoten is doing, first and foremost is teaching traders
how to think, everything else must follow along the pathway as laid out by
your mind.
His philosophy is to always follow the path of least resistance in his
trading, and if a trader can adopt such a philosophy in their own life they will
find success in all things coming much more easier.
This concept alone will cut-out years of wasted efforts, in your trading
and pretty much everything else do.
A
Good trading,
JJ
__________________
If at first you don't succeed ...
Quote from JimmyJam:
What anekedoten is doing, first and foremost is teaching traders how to think, everything else must follow along the pathway as laid out by your mind.
His philosophy is to always follow the path of least resistance in his trading, and if a trader can adopt such a philosophy in their own life they will find success in all things coming much more easier.
This concept alone will cut-out years of wasted efforts, in your trading and pretty much everything else do.
A
Good trading,
JJ
hey man keep it up
your thread is great. i have to say i am amazed you have kept it focused for
so long. so many other great threads die because the author decides to respond
to these trolls and the disease spreads. before you know it the author of thread
almost becomes a troll because he is responding emotionally to these idiots!
stay focused on your original idea. i am going to start trading again in a
couple of months and your thread has been a great help. your averaging up
technique is definitely going into my tool box!
Cokes
A
... of course.
The process of elimination is painful. So many dead-ends.
I feel like I've bypassed so much trail and error now.
-Tech
Quote from Anekdoten:
The magic tick is mostly used to confirm entries on patterns. It can be used as reference on trendline breaks but the real gold comes in patterns.
It's purpose is to increase accuracy and avoid a first wave fakeout. Nothing works all the time the sooner one accepts this the more relaxed you will trade.
Anek
A
A
I like reading this journal, you are doing some wonderful work
Anek!![]()
I would like also to say that I thank anek very much........
A ! of course !
A
A, of course. Let's keep this thread rolling. There's always haters from all sorts of camps that spring up...
Thanks
Hi Anek,
I am certain that your generous gift to complete strangers is appreciated by far
more people[myself included] than you will probably ever realize.
A
THANK YOU VERY MUCH!
Best Regards
Johno
A^2
Poll not for Trolls
Thanks for participating, it looks like the Trend is Up (A) and that's good
enough considering I'm a trend follower.
For what it is worth, I did not do this Poll for the Troll, I did it for you
guys.
Eventhough no Troll can lower my confidence in trading it can certainly
interfere with those that are struggling and especially those new to the
journal. Mind starts playing tricks on you and you end up missing a good thing.
If you noticed from the beginning of the journal I made an effort to ignore them
but this time I thought I could get something good out of it by using their own
vile against them to fortify the journal and your confidence in AHG.
Magna's advice is on the money and this is the last time I respond to anyone
bashing for the sake of bashing. Constructive criticism is very much welcome,
I'm an experienced trader, but I'm no guru and make mistakes like everyone else.
To all the thank you(s), you are very welcome.
Time to continue AHG.
Anek
Nothing works all the time Part I
Attached pleased find a W formation after volume exhaustion with a magic tick
that failed miserably. My favorite setup.
Do not let it frustrate you, this stuff happens, you take your moderate stop and
move on as the next great trade perhaps is just around the corner.
Anek
Nothing works all the time Part II
Yep, literally around the corner ![]()
Anek
Hi Anek,
In ES 5000 vol. chart, do you think it is double top in action now?
Thanks
DT
D,
Don't see much on the 5000 now.
Lot of indecision in ES at the moment.
Attached please find a multi day 240 min chart with a quick analysis.
Anek
end of day
I vote A. I like reading this thread, I think its helpful.
Glad you chose to continue.![]()
I will repeat my previous question wrt trading the TL breaks. I noticed that you
often get into this kind of trade after 1LL and 1LH as opposed to 2 swings. Do u
have any criteria u use which helps u decide when to take this kind of trade and
when to avoid it? I apologize if this is dumb trading question.
![]()
Thanks Anek for the ES multiday chart.
Thanks
DT
Quote from Anekdoten:
Nothing works all the time Part I
Attached pleased find a W formation after volume exhaustion with a magic tick that failed miserably. My favorite setup.
Do not let it frustrate you, this stuff happens, you take your moderate stop and move on as the next great trade perhaps is just around the corner.
Anek
Quote from einstein:
Glad you chose to continue.
I will repeat my previous question wrt trading the TL breaks. I noticed that you often get into this kind of trade after 1LL and 1LH as opposed to 2 swings. Do u have any criteria u use which helps u decide when to take this kind of trade and when to avoid it? I apologize if this is dumb trading question.
Quote from macattack:
From what I've read here I would have shorted that on that first red engulfing bar just outside the blue box you drew. The failure of such a beautiful formation had to trap quite a few longs.
Would you agree with that trade, or am I wrong on that one?
Anek
I know my vote doesn't count (A anyway) but just because you don't post doesn't
mean you can't read, love the thread especially the charts very very helpful.
Quote from Trinitytrader:
Anek
I know my vote doesn't count (A anyway) but just because you don't post doesn't mean you can't read, love the thread especially the charts very very helpful.
Hey Anek,
So glad you're back. and to answer your poll.
Huge F@cking A !
I'm telling you for everyone of us that responds there are so many more that
read and read and read. They may not respond due to shyness or still want to
practice on their own
But I can assure you of one thing. You've influenced a lot of people. ( and not
just in terms of dollars and cents)
Quote from Anekdoten:
Official AHG Polls
A) AHG Helps
B) AHG Harms
Three rules.
One vote per user.
Each user must have a minumum of 10 posts.
Each vote should be placed on my journal.
I encourage old timers of ET forums to participate.
Until I have 100 votes total, I will stop posting on my journal to advocate the voting.
Anek

Hello
Hope, the size will make up for the lack of number of posts.
fwiw, never posted on any other thread except this one on ET.
A big A for you
anek
Thanks
sn
A
A. I love this thread.
I vote A.
Great thread as far as I'm concerned.
I am going to have to give it a C because...
Some of my setups are similar and I dont want to be competing for fills....
![]()
A
This thread provides good input for people trying to figure out day trading.
There is so much in here that one can find something of value.
Also, principles are discussed, beyond mere entry and exit points.
As for the attackers... It is like TV - don't like the show then change the
channel. No one twists your arm to follow this thread. Time is too precious. Why
not spend it on constructive pursuits?
Quote from hausse:
A
This thread provides good input for people trying to figure out day trading. There is so much in here that one can find something of value.
Also, principles are discussed, beyond mere entry and exit points.
As for the attackers... It is like TV - don't like the show then change the channel. No one twists your arm to follow this thread. Time is too precious. Why not spend it on constructive pursuits?
Good morning right off the bat...
Anek
No magic tick
Anek
A
AAAAAAAAAAAAAAAAAAAAAAAA
A++
A. "right off the bat" Were you calling that a db?
What an amazing morning. Double top failed so market reacted by helping the
NQ fill the big gap. Has not happened yet but it will.
I don't believe in daily targets and quitting while ahead because I believe in
myself and my discipline ie no good setups no trade, no trend, no trade but the
morning has been optimal and I'm going to load my iPod with some new MP3s and
hit the beach in anticipation of possible chop due to morning big move. Could be
right could be wrong but beach sounds great at this point.
Anek
Quote from bmwhendrix:
A. "right off the bat" Were you calling that a db?
Quote from Anekdoten:
What an amazing morning. Double top failed so market reacted by helping the NQ fill the big gap. Has not happened yet but it will.
I don't believe in daily targets and quitting while ahead because I believe in myself and my discipline ie no good setups no trade, no trend, no trade but the morning has been optimal and I'm going to load my iPod with some new MP3s and hit the beach in anticipation of possible chop due to morning big move. Could be right could be wrong but beach sounds great at this point.
Anek
Hi Anek,
Took the double top and shorted and took painful stop. Magic tick is so powerful
should have checked for it.
Anek,.near the open was it a W formation in NQ you think? For some reason
could'nt see it. Where did you enter near the open?
Thanks
DT
Quote from fearless9:
which beach?
$$$ A $$$
Quote from Anekdoten:
This one, 3 blocks from my house.
Anek
Quote from disciplinetrade:
Hi Anek,
Took the double top and shorted and took painful stop. Magic tick is so powerful should have checked for it.
Anek,.near the open was it a W formation in NQ you think? For some reason could'nt see it. Where did you enter near the open?
Thanks
DT
Thanks Anek for the reply. I appreciate it. Learning from my mistakes.
Yes,will be using a 1 min chart to monitor volume. But was the NQ "W" in the
morning on 1000 vol. chart? Sorry, if I am asking the same W question.
Thanks
DT
Quote from disciplinetrade:
Thanks Anek for the reply. I appreciate it. Learning from my mistakes.
Yes,will be using a 1 min chart to monitor volume. But was the NQ "W" in the morning on 1000 vol. chart? Sorry, if I am asking the same W question.
Thanks
DT
Thanks for the reply Anek.
Thanks
DT
Fear,
Sent PM to avoid personal info exposure.
Anek
This is a AAA thread! So damn the trolls and carry on Anek!
This is my first post after lurking on ET for the past six months =)
I've blown my first 10K stake over 4 months of trading and I'm now trading
paper.Practicing price reading, S/R, spotting chart patterns. Will go live with
my second 10K only upon doubling my 10K paper stake.
Looking at the ES tonight and will post up a chart, please comment. Thanks!
This is what we got with NQ.
A symmetric triangle.
If experienced, play the extremes accordingly, otherwise wait for official
breakout which could take a few days, not necessarily today.
Anek
I am not 100% sure which formations you guys are talking about. I saw a double top formed late Friday when NQ touched 2231 after the close. The DT was firmly rejected as NQ pulled back almost 10 pts from that DT on Friday. This morning's low of 2193 was 1 tic higher than Friday's low of 2192. Looks like a DB to me on the longer term chart. What else am I missing?
Quote from Jaxon:
I am not 100% sure which formations you guys are talking about. I saw a double top formed late Friday when NQ touched 2231 after the close. The DT was firmly rejected as NQ pulled back almost 10 pts from that DT on Friday. This morning's low of 2193 was 1 tic higher than Friday's low of 2192. Looks like a DB to me on the longer term chart. What else am I missing?
Comments please?
First off I would like to thank Anek again for all his time in coming up with
the charts to show us. After my first effort in producing a chart... I realised
it is plenty of work!!!!
ES morning chart 5000v. Got my trades in there with some burning questions. Hope
somebody can share some relevant pointers regarding the questions.
Will do up an ideal trade chart and ask for comments as well hope you all do not
mind.
dt
Re: Comments please?
Quote from doubletrouble:
First off I would like to thank Anek again for all his time in coming up with the charts to show us. After my first effort in producing a chart... I realised it is plenty of work!!!!
ES morning chart 5000v. Got my trades in there with some burning questions. Hope somebody can share some relevant pointers regarding the questions.
Will do up an ideal trade chart and ask for comments as well hope you all do not mind.
dt
ahg
can someone tell me how to post a chart on the thread?
Using AHG I am net +4 this morning and done. Trading ES with 5000v chart and
trying to strictly trade trends the way Anek teaches. What I appreciate the most
so far is actually "seeing" the chart for the first time. Doesn't mean won't get
stopped out many times, but it does promote a feeling of confidence. Will post a
question later. Good luck to everyone on the thread.(not including trolls, of
course.![]()
Inverse H and S looks ok but little more confirmation there.
Trendline looks ok
The following does not look ok:
-If the trend is up
You want in at pullbacks ie Trendline tests, this gives you the biggest risk vs
reward. You could have easily drawn your TL once the 2nd swing low point not
sure why you waited for 3.
-Overtrade
Yes, very much so, be patient, this is not Donkey Kong where you press start and
off you go. Think like a predator. Wait and wait and wait then attack.
- Trendline break
Noise got you. If the trend is up and the trendline breaks by a close + tick,
you must still wait for an additional swing down and then on the next pop up you
short it. Why ? Because a simple TL test/break/noise is good enough to exit the
long but not enough to reverse because the previous uptrend has to be respected.
Hope this helps.
Anek
Re: Re: Comments please?
Quote from apex82:
I have a question, but look at it more as blunt advice.
What is your edge?
When you can answer this and believe in it then you will not need answers.... you mention H&S, trendline break etc.... you need to know your odds of success after taking 3,000 of those trades before coming to conclusions that you took a bad trade.
NQ Symm Action as expected by the extremes it is now at the low point.
Looking for reversal formations around here. No buying unless one solid one
forms and confirms to prevent the purchase of a falling knife.
The point is price is at support, the reversal formation is now missing.
Targets can be APEX and other extreme depending on greed and balls.
Anek
Re: Comments please?
Quote from doubletrouble:
First off I would like to thank Anek again for all his time in coming up with the charts to show us. After my first effort in producing a chart... I realised it is plenty of work!!!!
ES morning chart 5000v. Got my trades in there with some burning questions. Hope somebody can share some relevant pointers regarding the questions.
Will do up an ideal trade chart and ask for comments as well hope you all do not mind.
dt
Re: Re: Comments please?
Quote from kidPWRtrader:
This is just a general observation... I'll let Anek do what he does best, but all of your morning plays to an extent I believe you got lucky. Today was a very trendy day. Many of your plays you didn't wait for confirmation and just took first hit of support/resistance. This provides you a good r/w but in general you will not get the win ratio that you observed early morning.
The afternoon confirmed that. Your last long had absolutely no confirmation. Eventually this will lead to losses. You should have gotten out on the first widerange red bar. The bar that you shorted on was a narrow range bar and hardly something that would start a downtrend. Usually if you want to short/long breakouts wait till you get a wide range bar and the next bar retraces a little into the previous one so that you have confirmation but better r/w.
A. Another w bottom? long at 2201.
Quote from Anekdoten:
Inverse H and S looks ok but little more confirmation there.
Trendline looks ok
The following does not look ok:
-If the trend is up
You want in at pullbacks ie Trendline tests, this gives you the biggest risk vs reward. You could have easily drawn your TL once the 2nd swing low point not sure why you waited for 3.
-Overtrade
Yes, very much so, be patient, this is not Donkey Kong where you press start and off you go. Think like a predator. Wait and wait and wait then attack.
- Trendline break
Noise got you. If the trend is up and the trendline breaks by a close + tick, you must still wait for an additional swing down and then on the next pop up you short it. Why ? Because a simple TL test/break/noise is good enough to exit the long but not enough to reverse because the previous uptrend has to be respected.
Hope this helps.
Anek
bmw,
I dont see it yet.
Anek
W?
bmw,
what chart size and type ?
on 233 I had nothing of value.
Anek
anek
keep up the good work.. I am miles behind you but enjoy your explanations of trades.. thankyou
Now I see one, with magic tick and all.
Anek
Sorry, 1000v. nq, LIttle W, little bounce.
looked more like an inversed h&s to me
yup played as an inverse H & S here too.. so far so good.. exited at prev resistance 2205 area
Please say hello to W ![]() W
W
Anek
Anek,
On bigger timeframe chart, it looks like a double bottom, with mid swing high at
2224.75 and bottom around 2192
DT
Broken resistance 2205 whooohoo nice spike
Told you to say hello ![]()
Anek
ahg
Anek: A continuing problem for me is deciding what to do in the following
scenario: I see what I think is downtrend (2LL/2LH) but when I get my nose away
from the screen it's obvious that it still qualifies as a retracement in a
longer term uptrend (usually a longer 123 pattern where the low point still
hasn't broken the 62% fib of the longer 123)
I realize that the longer term pattern predominates over the shorter term
pattern, but that aside, any tips as how to follow and trade this type of
scenario which occurs repeatedly throughout the day. Thanks for any assistance
you can provide
Anek,
If possible can you please post today's NQ chart with "W"'s marked at end of
day. I appreciate it.
Thanks
DT
NQ 11.05.07
Most of the trades were documented here before the chart so they should come at
no surprise.
The first W had support from the 2500 tick chart multi day trendline
The short was coming off the symmetric triangle that, I think, is still valid on
the 2500 tick chart (multi day) and the plan was to short the resist area and go
long on the support one.
For some reason I did not think the market was ready to come out of the symm
today and looks like I got my wish on that.
The short symm resistance was based on head and shoulders confirmation.
The long symm support was based on W formation confirmation.
Not included because it serves no purpose a minor loss on 1st unit only that
worked like crap because once again I think I'm superman when I'm just a regular
geek.
Anek
Sick - Temp break
Not sure what's up but feeling the years today.
- Molar Pain, cavity probably.
- Neck Pain, too much computing
- Headache due to the above
So I'll be taking a break to get better, probably hit a few doctors.
Oh well, shortcomings of daytrading.
Anek
T,
I usually only reach considerable size when averaging up, therefore the only
time I execute a large order at once is via a stop that is covering or selling
and since they are a stop I got no choice but to go market.
The adds and initial are usually limit/market depending on the formation and the
action.
Limit is obviously better but sometimes you must sacrifice fills for speed.
Taking off now, feel like crap.
Anek
Thanks for the response. I actually deleted my post before you responded because I only noticed after posting that you said you were taking a break. In any event, I appreciate your answer.
__________________
I'm handing you no blarney
Thanks for today's NQ chart Anek.
Take Care
DT
Matey, sounds like typical Stout withdrawals to me......pop yourself a cold
one and cool that temperature off
![]()
Quote from Anekdoten:
Sick - Temp break
Not sure what's up but feeling the years today.
- Molar Pain, cavity probably.
- Neck Pain, too much computing
- Headache due to the above
So I'll be taking a break to get better, probably hit a few doctors.
Oh well, shortcomings of daytrading.
Anek
Anekdoten:
Hope you have a speedy recovery.
As you know, I'm buyer of support areas when the overall trend is up but lately
I have been refining the entry with your methods with good success. I now take
much less heat.
My question to you is this:
If you are trading the ES but you see a reversal formation with confirmation on
the YM or NQ would you still act on the ES eventhough the strong signal is on
other emnis or switch to the emini that actually has the signal???? Thank you
and great work, get better.
ADK
Quote from Anekdoten:
Official AHG Polls
AHG Helps
Anek
I know you don't do equity trades anymore but since your the smartest person I
can ask, do you know when the NYSE changed the rules on stops being executed on
the bid for longs and the ask for shorts? I know the Nasdaq does this but it had
always been my interpretation that the stock had to trade at the price on the
NYSE for the order to execute.
Hope your feel better soon
Quote from Anekdoten:
Fear,
Sent PM to avoid personal info exposure.
Anek
__________________
"TRADE WHAT YOU SEE" - Master Osorico
ImO, to avoid being stuck in a path of FTT thread you need (suggestion only
aimed at 'struggling traders') to start posting probability plays in real-time,
not charts after the fact.
Anek's done a fab job so far explaining the method he uses, so if you understand
the key elements the time to act is NOW. So let's see some real-time charts, not
EOD. That is, for sure, the next step. Don't get stuck in hindsight charts
![]()
Chart + stop + target objective. Compile results and if ROI is positive start
puting real money on the line.
__________________
"TRADE WHAT YOU SEE" - Master Osorico
Personally, I don't know how it will be possible to even post in real time
nor I see the benefits behind it. Daytrading is fast and Anek needs to focus on
his own trades. 10 s late and he could sure miss a big trade. I'm sure it has
happened to everyone. He already showed the correct path and taught us how to
fish. But now you want him to feed you the fish?
No pun intended but I don't see any benefits in calling out trades real time.
Plus he is doing this free of charge.
Quote from Anekdoten:
This one, 3 blocks from my house.
Anek
This is to help some traders that might be having trouble with data.
Whatever realtime data provider you have, you can use opentick.com (if your
charting software suppports it) to download historical data and then you can
merge it with incoming real time data.
The result is free platform, free real time data, and free historical data. It
might not be reliable, but while going sim, it's keeping the costs real real
low.
Thanks to low_hcp_golfer for this tip...
Quote from kidPWRtrader:
This is to help some traders that might be having trouble with data.
Whatever realtime data provider you have, you can use opentick.com (if your charting software suppports it) to download historical data and then you can merge it with incoming real time data.
The result is free platform, free real time data, and free historical data. It might not be reliable, but while going sim, it's keeping the costs real real low.
Thanks to low_hcp_golfer for this tip...
__________________
A Candle Loses Nothing By Lighting Another Candle
I am not really experienced with data providers/software... until very
recently all I did was swing trade equities.
So, I can't really answer your question.
To sim trade, Ninjatrader is completely free, however.
Quote from JtraderK8:
Personally, I don't know how it will be possible to even post in real time nor I see the benefits behind it. Daytrading is fast and Anek needs to focus on his own trades. 10 s late and he could sure miss a big trade. I'm sure it has happened to everyone. He already showed the correct path and taught us how to fish. But now you want him to feed you the fish?
No pun intended but I don't see any benefits in calling out trades real time. Plus he is doing this free of charge.
Quote from JSSPMK:
(suggestion only aimed at 'struggling traders')
__________________
"TRADE WHAT YOU SEE" - Master Osorico
Quote from smilingsynic:
Is that Montevideo, Uruguay? I was there in April 2006 for a week--looks familiar.
I preferred the beaches an hour or so out of town, by the resorts.
Quote from fearless9:
absolutamente correcto SS.
It is indeed Punta del Este, Uruguay. I was not going to mention it, but since you have raised the subject!!
Looks like the foto is taken near playa pinares looking towards the yacht harbour.
Great place to live A, I am very bullish on Uruguay`s future.
We live (off and on) in Buenos Aires (BA) and visit Punta in the summers.
If you want a great New Year, stay at el Hotel Conrad where the south americans come to show off. Great time had by all.
regards
f9
Quote from mark1:
Hey, I've been living 9 months a year in Thailand for the past 5 years. I'm in Italy (my home country)now, but I want to move to BA next year...
Uruguay is probably the best country to live in South America right now, good economy and infrastructures..., pero me gusta la chica Portena
Quote from fearless9:
"gusta la chica Portena" todos!
BA is a great city to live in.
There are so many problems here that they are hardly worth mentioning, so we just get on with living.
Same goes for Brazil, although the NE is hairy.
Uruguay is safe by comparison but a little too quiet for our flavour,
Check it out with A as he is the man on the spot.
I used to do business in Bangkok and have traveled a little through Thailand. Did the elephant caravan out of Chan Mai once.
Great country, people and food. Love them all.
Where is home for you in Italy?
regards
f9
I was reading in BW recently about all the Americans retiring in Costa Rica.
They did mention a few other popular places like BA. I am in New Jersey but will
be moving soon. Haven't really thought about moving out of the US though I have
lived in Asia.
(When I first saw that pic of a beach my thought was Bondi.... guess I was
pretty far off!!! ![]() )
)
Quote from Jaxon:
I was reading in BW recently about all the Americans retiring in Costa Rica. They did mention a few other popular places like BA. I am in New Jersey but will be moving soon. Haven't really thought about moving out of the US though I have lived in Asia.
(When I first saw that pic of a beach my thought was Bondi.... guess I was pretty far off!!!
Quote from mark1:
My home is in Bologna but I'm often in Modena (my mother's home = best food ever
Ahh Chiang Mai, that's my base when in Thailand, with frequent trips to BKK for nightlife and Samui for beach bumming
Yup BA, big problems, great city though.
I've been a cosmopolitan all my life. Have visited almost every country
except maybe those with constant turmoil.
Lived many years in the states, still have a residence in Florida, one in the
Caribbean and recently sold one in London.
Punta del Este is different and eccentric.
Off summer it is the most peaceful small town you can imagine. The quality of
life for raising children is top notch.
However, during summer time it is possibly the most exclusive place to be in
South America, population grows from 20k to 300k and it becomes a party town of
the rich between say end of dec. to beg of feb. A little too much for me so
during those times I visit the lower States, Europe or the Caribbean. Lucky for
me kids start classes in March and are off in July/Jan/Feb.
Anek
Quote from fearless9:
There is no infrastructure in the CR.
Panamà is better but grossly overpriced at the moment.
regards
f9
Quote from Anekdoten:
Punta del Este is different and eccentric.
Off summer it is the most peaceful small town you can imagine. The quality of life for raising children is top notch.
Anek
We talked about live calls right?
Shorted hoping for a fade during market open. Got stopped out, in again. Tight
stop at breakeven...
Update... out for small profit. Saw the trendline touch and on the smaller time
frame charts some strength.
EDIT: long again on the downtrendline break
Out for small loss.
Quote from fearless9:
Which internet provider do you use A.
Here in BA, I use fibertel and it is very solid.
regards
f9
Live call? long at 2222, on 1000v nq. poss w with trend dir. Close stop. Perhaps Anek will offer comments on trades as a further step in teaching, such as "Why the heck did you do that?"
Quote from bmwhendrix:
Live call? long at 2222, on 1000v nq. poss w with trend dir. Close stop. Perhaps Anek will offer comments on trades as a further step in teaching, such as "Why the heck did you do that?"
as of 10:15 I still don't see confirmation of a trend =NQ
No trades here yet
Quote from Anekdoten:
Fear,
T1 via Movistar and ADSL from Anteldata for backup.
Anek
Quote from mark1:
as of 10:15 I still don't see confirmation of a trend =NQ
No trades here yet
__________________
If at first you don't succeed ...
Short possibility of intraday swing.
Anek
Quote from JimmyJam:
Yeah, he's right.
After yesterday's strong down/up trend moves, this market has been chop soup.
Maybe the retrace in the NQ will give an opportunity to short, but the afternoon session may prove to be better fare.
Good trading,
JJ
I seriously must be retarded... here we go again. Can't figure out how to
attach image. Sorry guys, will have to look at the word file...
I wish I didn't bank profits so fast. The bar wasn't that strong and the
potential for the downmove was huge. O well, you live, you learn.
short from 2216 on failure of first trade, reversed on bo to lower low
Quote from kidPWRtrader:
I seriously must be retarded... here we go again. Can't figure out how to attach image. Sorry guys, will have to look at the word file...
I wish I didn't bank profits so fast. The bar wasn't that strong and the potential for the downmove was huge. O well, you live, you learn.
Reentered short.
Low... lol I know man. I just can't do it. I seem to be attachment inept.
EDIT: and this time I wasn't pussy and am still short. The short was entered at
2211.75
Out at 2203.5.
Lol, I guess I didn't learn. Here it is running without me again.
Reentered 2202.25, out 2204.25.
Short 2204.25. Should have waited for more confirmation (break of flag) but
still looks like its working...
Stopped out at 2206.75.
Quote from kidPWRtrader:
Reentered short.
The short was entered at 2211.75
Out at 2203.5.
Lol, I guess I didn't learn. Here it is running without me again.
rev, now long on W.
Patience and trend, my 2 best friends.
My morning results, now going to hit the kitchen for a deserved slice of pizza
![]()
I did'nt use the trend lines in real time but here you can see why I laugh at
people who say they are useless.
Useless my @ss !
Quote from low_hcp_golfer:
LOL still a nice trade kid. fwiw, i bailed at the same price....i get an itchy trigger finger when i see 10 points profit!
Quote from mark1:
Patience and trend, my 2 best friends.
My morning results, now going to hit the kitchen for a deserved slice of pizza
I did'nt use the trend lines in real time but here you can see why I laugh at people who say they are useless.
Useless my @ss !
Quote from kidPWRtrader:
Thanks you too.
What do you think right now, bear flag?
A. must be under the weather today. I find that I do better waiting for those 3-5 setups, when I disconnect my mouse and put it in the freezer. Nice to see some dialogue on setups and trades. Thanks all.
Quote from low_hcp_golfer:
Kind of in hindsight now...
but once that TL was broken to the upside I became neutral.
I'm trying to be patient and wait for those 3-5 setups per day that Anek has noted.
Quote from bmwhendrix:
rev, now long on W.
Re: AHG - Profitable Strategy for Struggling Traders
Quote from Anekdoten:
...STEP 6 CHART TYPES
Longbars are evil, therefore I highly recommend tick/share charts so you can split that data and examine it with care...
__________________
I'm handing you no blarney
Short...
I waited for the tl to break before entry, however it has not gone far, out of it now.
Quote from kidPWRtrader:
Very nice trading.
Quote from mark1:
Thanks
Someone asked me why I exited at 2200 area.
Round number, always keep your eyes on these areas 2000-2100-2200 etc.
The mkt is made of people and people keep track of these numbers
I've been tradin Ym for a few years just using round numbers, they are usually good for a 5-10 points scalp 13500-13550-13600...
Quote from kidPWRtrader:
Lol, I guess I didn't learn. Here it is running without me again.
Reentered 2202.25, out 2204.25.
Short 2204.25. Should have waited for more confirmation (break of flag) but still looks like its working...
Stopped out at 2206.75.
Another easy day.
Easy short based on double top with complete confirmation.
Easy long based on W formation with complete confirmation.
The short I got good.
The long I missed due to dentist appointment and he kicked my butt.
Attached 610 tick chart for ref but the long at zoom in level say 233 had a W
formation reversal.
Would love to keep the money rolling but I'm not fit to daytrade as I'm drugged
in pain and in a punch walls kind of mood. Not sure what's worse Dentist
appointment or prostate check, tough choice.
Anek
Re: Re: AHG - Profitable Strategy for Struggling Traders
Quote from Thunderdog:
This is an excerpt from your post on the first page of this thread. Could you please expand on this point?
Quote from low_hcp_golfer:
LOL still a nice trade kid. fwiw, i bailed at the same price....i get an itchy trigger finger when i see 10 points profit!
The long still has mojo if you riding it, no reason to exit yet.
Anek
Swing low, the bull is gone for now.
Time for pain medicine.
Anek
Quote from Anekdoten:
If you get itchy fingers in +10 when will ever get +20 +30 ?
You get out when price action says so at least if you want to do AHG
Now if you are content with +10 that's one thing but I prefer to get out when price says so not when my mind or heart thinks so.
Anek
Re: Re: Re: AHG - Profitable Strategy for Struggling Traders
Quote from Anekdoten:
Thunder,
A whole lot of things can happen in say a 1 minute bar, especially if the bar happens to be very long.
When using tick or volume bars especially a small size you can dissect this info and draw patterns of support and resistance compared to the longbar where I just have open close high and low. That to me is little info, I need more, I need to see what happened inside that bar. Which were the points of interest, the points of buying, selling, where the real pressure occurred. The more info the better.
In the end, it's a matter of choice. Nevertheless, I'm a much better trader when using tick/volume charts so if you cannot see the advantage I guess there really is no reason to switch. To me it's the difference between night and day.
Hope it helps.
Anek
__________________
I'm handing you no blarney
Re: Re: Re: Re: AHG - Profitable Strategy for Struggling Traders
Quote from Thunderdog:
I understand your point. Out of curiosity, have you ever considered a sub-one-minute chart, say, a 15- or 30-second chart? Would that not also provide more info than a 1-minute chart? Of course, I'm not asking that you change your approach. (Why fix something that ain't broke?) Rather, I'm just trying to better understand your preference for an activity interval chart as compared to a time interval chart.
__________________
If at first you don't succeed ...
Re: ahg
Quote from einstein:
Anek: A continuing problem for me is deciding what to do in the following scenario: I see what I think is downtrend (2LL/2LH) but when I get my nose away from the screen it's obvious that it still qualifies as a retracement in a longer term uptrend (usually a longer 123 pattern where the low point still hasn't broken the 62% fib of the longer 123)
I realize that the longer term pattern predominates over the shorter term pattern, but that aside, any tips as how to follow and trade this type of scenario which occurs repeatedly throughout the day. Thanks for any assistance you can provide
__________________
A Candle Loses Nothing By Lighting Another Candle
Re: Re: Re: Re: Re: AHG - Profitable Strategy for Struggling Traders
Quote from Anekdoten:
T,
I have unfortunately my charting software of choice does not have them, it has been a request for so long by many TS users.
15 sec would be very nice
Anek
__________________
If at first you don't succeed ...
Hi
Not to go out of context, but its interesting to see Oil and gold making all
time records. Oil getting close to $100 and Gold close to $850 all time high.
DT
Re: Re: Re: Re: Re: Re: AHG - Profitable Strategy for Struggling Traders
Quote from JimmyJam:
I personally don't find them to be very useful, but here you go.
Good trading,
JJ
Re: Re: ahg
Quote from osho67:
Has there been any comments to the above observation. I get trapped all the time.
__________________
If at first you don't succeed ...
Re: Re: ahg
Quote from osho67:
Has there been any comments to the above observation. I get trapped all the time.
Back to 2222.50 we go ![]()
EDIT: Make that 2221.50 ![]()
Anchor Chart
As reference, notice how the TL of the anchor chart was never broken.
Managed to scalp a few longs based on this but nothing out of the ordinary.
Anek
Oops, missed the chart, think Kid's syndrome is contagious
![]()
Anek
JJ
d) review the charts every weekend for at least oh, 10 hours, and preferably, 20
hours for the entire weekend.
This is too much to do. Where is the KISS principle?
__________________
A Candle Loses Nothing By Lighting Another Candle
Osho,
You can keep it simple, but the dedication and hard work will never fade.
Anek
Re: Re: Re: Re: Re: AHG - Profitable Strategy for Struggling Traders
I just want to say this thread continually gets better and better. I'm in my
comp sci class but this is a little more interesting...
![]() .
.
I have been looking for extra confirmation as well.
Is it easier to start with time and sales, a sister index, market profile,
tick/trin, etc.
Or is it just experiment and see what you like best? That seems to be what Jimmy
is saying...
Also, any comments to my pivot points question?
Quote from Anekdoten:
Oops, missed the chart, think Kid's syndrome is contagious
Anek
__________________
A Candle Loses Nothing By Lighting Another Candle
NQ's multi day chart is showing a higher high followed by a higher low and
the next move is key in the direction of tech.
If the next move ends up being a higher high we got an uptrend and we enter a
buy the pullback mode.
Notice, this is on the BIG charts.
Anek
Quote from osho67:
What time frame volume bar is the chart based on. I donot get so many bars
Bigger Chart
Anek
Quote from Anekdoten:
Osho,
You can see it on the upper left hand corner, is 610 ticks.
Anek
__________________
A Candle Loses Nothing By Lighting Another Candle
Quote from osho67:
JJ
d) review the charts every weekend for at least oh, 10 hours, and preferably, 20 hours for the entire weekend.
This is too much to do. Where is the KISS principle?
__________________
If at first you don't succeed ...
Quote from rverheyen:
Took those same trades kid...
Quote from Anekdoten:
Another easy day.
Easy short based on double top with complete confirmation.
Easy long based on W formation with complete confirmation.
The short I got good.
The long I missed due to dentist appointment and he kicked my butt.
Attached 610 tick chart for ref but the long at zoom in level say 233 had a W formation reversal.
Would love to keep the money rolling but I'm not fit to daytrade as I'm drugged in pain and in a punch walls kind of mood. Not sure what's worse Dentist appointment or prostate check, tough choice.
Anek
Quote from kidPWRtrader:
Isn't the small W counter trend completely? We had a pretty powerful down trend so the risk to reward (even though the W semi worked) was still on the short side, no?
Any reason why you referenced the tick chart vs. volume?
Quote from Anekdoten:
Oops, missed the chart, think Kid's syndrome is contagious
Anek
The NQ is currently more bullish than Ron Jeremy on 3 Viagras.
Anek
JJ
I am losing my heart. I will never be able to get this expertise
Note:
(1) There is no future perse (at least looking at experience from this level of
conciousness), there is always the present. As you change your conciousness and
develop the ability to perceive trades as they are setting up in the present you
will trade more and more effortlessly.
__________________
A Candle Loses Nothing By Lighting Another Candle
Quote from kidPWRtrader:
Looking back at it, the first trade is still valid but the second one... the down candle wasn't really strong at all. And we had made a higher high already so it was already suspect whether we would get another powerful leg down as before.
Quote from osho67:
JJ
I am losing my heart. I will never be able to get this expertise
Hey Anek,
How about a shot of your NQ trades this afternoon? I would love to compare
notes.
I have increased my profit margins 2 fold almost daily since I started reading
this thread. (except chop days) Plus $560 today trading AHG.
Thanks
J
Quote from Anekdoten:
What is your screen time experience like ?
I logged tens of thousands of hours to reach profitability.
Considering I'm not so bright say you require half of that.
Have you reached that point ?
Anek
Re: ahg
Quote from einstein:
can someone tell me how to post a chart on the thread?
Using AHG I am net +4 this morning and done. Trading ES with 5000v chart and trying to strictly trade trends the way Anek teaches. What I appreciate the most so far is actually "seeing" the chart for the first time. Doesn't mean won't get stopped out many times, but it does promote a feeling of confidence. Will post a question later. Good luck to everyone on the thread.(not including trolls, of course.
Quote from osho67:
JJ
d) review the charts every weekend for at least oh, 10 hours, and preferably, 20 hours for the entire weekend.
This is too much to do. Where is the KISS principle?
__________________
"TRADE WHAT YOU SEE" - Master Osorico
Re: Re: Re: Re: Re: AHG - Profitable Strategy for Struggling Traders
Quote from JimmyJam:
If you really are "trying to better understand Aneke's preference for an activity interval chart as compared to a time interval chart":
a) give this thread a good read over
Volume, Range and Tick Charts
b) setup the charts according to the parameters that Prof Logic gives very early in the thread.
c) watch the price action during RTH every day for a period of no less than 3 months
d) review the charts every weekend for at least oh, 10 hours, and preferably, 20 hours for the entire weekend.
At some point, you will begin to remember every trade that setup for the previous week and what its outcome was. When you see that same setup again, you will take that trade ... and it will fail.
You will then continue to take that trade for the next 100 setups, and depending on how good you've done your homework/how perceptive you are/how talented you are/ anywhere from 70 to 80+ of those trades will be profitable.
Good trading,
Jimmy Jam
P.S. That message isn't so much posted to Thunderdog as it is to all the followers who say they want to learn how to trade ... at this point, the knowledge is all there.
__________________
I'm handing you no blarney
Hey Anek!
My First REAL day EVER trading Futures. After reading this journal, I thought I
would give them try. +$100!
Thanks for the great coaching!
Quote from fishoilfan:
Hey Anek!
My First REAL day EVER trading Futures. After reading this journal, I thought I would give them try. +$100!
Thanks for the great coaching!
(Thunderdog, don't take offense)
P.S. That message isn't so much posted to Thunderdog as it is to all the followers who say they want to learn how to trade ... at this point, the knowledge is all there.
Re: Re: Re: Re: Re: Re: AHG - Profitable Strategy for Struggling Traders
Quote from Thunderdog:
JJ,
Please don't assume that I don't know how to trade. I am not in the market to learn anyone's system or method in its entirety. I have my own. However, that does not preclude my interest in the rationale behind certain choices on the part of others. Such insights can occasionally improve my own method. Therefore, when I ask a question, please try not to read more into it than what I asked. You have already done this before. Please don't do it again. Thank you.
Thank you for the stouts, you know who you are.
Problem is, now the ET police will think I'm a snake oil salesman and that I
take payments via alcohol to disguise the oil.
Grazie amico
Anek
Re: Re: Re: Re: Re: Re: Re: AHG - Profitable Strategy for Struggling Traders
Quote from Anekdoten:
T,
Assuming your method is not based on the secret "cold fusion" formula could you please talk a bit about your methodology ?
I would also like to enhance my trading
Anek
__________________
I'm handing you no blarney
Re: Re: Re: Re: Re: Re: Re: Re: AHG - Profitable Strategy for Struggling Traders
Quote from Thunderdog:
Well, judging by your performance, I doubt that there is anything you can learn from me that you don't already know (and then some). My method is somewhat more systematic and, therefore, less dynamic than yours. I prefer not to go into specifics but, in broad brush terms, I go long on higher lows and I go short on lower highs. The "cold fusion" part (abbreviated as "confusion") is in the specific entry and confirmation criteria.
a little bit of trading knowledge i've learned, take your profit before they
take it away from you ![]()
cheers
Are you moving to 233tick charts?
Hi Anek,
Are you moving to 233 tick charts from 1000 volume charts for NQ? What kind of
advantage/disadvantage did you notice one has over the other?
Thanks
DT
Quote from Rtrader2525:
a little bit of trading knowledge i've learned, take your profit before they take it away from you
cheers
Time for enhancements from the community
We have a winning methodology in the journal. Topics like getting an edge by
trading with the trend, using sound money management, requiring solid discipline
and protecting capital are all covered here.
It's time to enhance AHG, nothing is perfect, AHG certainly is not therefore I
welcome experienced traders to present any possible ideas that could be positive
for the system and the readers.
Why ? Because there is always room for improvement and I think the journal needs
new ideas that can be explored.
Heck, I could use a little homework as I'm always talking about the same thing.
Thanks in advance to any contributors.
Anek
Re: Are you moving to 233tick charts?
Quote from disciplinetrade:
Hi Anek,
Are you moving to 233 tick charts from 1000 volume charts for NQ? What kind of advantage/disadvantage did you notice one has over the other?
Thanks
DT
A. I am not one of the "experienced" traders, but I would like to throw this
out for comments. I have noticed (wow! I must be the first!) that taking the
third hit on a trendline that follows the bottom of an uptrending channel
(opposite for sells) often catches the entries that would otherwise be caught by
reversal patterns. This simplified entry seems to catch a lot of beginning
trends. Of course the third hit is the same as the 2nd higher low as you
advocate establishing a trend. Just something that might help someone.
D.
NQ Analysis for 11.06.07
Not much to say that is not already on the daily comments or the chart itself.
Kind of a part time day for me due to appointments.
Special Note: Between 12:55 and 14:00 you can see a very extended upside move.
This is probably why that middle swing got taken. I'm referring to the spook
area. Worth noticing that when the move is over extended an out of the ordinary
retracement is possible. Noticing this after the fact.
Anek
Quote from bmwhendrix:
A. I am not one of the "experienced" traders, but I would like to throw this out for comments. I have noticed (wow! I must be the first!) that taking the third hit on a trendline that follows the bottom of an uptrending channel (opposite for sells) often catches the entries that would otherwise be caught by reversal patterns. This simplified entry seems to catch a lot of beginning trends. Of course the third hit is the same as the 2nd higher low as you advocate establishing a trend. Just something that might help someone.
D.
A. Watch out for the pain killers and stouts.....can become a lifestyle. Attached is your chart from today with a couple of 3rd point hits.
You watch out, no chart ![]()
Anek
A. Watch out for the painkillers and stouts.........can become a lifestyle
![]() Attached is your chart from today
with a couple of 3rd pt. hits.
Attached is your chart from today
with a couple of 3rd pt. hits.
B,
Are you saying that if that third hit does not work a reversal pattern forms?
Thanks
Anek
I didn't mean to if I did. it seems that often, say in a down trend, the
trend may be so strong that the price never makes it back to the trendline, if
the 3rd hit is all you played you would miss those. However, there is a reverse
3 pt hit that does signal a reversal. That is when at the 3 rd point, the price
breaks the trendline and pulls back to make the "hit" from the other side, which
seems to be a playable reversal pattern, often part of the generally accepted
patterns. FWIW.
D.
Three 3 pt hit reversals in a row.
B,
Interesting, I will start paying attention to this.
I'm so out of it, I had to instant message a friend in Yahoo so he could explain
to me what you were saying.
If this proves to be fruitful you will get credit for the first AHG enhancement
![]()
Anek
Quote from Anekdoten:
Sounds great but scares me when a newcomer makes money the first day. Something that can be counterproductive because it can develop overconfidence something that can be extremely dangerous. Even at my level I still get reminded that the market holds my balls in a pedestal.
Remember, a choppy day will take your money, today was optimal for trading, nevertheless I congratulate you on your winnings and wish you the best in your journey.
Last but not least make sure your car size remains at 1 until you see consistent profitability.
Anek
Quote from Anekdoten:
Time for enhancements from the community
We have a winning methodology in the journal. Topics like getting an edge by trading with the trend, using sound money management, requiring solid discipline and protecting capital are all covered here.
It's time to enhance AHG, nothing is perfect, AHG certainly is not therefore I welcome experienced traders to present any possible ideas that could be positive for the system and the readers.
Why ? Because there is always room for improvement and I think the journal needs new ideas that can be explored.
Heck, I could use a little homework as I'm always talking about the same thing.
Thanks in advance to any contributors.
Anek
__________________
I'm handing you no blarney
Quote from Thunderdog:
OK, here's a thought. Does anyone here look for confirmation or comfort in another index to support a setup or signal in the index you are trading?
Quote from Thunderdog:
OK, here's a thought. Does anyone here look for confirmation or comfort in another index to support a setup or signal in the index you are trading?
"financials"....and these are?
(please excuse my astounding ignorance!)
__________________
too soon old, too late smart
Goldman Sachs, Lehman, Merrill...These are top names
GS, LEH, MER....this is what i can recall on top of my head. Correct if wrong
Ian,
GS, MER, XLF, $BKX, C, etc.
Anek
Yes ppl look at financials for tells.
$BKX ==> ES
$HGX ==> ER2
Quote from Anekdoten:
Ian,
GS, MER, XLF, $BKX, C, etc.
Anek
Quote from IanMacQuaide:
"financials"....and these are?
(please excuse my astounding ignorance!)
__________________
JDConner
Hi All
Regarding the 3 hit which was mentioned earlier. I knew an old time trader which
used to trade touches of the 34EMA. he always claimed that the 3rd touch of the
ema most of the time failed but, he said that if the 3rd touch of the ema worked
then it was very common for the 4th one to work as well.
Question, can anyone point me to the Zig Zag ELD page number on this thread or
maybe someone can post the ELD pretty please with sugar on top.
and again props to Anek and the rest fo the gang for the greatest thread period
, keep up the hard work it is amazing.
BB
Yes... pullbacks and bounces are the only things I trade in equities.
Here are the setups for stocks for tomorrow.
Got in on FHC on monday... missed ANO today and some other really good plays
because I put in the limits too cheap and didn't recognize how bullish the daq
was.
Re: Re: Re: Re: Re: Re: AHG - Profitable Strategy for Struggling Traders
Quote from Thunderdog:
JJ,
Please don't assume that I don't know how to trade. I am not in the market to learn anyone's system or method in its entirety. I have my own. However, that does not preclude my interest in the rationale behind certain choices on the part of others. Such insights can occasionally improve my own method. Therefore, when I ask a question, please try not to read more into it than what I asked. You have already done this before. Please don't do it again. Thank you.
__________________
If at first you don't succeed ...
... this little diddy right here.
Quote from Thunderdog:
OK, here's a thought. Does anyone here look for confirmation or comfort in another index to support a setup or signal in the index you are trading?
__________________
If at first you don't succeed ...
Quote from JtraderK8:
Hey Anek,
How about a shot of your NQ trades this afternoon? I would love to compare notes.
Quote from Anekdoten:
What is your screen time experience like ?
I logged tens of thousands of hours to reach profitability.
Considering I'm not so bright say you require half of that.
Have you reached that point ?
Anek
__________________
A Candle Loses Nothing By Lighting Another Candle
Quote from JSSPMK:
When I used to do wrestling I remember there was this guy who had perfected one specific type of throw, he would do it whilst on his knees, standing up, he could even do it whilst on his arse. I also remember how frustrated other wrestlers used to get with that fella, they knew his strong point (that 1 throw), though failed to see it coming, he was just damn excellent at it, robotic.
I also remember him in training, he would work & work & work on that 1 throw for 2-3 hours per training session minimum.
Do not mix commitment with complexity ImO.
Jim was right and Anek of course is right you need hundreds and hundreds of both real-time & EOD chart analyses to get to a stage when pattern recognition of just 1 pattern becomes almost automated.
__________________
A Candle Loses Nothing By Lighting Another Candle
i thought this thread had gone by the wayside. good to see it still up and
running...good job, anek. nice thread.
![]()
Quote from Anekdoten:
Time for enhancements from the community
We have a winning methodology in the journal. Topics like getting an edge by trading with the trend, using sound money management, requiring solid discipline and protecting capital are all covered here.
It's time to enhance AHG, nothing is perfect, AHG certainly is not therefore I welcome experienced traders to present any possible ideas that could be positive for the system and the readers.
Why ? Because there is always room for improvement and I think the journal needs new ideas that can be explored.
Heck, I could use a little homework as I'm always talking about the same thing.
Thanks in advance to any contributors.
Anek
Re: Re: Re: Re: Re: Re: Re: AHG - Profitable Strategy for Struggling Traders
Quote from JimmyJam:
...I'll be sure to "not to ready too much into your posts" in the future, however, you do ask the most interesting questions, and they do represent good starting off points for more discussion about the intricacies of trading the e-mini financials...
__________________
I'm handing you no blarney
Coffee and music, have a good week all.
![]()
http://www.youtube.com/watch?v=vQu91gvb0CY
NQ LOD = Multi Day TL test
That's where the double bottom formed.
Anek
Quote from version77:
I'm pretty sure TradeStation has a function where it will actually
plot out your entries you took that day right on the chart.
TL Test Part II
Little different now.
Anek
Anek,
regarding TL test 2 , its also a W formation on the 1000V chart
but i do see the issue with a lower high !
edit: on multiday chart also a triangle forming as well.
Bugs,
This is the multiple confirmations i speak of.
I prefer confluence.
Anek
Dang I was able to squeeze only 4 points from the tank from the HOD, no real
pullback to short.
I have a quadruple bottom on my 1000 v chart now..wheew
anek,
please explain "I prefer confluence"
Anek, considering DB around 2213? I know it is from lower high bouncing the
big uptrendline from multiday charts.
Thanks
DT
D,
If you get the confirmation make sure you are aware of the next resistance
level.
That lower high in multi day worries me a bit.
Anek
Check ES...
Anek
Thanks Anek. Looks like no confirmation with a close above the DB mid high
and also no magic tick yet. Appears not much directional conviction here.
Thanks
DT
Don't forget I like them after exhaustion
ie LOD
Anek
Quote from osho67:
Thanks so much for your encouraging post
Unfortunately I am 77 and I havnt got all the time so I am trying to rush to make some money.
John,
Perhaps he is in a rush to increase his fortune to leave a larger inheritance.
Just a thought.
Anek
Interesting - I've been using the word 'convergence'. I enjoy seeing multiple signals converge - each adds to the strength / conviction of the move.
Quote from Anekdoten:
This is the multiple confirmations i speak of.
I prefer confluence.
Quote from Anekdoten:
TL Test Part II
Little different now.
Anek
Quote from fishoilfan:
This looks like it wants to break the trendline with the lower lows increasing? I'm a rookiw though so don't go by my call...
3 trades on the ES so far today-2 winners and 1 loser=plus 12.50 minus commission
Quote from bugsbunny:
anek,
please explain "I prefer confluence"
H&S on 5 Min NQ?
Quote from fishoilfan:
I mean lower highs...
Anek:
Extraordinary price action reading skills.
You even know when your preferred pattern will not work, that is twisted my
friend.
Gracias
ADK
NQ Confirmed Double Bottom formation at the lows entered at 2212.50
Anek
No good out of that.
Anek
Anek , figured you would have shorted on touch of multi day TL . but I guess that would conflict with daily and multi day DB
__________________
Lets all drink to the death of a clown.
Quote from Anekdoten:
NQ Confirmed Double Bottom formation at the lows entered at 2212.50
Anek
Quote from walter1986:
I identified the same entry point - where was your stop?
Another Dentist appointment ![]()
Need to close the day.
One solid win
Two small losses
Light trading due to health
Anek
PS: CSCO Tonight
Quote from Anekdoten:
Another Dentist appointment
Need to close the day.
One solid win
Two small losses
Light trading due to health
Anek
PS: CSCO Tonight
I am a rookie (paper trading for 5 months). I thought I would add something
that I have seen many times and I don't think it has been specifically addressed
in this thread. I think these may be common knowledge, but I wanted to post a
chart of todays action to show what I mean.
It has to do with breakouts of M tops, W bottoms, and trendline breaks. I
noticed that after the break of a trendline or the middle swing high of a W
bottom or the middle swing low of a M top, price more often than not comes back
to retest that trendline or swing.
I mention this because it could be a better risk/reward trade if this retest is
taken instead of the initial breakout and/or if you miss the initial breakout,
you can get in on the retrace. This should go along with AHG. I am not saying
you will neccessarily get a better reward, but the risk is lower IMO because you
can have a tighter stop.
Here is a chart of today's action.
ES broker major support of 1496 today
Anek,
ES broker major support of 1496 today. What do you think about ES multiday
chart?
Thanks
DT
Heres my contribution
All you AHGolics can use this shortcut.
unzip it
Save on desktop or press ctrl and drag to start menu or quicklaunch
The shortcut will take you to the last page of AHG
BB
As a newbie, I thought I'd speak on behalf of over-trading.
Even though the AHG concept is simple in its roots, there opens up many
potential trades throughout the day for me.
Especially since I'm still trying to discriminate between the good and
not-so-good signals.
What's been keeping my trades down is focusing on particular patterns only.
Right now I am concentrating only on trend breaks.
At the end of the day my trades are few, and I'm really educating myself about
trend breaks.
This allows me to focus, which, as a newbie, can be somewhat difficult with all
this candy before me.
I think this was mentioned before, but I needed to voice it for other newbies.
-Tech
Quote from Anekdoten:
I believe I already addressed this with you in the past.
Just in case you forgot, this thread is not about me but about helping traders.
On top of that, I enjoy a bit of privacy when it comes to financial matters.
Anek
Quote from Techdoodle:
As a newbie, I thought I'd speak on behalf of over-trading.
Even though the AHG concept is simple in its roots, there opens up many potential trades throughout the day for me.
Especially since I'm still trying to discriminate between the good and not-so-good signals.
What's been keeping my trades down is focusing on particular patterns only.
Right now I am concentrating only on trend breaks.
At the end of the day my trades are few, and I'm really educating myself about trend breaks.
This allows me to focus, which, as a newbie, can be somewhat difficult with all this candy before me.
I think this was mentioned before, but I needed to voice it for other newbies.
-Tech
Quote from Anekdoten:
John,
Perhaps he is in a rush to increase his fortune to leave a larger inheritance.
Just a thought.
Anek
Losing Day
Today I was not in sync with the market and had a modest losing day.
It happens, had trouble reading price action.
This damn dental problem is also getting in the way of peaceful trading so I'm
considering taking this losing day as sign of "take a break and get your health
in order before touching the trading platforms."
Not a serious loss, I would not allow such a thing, but I think getting my
health in order is a priority.
Sorry, there will be no chart for today, as there is nothing I can teach from my
trades today.
Anek
Thanks Mark,
I'm just now figuring this out. ![]()
Everything is now becoming more solid in my learning.
Seems so logical now, but it is funny how something can be right under your nose
and still not see it.
Anyway, this is a breakthrough in my learning process.
-Tech
Quote from mark1:
Let me tell you , this is one big step.
One reason most wannabe traders fail?
They are attracted by the idea of freedom in trading, without realizing that the same concept of freedom is what makes them bad traders.
The mkt has no rules, no boundaries, no real structure, that's why a great deal of discipline and YOUR OWN rules are strictly necessary.
Focusing and mastering only one pattern is the first step toward discipline and good rules = good, consistent trading.
How many traders jump from rule to rule, system to system, pattern to pattern etc.
90%
Anek, I thought this thread was closed. Glad to see it back up.
Anek, unlike other who want to know about strategy I would like to know how
quickly could you do 100% return
I am not asking you what you personally are able to do
I am wondering what is possible out there 6 moths or 10 months 100% return etc
Could you spare a comment on it ![]()
Quote from pricetrdr:
Anek, unlike other who want to know about strategy I would like to know how quickly could you do 100% return
I am not asking you what you personally are able to do
I am wondering what is possible out there 6 moths or 10 months 100% return etc
Could you spare a comment on it
A. Here is a 20/20 hindsight of 3rd trendline hit trades, of course with the benefit of doing it after the fact. Just posting for comments and discussion.
B,
Thank you for the chart.
Anek
All times are GMT. The time now is 02:56 AM.