by Howard Arrington A WoodieCCI template can be downloaded from the Ensign web site using the Internet Services form in Ensign Windows. The WoodieCCI template dresses a chart with the following indicators.
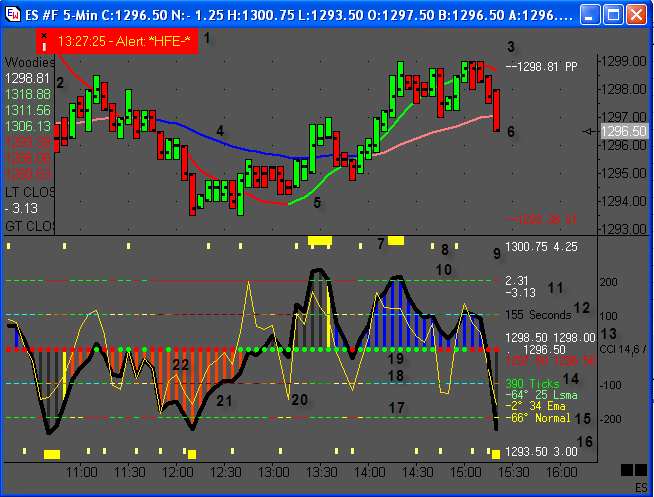
The template includes the following pieces of information. See the corresponding number labels on the chart.
Explanation: Ken Wood (aka 'Woodie') typically does not show the bar chart portion. Instead he watches just the CCI study which is a sub-window in our presentation. However, some of the values being referenced are better shown on the bar chart, so for the sake of illustration, the chart has been shown with the study sub-window. On the example chart is an Exponential Moving Average (EMA), and its parameter is 34. This is the blue and pink line (#4) using the Above | Below format. The Above | Below is comparing the 34 line to a 9 period 2nd line which is not shown. The 2nd study line (#5) on the chart is a Linear Regression Moving Average (LSMA) with a 25 period parameter. This line is being plotted in Green and Red using the Rising | Falling format. References to 34 EMA and 25 LSMA are referring to these 2 study lines. Woodie follows a CCI spread line which is plotted in the sub-window as the thick black line (#21), and it oscillates above and below the zero center line. A histogram style (#22) is used with this CCI line with 4 different colors for the histogram bars. When the CCI line crosses zero line, as it did at 10:30 in the example, the histogram changes to a dark gray to indicate the crossing. If the CCI is still on the same side of the zero line 5 bars later, the gray color changes to a yellow color to indicate being at the threshold of a trend. Subsequent bars after the yellow boundary bar will be colored red when below the zero line, indicating trending, or blue when above the zero line and trending. This presentation of the CCI with the colored histogram in Ensign matches exactly the visual presentation Woodie uses. This primary CCI line in black uses a 14 parameter, and in Ensign it uses a 67 multiplier parameter. A 2nd CCI line (#20) is plotted as a thin yellow line to indicate a leading CCI which gives clues of what change might be forthcoming in the 14 CCI line. To the right of the zero grid line for the CCI is the current price. Above this current price are a pair of prices (#13), and these 2 prices are the values of the prior bar's high and the current bar's high. The template will change the color of these 2 prices to be a green color when the current bar has a higher high. Below the current price are similar prices for the prior bar's low and the current bar's low. And as shown in the example, these prices, normally shown in white, will change to be shown in red when the current bar has a lower low. So, in the center of the window one can quickly see the current price in the range of the prior bar and the current bar, and whether the current bar is breaking higher or lower than the prior bar. Above the 2 highs (#12) is the number of seconds remaining in this bar. In the example there are 155 seconds left in this bar. The bar is a 5-minute bar, and for a new bar one might see 300 seconds remaining, and then the number counts down with the arrival of new ticks. The number is normally shown in black, but will change to yellow when there are less than 20 seconds left to complete the bar. Items #15 and #17 on the chart are Ensign's equivalent of Woodie's Sidewinder indicator. Woodie has a trending indicator that is watching the slope of the 34 EMA and the slope of the 25 LSMA. He calculates an angle from these slopes and sums the two angle values to get an indicator for trendiness. I have looked over the details of the math he used to get his angle information, and I consider the Pyrapoint angle technology we have in Ensign to be similar enough to be used as an effective substitute. And it is a substitute for 2 reasons....1) I consider the Pyrapoint angle math to be superior and more generalized at arriving at a consistent angle regardless of the chart time frame or symbol the tool is applied to. Woodie's angle calculations are dependant on the chart time frame, etc., which is fine, but our method works very well also. The 2nd reason for the substitution is that the math for our Pyrapoint angle calculation is built into the Ensign program so it computes very quickly, much faster than could be implemented with a lengthy DYO sequence to calculate the angle as per Woodie's method. I have watched and compared our angle values with Woodie's, and in general, our angle values tend to be smaller numbers. Therefore the -64 degrees for the 25 LSMA and the -2 for the 34 EMA might be smaller values than Woodie's calculations. These angles are added together, which at times cancels out some of the difference. The message of Flat, Normal, or Trending that is shown by the -66 degrees total value, comes from certain levels of the angle total. The -200 grid line (#17) is a color representation of the message that was shown at that point in time for the bar. The red dashes are shown when the angle total's absolute value is below 50 and thus the word 'Flat' is being displayed. 50 is the threshold I found to use that makes the dash coloring match quite well the same visual shown on Woodie's charts. Sums between 50 and 70 are the normal zone, and shown in yellow and would show the message label 'Normal' (#15). Angle totals that exceed 70 are shown in green and post the message 'Trending' in green. Again, this is slightly different math, but still
accomplishes an equivalent trending indicator. Ensign's
study is equivalent to Woodie's Sidewinder because they look
really similar as trending indicators and messaging. You
will find the -200 grid line coloring to be very similar to
Woodie's. The colors of Red, Yellow and green mean Flat,
Normal and Trending in that order. You will find that the
angles are slightly different for the 34 EMA and 25 LSMA on
Ensign's charts from what you may see on the moderator's
charts. Ensign uses its proprietary Pyrapoint technology to
determine standardized angles for the study line slopes. For more information and documentation about Woodie's CCI trading methods, please visit his web site at www.woodiescciclub.com Woodie also has a very popular chat room with audio where patterns are discussed in real-time during market hours. Feel free to check out his web site and chat room. Trading Tip: by Judy MacKeigan
Mail Bag: 'You have found the solution! The workaround is good. You have absolutely no idea how pleased I am with this!!!! I have sent many many people to Ensign through the years and this is just such a good example of why I have done so and will continue to!!! Customer service just doesn't get ANY better than yours!! A VERY appreciative' -D. Mack 08-18-2006 'Thank you very much for the time you devoted from your busy day, to read comprehend and execute a solution to my requests. I am very mightily impressed with your attention to my little project! Now it [the Ergodic] works in a truly dynamic grid with fixed integer grid lines! I must admit, I would never have been able to figure out how to do this on my own. I truly appreciate your assistance. Your service to your customers is way beyond expectation. I would add, that unlike some purveyors of charting software, you seem intent on keeping your customers happy and using Ensign!' -G. Schiffer 08-15-2006 'Wow! Thanks much for all the help guys. I can see by all the new developments that Ensign has been a busy place lately. I truly appreciate the time taken to make this provision work. (Note: ESPL Update function enhancement) I'll give it a run after hours today.' -M. Wilson 08-03-2006 'That is a tremendous, succinct and informative article by al-gorithm. (July 2006 newsletter) Many thanks for your brilliant and tireless efforts in providing a service which continues to exceed all expectations.' -J. Culshaw 08-01-2006 'I was just wondering what is the validity of running a volume based indicator like force index on a volume bar chart when each bar has equal volume?' Answer: 'It has no effect. If you subtract the volume
component from the calculation the oscillator looks the same
on a volume or share bar chart. In my personal opinion, the
only thing volume does when calculated into any oscillator
(on anything other than a volume bar chart) is to amplify or |