Try Speeding Up Your Indicator © MMVI al_gorithm All Rights Reserved Contact Info: catch_al@hotmail.com Smoothed oscillators give the appearance of being easier to read and can often help keep a trader from getting drawn into a trade by noise or help keep you in a good trade. But their signals are often obtuse, delivered cryptically and often after the best entries or exits have passed. The closer you can tune your oscillator to price action the more chances are that it will be helpful, rather than hurtful. This article is not about which oscillator or settings are better. I’ve used both smoothed and raw indicators with great success. But there are less common ways of tuning and reading indicators that are equally valid and might even give you clearer or earlier signals. As traders, we need to consider all options with an eye to keeping things clean and simple. Let’s first discuss oscillators in general, and then one in particular. Next, we’ll compare signals generated from all the oscillators on the same chart. I’ve chosen to use Alexander Elder’s, minimally smoothed, Force Index as my robust oscillator example. I could just as easily have chosen a very short-term MACD or Stochastic oscillator. The same principles apply, although you won’t always get the same signals. Oscillator lines swing from above to below a centerline, signaling overbought and oversold conditions. With most oscillators, the degree of overbought or oversold can be measured and there is a neutral territory (somewhere in the middle), but not so with the Force Index. It’s simply a very robust, short-term overbought oversold indicator. In other words, the Force Index always considers the market it is measuring either short-term overbought or short-term oversold. Therefore, it would be very difficult to use the Force Index alone. It’s typically paired with a moving average plotted on a chart to measure the trend, or lack thereof.
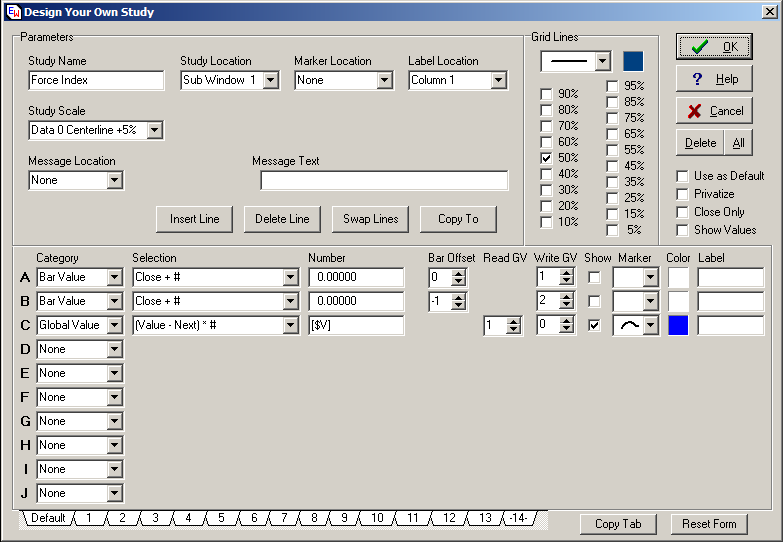
Please remember as we go through this example that we are only looking at the market in one dimension. For the purposes of clarity, we’re only going to compare the price action to the indicators in one timeframe. If we were to employ multiple timeframe analysis, the turning points would be much clearer, allowing us to take earlier signals. We’d know in advance of taking any one trade whether it will be a trend trade and need to give it a little more room to develop and that we should hold it, or whether it will be a scalp trade where we will have a tight opening position stop loss and a specific target we would be looking to test. For more information on implementing multiple timeframe analysis, see my article in the October 2005 issue of Ensign’s Trading Tips Newsletter. Money management is critically important to any trading strategy but has not been taken into account in this article. In order to stay focused on the issue being discussed, we’re simply going to compare different oscillator buy/sell signals across various market conditions, in one timeframe, without money management considerations. On the following chart I’ve plotted a very popular moving average combination for reference, a 30 period weighted moving average (WMA) and a 9 period exponential moving average (EMA). The 30 WMA measures the trend and the 9 EMA helps measure the pullbacks within the trend. The Trading Plan When there’s slope to the 30 WMA and the price bars pull back to or past the 9 EMA, we’ll watch for the resumption of the trend, presuming that it will continue until proven wrong. We will time our entries with the Force Index signals and compare them to the slower, smoothed oscillators. We are only concerned with timing entries in this article. Everything else is being disregarded. This is our trading plan for this example. Here are the Ensign Window’s properties for the Force Index:
The formula is V(C-C1). Where V = Current Bar Volume The Force Index measures the spread between the closes and multiplies that value times the current volume. The premise for the formula is based on the fact that typically, volume surges in the direction of the trend and diminishes on pullbacks.
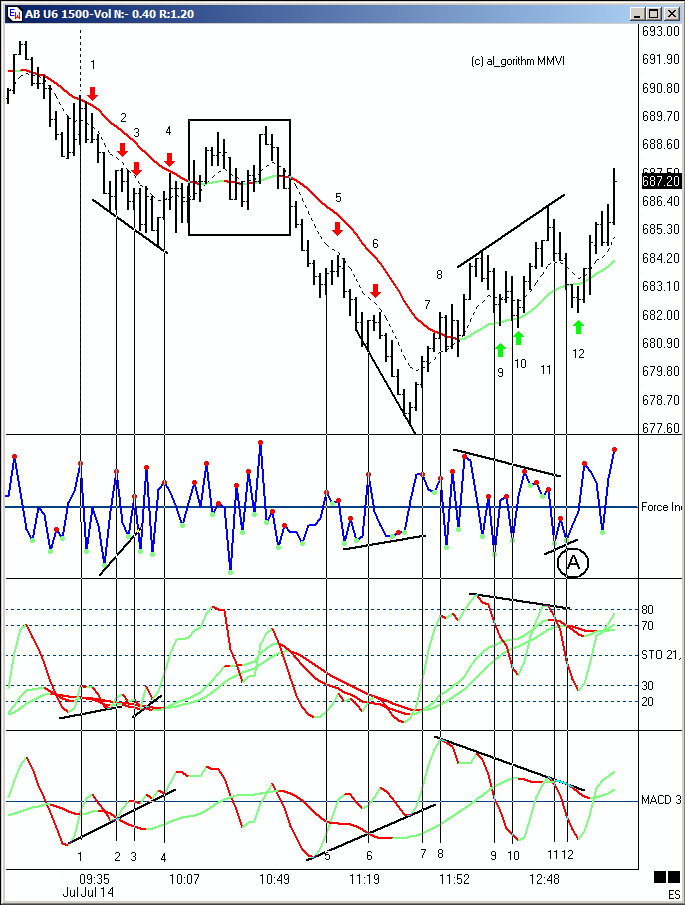
The following indicators and markers are plotted on this chart and used as indicated: 30WMA – Signals Trend 9EMA –Gives A Reference Point For Pullbacks Force Index – Signals Short-Term Overbought (OB)/Oversold (OS) Conditions The green and red dots on the Force Index are only there for illustrative purposes to help you see which direction the trend must be in to use that particular signal. When the trend is down, the Force Index signals a sell when it retraces "above" its centerline. A red ball appears at the top of the swing signaling a short opportunity. Ignore all buy signals when the trend is down with the one exception (divergence) noted below. Typically, you’ll get at least one bar advance notice of the turn, however, if the trend is about to wane, the signal can be false. Money management and multiple timeframe analysis keeps you out of trouble, but is not considered in this article. Stochastic Pair (21,10,4 smoothed averages – Slow Lines) – Signals Trend MACD (3,10,17) Slow Line – Signals Trend Vertical Lines – Drawn based on the each Force Index Buy or Sell Signal. Arrows – Indicate Buy and Sell Short Entries (trailing stops would be placed when the Force Index signals (see vertical lines) and the arrows indicate where your stops should have been elected. Numbers – Identify the lines intersecting all the oscillators It is not my intent to suggest, by marking out each trade signal, that this is where a trader should have gotten in or that this is a scalping system. The best trades are the earliest trades, in my opinion, and then hold through the entire trend. But in reality, we miss trades and so are frequently chasing. Therefore, all trades have been mapped. Now take a minute to study each signal on the chart and note the differences between each of them. Each indicator signals the turn but each in it’s own way. Compare and see if you can identify them before proceeding. There are many different ways to read or apply oscillator signals. In general, I watch four things.
Entry Opportunities 1-4: We’re only looking for shorts since the trend indicator (30wma) is down. Entry Opp 1: The Force Index gives a clear OB signal and turns down one bar in advance. The Stochastic and the MACD fast line have crossed above their slow lines indicating a short-term OB condition, however they haven’t turned down yet, but it doesn’t have to. Psychologically, aspiring traders seem to need to see an indicator pointed in the same direction that they want to trade, and that rarely happens with smoothed indicators. Entry Opp 2: Same conditions as 1, except that the MACD and Stochastic are warning (diverging) which would cause many traders to ignore the fact that the down trend is still in tact and strong. Many would miss the 2nd entry opportunity here. One difficulty for aspiring screen traders using smoothed oscillators is that when the oscillators become overbought or oversold, they can stay that way for a long time. They’ll threaten to roll over and signal an end to a move along with price action, only to become more overbought or oversold with the next push in the direction of the trend. We frequently hear complaints from traders who get absolutely killed on directional trend days. The oscillator signals an end to the trend and the trader buys/sells into strength over and over again, all day long, loosing every time. Oscillators signal best during broad swinging markets. During periods when the market isn’t trending or the market is in a grinding trend (directional movement but the bars are heavily overlapped), smoothed oscillators give lots of false signals. Entry Opp 3: This time, the Force Index joins the party and diverges from price action and this time it’s real. Price action enters a real period of short-term consolidation before it retraces deeper. These first 3 entries were all winners. At a minimum, you should have been able to move your stop loss to break-even. Entry Opp 4: Again, the Force Index signals a short opportunity. The Stochastic are warning and the MACD is screaming divergence. Since we’re only looking at one timeframe, it’s almost impossible for me to say what I really would have done here, but based on only this one chart and the Force Index, I would have taken this trade. In my experience these are 50/50 setups, but because my money management rules give me enough of an edge, I feel safe in taking these lower probability trades. When they go, there can be huge runs. The Rectangle: We’re using the 30wma to indicate trend in this example, so when it’s flat, we’re flat. Entry Opportunities 5-8: We’re only looking for shorts since the trend indicator (30wma) is down. Entry Opp 5 & 6: Similar Stochastic and MACD read as described in Entry Opp 1 with the exception that the fast lines haven’t crossed above their slow lines, typical in a strongly trending market on the first move after a consolidation period. Entry Opp 7: Ignored because of the Force Index divergence. MACD shows the same but no sign of it on the Stochastic yet. Entry Opp 8: Ignored because the Force Index didn’t even retrace below its centerline before it turned up again. It’s a sign of strength that can’t be ignored. Entry Opportunities 9-12: We’re only looking for longs since the trend indicator (30wma) is up. Entry Opp 9 & 10: Trend (30wma) is up, so go with the flow. 9 gets you to near breakeven before retracing. 10 is a clear winner. MACD was signaling divergence but my trades for this article are based on the Force Index. The Force Index divergence hadn’t formed as of the time of the #10 setup. Entry Opp 11: Ignored because the Force Index didn’t even retrace above its centerline before it turned down again. It’s a sign of strength that can’t be ignored. See divergence line marked "A". Entry Opp 12: Even though we experienced a deeper retrace this time, the 30wma stayed strongly up, so when the Force Index signaled long with a higher low, it’s a safe entry and turned out to be a very good trade, indeed.
As I said when I opened this article, I’ve used both raw and smoothed indicators successfully. In my opinion, the simpler and cleaner you can make your trading plan the better you’ll do. Consider the following: Using the MACD or Stochastic, you’re watching: The slope of the slow lines, the spread between the slow lines, the level of the slow lines, divergence of the slow lines, the direction of the fast line, the level of the fast line, the relationship between the fast and slow lines, divergence between the fast line, price action and the slow lines…phew, and there’s more. No wonder so many traders freeze, can’t trade more than one market at a time, are indecisive, can’t follow a plan, can’t even make a plan…and on and on it goes. Now add in several indicators, multiple timeframes, multiple markets and it can become diabolically complicated. Using a robust indicator like the Force Index or a very short-term setting of your favorite indicator, you can stay focused on the price action (do you even remember what that is?) and when you have a setup, any setup, a quick flick of the eye to the indicator and you either place your opening position stop or you don’t. Then scan the next market looking for the next "quality" setup. I suppose the debate over smoothed verses fast, and lots verses a few indicators will go on forever. And that’s ok. Whatever works for the individual is what’s most important. Education is a never-ending process in this business. I hope I've presented some ideas you feel worthy of investigating to continue yours. |