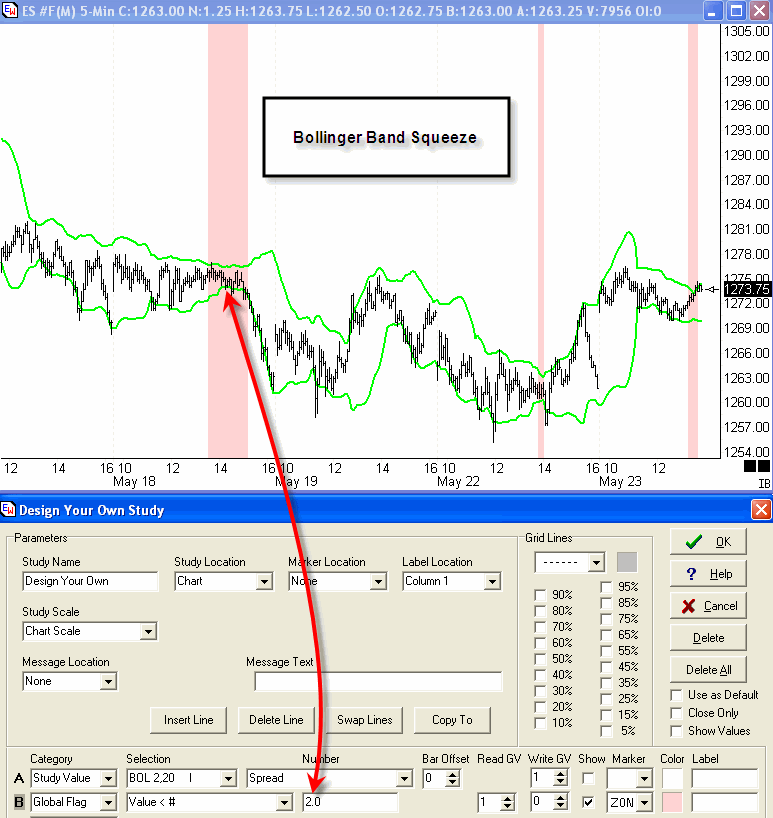
by Howard Arrington One use of the Bollinger Band study is to indicate when the market has entered a narrow trading range. A narrow range indicates momentary balance between buyers and sellers. As the trading range becomes narrower, and the market volatility lessens, the spread between the Bollinger Bands becomes smaller. This condition of the Bollinger Bands squeezing together is highlighted on this chart by the red zones using the Design Your Own (DYO) study.
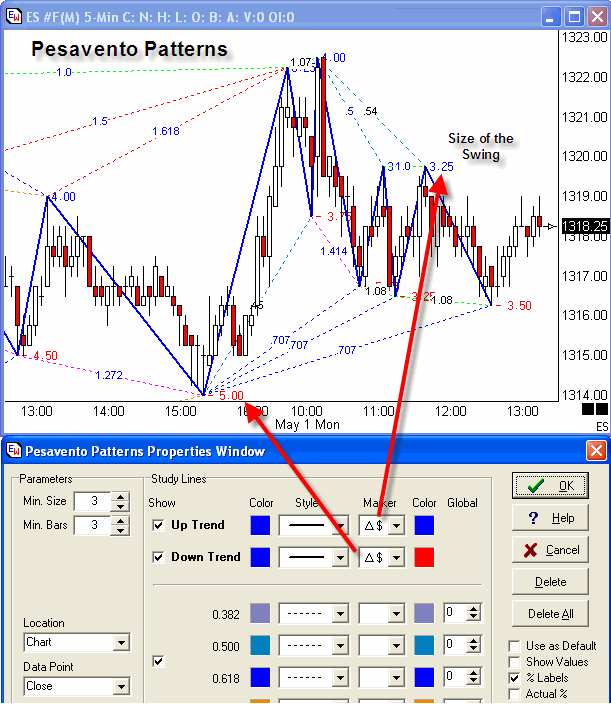
Line A reads the Spread between the Bollinger Bands and stores this value in Global Variable (GV) 1. Line B will read the value in Global Variable 1 and compare it to a Number. The Line B Number parameter is the size in chart scale points for marking the squeeze condition. The example shows bands that are within 2.0 e-mini points of each other. When Line B evaluates to a Boolean True, then the vertical stripe ZONe marker is added to the chart using the light red color. Tip: Trade in the direction of the break-out from the narrow range of the Bollinger Band Squeeze. Trading Tip: by Howard Arrington Question: I was on the phone with Larry Pesavento discussing how to calculate the harmonic for a symbol. He mentioned that Ensign has a tool that will automatically calculate swing values. Is Larry possibly referring to a study you created for him? Answer: Larry is referring to the proprietary Pesavento Patterns tool in Ensign Windows which draws the swing lines. The study can use the Delta $ markers to show the size of the swings (change in price from the ends of a trend line). Look for common (similar) sizes of the swings such as the 3.25, 5.25 points and 8.00 points on the ES e-mini chart. The common swing sizes are the natural harmonics for the symbol. To find the higher harmonic numbers, look at the common swing sizes on a 30-minute chart.
Click this link to watch a 4-minute video about the Pesavento Patterns study. Study Tip: by Howard Arrington Raw stochastic is the percentage of where a price is in a range of highest high - lowest low over a set of bars. Some call the raw value Fast %K. Raw Stochastic = 100 * (Last - LowestLow) / (HighestHigh - LowestLow). Slow %K is an average of the Raw Stochastic. Some call this first average Fast %D. Slow %D is an average of the Slow %K. This is the 2nd average. Ensign Windows has 4 choices of which formula to use for
calculating the averages. The average used for the original
Stochastic work was an exponential moving average. However,
variations using simple average, weighted average and
smoothed average are also worthy and useful Stochastic
calculations. Exponential = Previous Average +
((Current Value - Previous Average) / Alpha) Smoothed = Previous Average +
((Current Value - Previous Average) / Alpha) The parameter N is greater than or equal to 1. If the parameter entered is less than 1, then invert the parameter using N = 1 / parameter. Ensign Windows does not do a 3rd average. If an average of the Slow %D is wanted, then put on a moving average study and set its Data Point to be the %D value of the Stochastic study. Click the following links for two excellent articles in past Trading Tips issues for additional information about the Stochastic study.
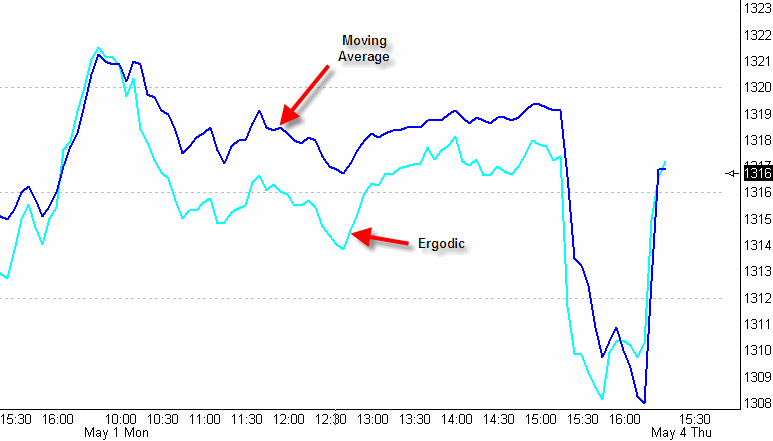
Study Tip: by Howard Arrington The Ergodic formula is a ratio of two double averages. The numerator is an average of an average of the Net. The denominator is an average of an average of the Absolute value of the Net. The Net is the difference between a bar's close and the prior bar's close. Ergodic = (Average (Average (Net, parameter 1), parameter 2) / (Average (Average (Abs(Net), parameter 1), parameter 2) The plotted Ergodic study line is not much different than just plotting a small period moving average of the bar's close price. Let me illustrate with this comparison.
I have used parameters that are smaller than are typically used for Ergodic so that the comparison of similarity to the small period moving average would be more obvious. You can see the waves are the same, and the turns are identically aligned. So, in essence the Ergodic is just another moving average. But, because the Ergodic is a ratio it cannot be plotted on a price scale. Ergodic has its own scale, and the range for this scale will fluctuate. The Simple Average (blue line) is using a 2 bar parameter. The parameters for the two averages in the Ergodic (cyan line) are 26 and 3. |


