by Brad E. Stych, Ph.D. Copyright © 2005 by Brad E. Stych All Rights Reserved Reprinted by Permission Many years ago, I heard a friend say that there are three kinds of people in the world: those who "make it happen," those who "watch it happen," and those who say "what happened?" I laughed because the comment aptly described much of my daily experience with people at that time. I now realize that the above perspective seems to ring true in the trading arena as well. When we carefully examine the behavior of traders, we find that traders may be classified primarily as participators ("make it happen"), spectators ("watch it happen"), or inquirers (say "what happened?"). For purposes of this discussion, we will ignore the last group. The inquirers are people who want income derived from the markets, but don’t really have the time, aptitude, or interest for exploration of trading. They are often surprised by market moves, believe that market participation is a dice roll, and are mostly clueless about money matters. As one banker told me, they are people who naively search for investment vehicles with a high rate of return and low probability of loss, not grasping the fundamental truth that reward is proportional to risk. Throughout my trading journey, most of the people I’ve encountered have been spectators. At one end of the spectator continuum, there are those who cheer when the markets move in expected directions or when players (other traders) succeed in their endeavors. Reminds you of sports fans at a football game, doesn’t it? At the other end of the spectator continuum, there are those who methodically study the markets and observe how trading may be accomplished successfully. Comparatively, the latter individuals have a better chance of becoming full-fledged participators—those who have developed sufficient confidence and skill to trade successfully on a regular basis. In speaking about spectators and participators, I’m not suggesting that a thick wall exists between the groups. Learning how to trade often involves shifting back and forth between "spectator" and "participator." However, a problem arises when we get stuck in the spectator role; we become so comfortable with analyzing charts and trade setups that we lose focus on the ultimate objective—learning how to trade for ourselves. How do we become entrenched spectators? I’m not exactly sure. At times, I believe that analysis paralysis acts as a cover for fear. We’ve been burned on a few trades, and now find it difficult to come out of the hole. So, we comfort ourselves with charts and trade discussion, hoping that things will change. Another possible explanation is that we don’t see a clear road between theory and practice. Trading looks good on paper, especially when someone else does it, but making it work for ourselves seems like a very interesting, but distant dream. From an instructional point of view, helping others to improve their trading skills is not an easy endeavor. I say this as a professional adult educator who has trained adults in various fields of endeavor (athletics, music, health care, education) over the past 30 years. Some of the difficulty rests in the fact that no two people do things exactly the same way. Talk to a group of traders and you’ll discover that different personalities, thinking patterns, and experience levels shape the ways in which individuals learn and trade. Additionally, some people who are attracted to trading exhibit adverse tendencies that I’ve seldom encountered among other people aspiring to learn a skill set. For example, when I worked in a music store and taught adults how to play the organ, I offered guidelines for development and anticipated that my students would practice. Those who practiced diligently eventually learned how to play. Pretty simple. With traders, however, common-sense guidelines can go out the window very easily. At times, I’ve offered helpful suggestions for improvement only to discover that some traders stubbornly do what they have always done (engage in trading behavior that doesn’t make them money), or worse, they do the opposite of my suggestions. I vividly remember a failed teaching experience with a woman who had a "contrary" personality. If I suggested "A," she did "B." If I said, "Try trading with the trend," she would trade countertrend. It was obvious that her countertrend approach wasn’t making money for her. But, oddly enough, the discrepancy between how she wanted to trade and what worked in the market didn’t seem to bother her. She had somehow convinced herself that if she did more of the same (countertrend trading), she would be successful. Eventually, I realized that I couldn’t work with her because she wasn’t ready to change what she was doing by trying new things. Moving from spectator to participator means leaving the realm of imaginary trading, and entering the arena of reality. It means allowing yourself the freedom to fail, while embracing an organized program of development. Remember my music students? They had many failures along the way, but these failures occurred within a supportive environment. Those who accepted guidance, practiced diligently, and remained flexible were the ones who overcame their limitations. In general, I believe that a three-pronged approach to learning makes the process of developing skills more systematic and helps one to stay on track toward advancement. So, in your attempt to break the bonds of analysis paralysis, consider structuring your learning around three important questions:
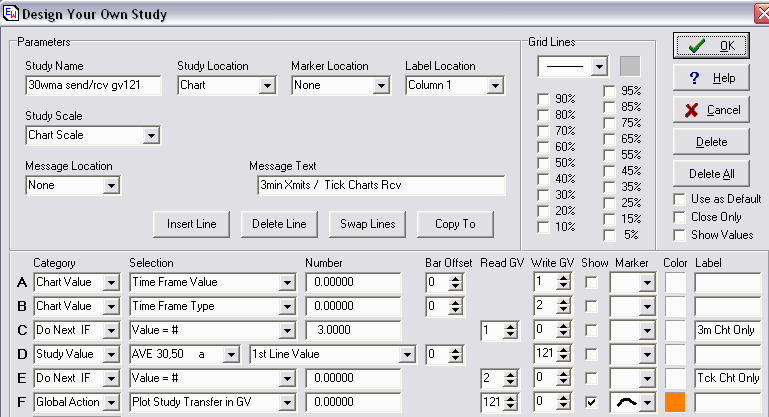
The resources that you choose to answer these questions can be few or many. Some traders pursue individual learning by reading books and articles, talking to other traders, searching the Internet for information, utilizing Ensign Software’s Play Back feature, or receiving assistance from a mentor. To facilitate learning among traders in a group environment, I’ve opened a new online Ensign chat room organized around trading the Dow Mini futures contract (See "Dow Mini" in the room list.) There, I attempt to help room members answer the three questions above by adopting relevant instructional procedures that are straightforward. In the room, I EXPLAIN important aspects of trading, ILLUSTRATE trade execution in a real-time trading environment based upon concepts discussed, and assist you to APPLY new learning. Of course, as with all Ensign chat rooms, nothing said or done in the room is to be construed as trading advice. Each person trades at his or her own risk. By the way, if you’re looking for a magic indicator, fabulous method, or "secrets" of effective trading, you won’t find them in our room. (If there were such things, would anyone be sharing them?) Instead, you’ll get a no-bologna approach to skill development. But be prepared. Your biggest improvement as a trader may not emerge from having more information about charts, but in learning to use your existing experience in more constructive ways. Trading Tip: by: David Gerdes TimeFrame Conditional DYOs In this article I introduce a couple new features of Ensign Windows which make it possible to create conditional DYOs which can modify their behavior based on the timeframe of a given chart. These new fields are DYO entries for Category Chart Value and Selections Time Frame Type and Time Frame Value. These fields tell you if, for example, a chart is a Volume, Tick or Minute chart, and what is the metric value of that time frame such as 5 for a 5 minute chart or -1064 for a 1064 Tick. More information about this feature is available at http://www.dacharts.org/archives/Ensign_Wed_class_transcripts/Beta-NOalt-colorbars-stochxover-fixcharts_10-12-05.htm under the heading Chart TF Flags.Often it is not necessary to test both Type and Value. Depending on your workspace, you can likely assume a TF Value of 3 implies a minute based chart, while -1064 is a Tick chart. The DYO below changes its behavior depending on which timeframe chart it is applied to. When running on a 3 minute chart, this DYO takes the 30 period weighted Moving Average and assigns it to GV 121. When running on a Tick based chart it will plot that 3min 30WMA using the Plot Study Transfer function.
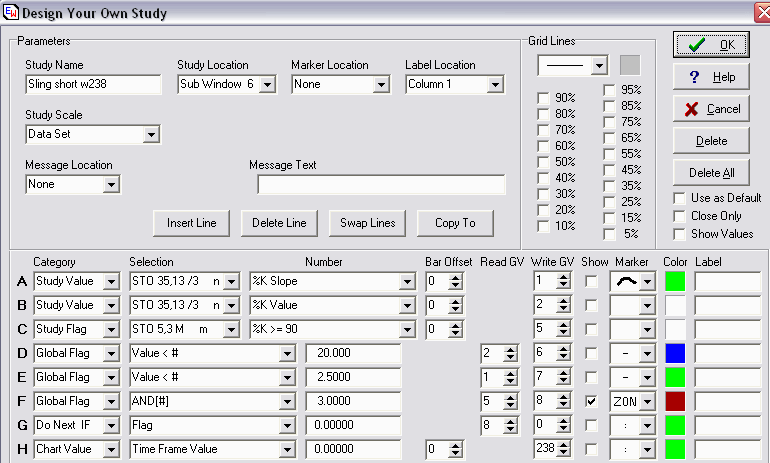
Line A - Get the Time Frame Value from the chart, store in GV 1 Line B - Get the Time Frame Type from the chart, store in GV 2 Line C - If this is a 3 min chart, execute Line D Line D - Get 30 WMA value and assign to GV 121 - Study Broadcast Line E - If this is a Tick based chart, execute Line F Line F - Draw the study value in GV 121 transferred from 3min chart Audible Alerts Switchboard Now we will take it up a notch and show a more complicated example, namely generating unique audible alerts for a given condition announcing which timeframe chart generated the alert. The application in this example will be to play a unique audio alert given a trade setup, long or short, and which chart it applies to. To do this, I need to create a unique audible alert for each of these combinations. Then for each audible alert, I need to create a Study Alert which tests for the correct conditions to be true and plays that specific alert. There will be several Study Alerts created, but only on a Master switchboard template. You may immediately note, that if I wanted to play a unique alert for each chart, I would need a unique template for each chart which references the appropriate files. This is normally true. But in this example I instead will build a single generic template which can be applied to all charts, and then I will build a master switchboard template which will be the central switch for consolidating alerts and playing the appropriate alert file. I will use the ‘Time Frame Value’ field to give extra information for noting which chart generated the alert. The next figure shows a simple DYO which attempts to detect when a Bline SlingShot might be setting up. Lines G and H have been added to set a special Global Variable (GV) for that alert, and the value is assigned to the GV in the Time Frame for the chart which generated it. Notice that this DYO is not in any way chart specific and can be applied to all charts from a single template. In this example, GV 238 is defined that, if it is non-zero a SlingShot Short condition exists, and the value in the GV is the Time frame that uniquely identifies which chart generated the alert. Note for completeness, a separate similar DYO and GV 239 is used to identify SlingShot Long conditions in the same way.
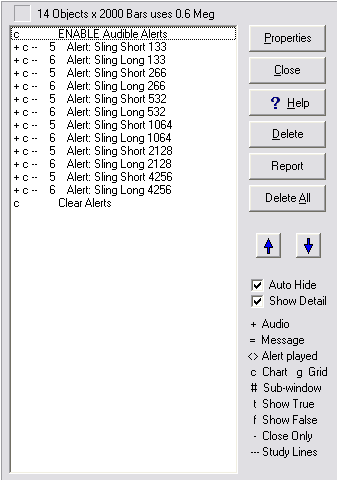
Now we jump over to the Alert Switchboard template. This template needs to be applied to a single chart so that it can run. I have chosen to apply it to a stand alone 133 Tick chart because that is the smallest timeframe that my workspace is watching for these alerts. Which timeframe it is applied to affects the resolution of the alerts because I use the 'Sound Once Per Bar' feature to reduce the number of times I have to hear a given alert. This template contains several Study Alerts, one for each timeframe and alert type which generates a unique alert.
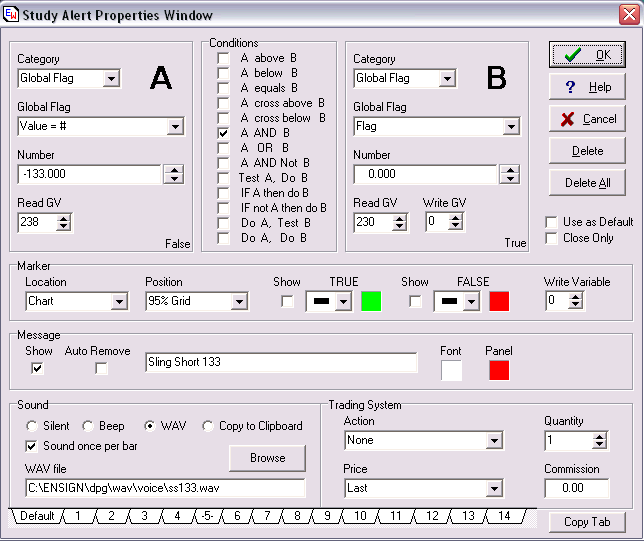
Each of these Study Alerts (see Figure 4) will test for one condition on one chart, and play the specific audible alert for that pair. In this template I have also added the capability to easily enable or disable all audible alerts using GV 230. At the end of the switchboard you can see that I have a single DYO which clears both the alert GVs to Zero so that the alert will not be falsely triggered on the next pass through. Note that an alternate way to implement this switchboard would be to include the same logic on the main template which is applied to each chart. This would create more total objects on your workspace which may impact memory or possibly CPU. Since this switchboard could potentially get very large if we had several types of alert conditions, I chose for this project to try the central switchboard approach instead to see how well it worked. Since we cannot guarantee the order with which charts will be processed, for each pass through our master switchboard (Figure 3), potentially 2 or more charts may have triggered the same alert. If this is the case, only the last chart to modify the GV will get an audio alert played by the switchboard. Generating Audio Files For generating unique alerts, the AT&T Natural voices text to speech generator is an excellent tool. Thanks to members of the Bline chat room for sharing this link. I'm just passing it on because I have used it and like it. It is available at http://www.naturalvoices.att.com/demos/ For a slingshot alert I would put in the text: ‘Sling Shot Long 10 64’ and it will generated a .WAV file with a computer generated voice saying those words. Managing GVs We want to set a GV to a value when an alert is triggered, and only when an alert is triggered, and then reset that GV to Zero after the alert has been processed. We need to be careful to not accidentally overwrite the GV with Zero just because the alert did not trigger on a given chart. Because multiple charts are writing to a single GV, we ONLY want to write to the GV when the alert is triggered. By default, Study Alerts and DYOs always set GVs, whether in the TRUE or FALSE case. To avoid this, we have to use the Do Next IF Category of DYO to ONLY set the GV in the Positive case. This can also be done with Study Alerts with the If A then do B Condition. Further Extension It would be desirable to do the same type of thing for each Symbol which is watched. The above examples assumed only a single symbol (e.g. ES #F) is being watched. Logically you would like to extend this conditional strategy to support more than one symbol. For example, with the 30WMA DYO, we don't want to draw the ES 30WMA on the YM chart. To support more than one symbol we would need to assign a unique GV for the 30WMA for each symbol we monitor, and then have the DYO detect which symbol was on a chart and use the appropriate GV. Currently Ensign Windows has no direct way testing for a particular symbol within a DYO. So you would still likely need a separate template for each unique symbol on your workspace. There are possible workarounds to this and Howard has suggested that you could for example compare the Tick Size value or the $ / Tick value for the set of instruments that you watch to identify a unique combination |


