The Geometry
of Draw Tools
by Howard Arrington
Draw tools are used by technicians to analyze chart
patterns. They are a convenient way to measure price and
time relationships and embody such characteristics as slope,
parallelism, channeling, and retracement percentages. Many
tools are related to each other with just a slight variation
in a construction principle. Seminars, trading systems, and
books are frequently based upon draw tools wherein the
author expounds his special insight as to their use in
trading the markets. I have used the name of the tool that
I am familiar with, and apologize if you recognize the draw
tool by some other name. The draw tools are simply
geometrical constructions, and this article will show how
they are constructed.
 Trend Lines
 |
|
| Trend Lines are the
fundamental construction tool. They are drawn
most often between two significant turning
points. This type of trend line is often called
a swing line.
 Variation: A Linear Regression trend line is
determined mathematically so that it is a 'best
fit' line. The least squares method plots the
line through the prices so as to minimize the
distances between the prices and the trend line.
Variation: A Linear Regression trend line is
determined mathematically so that it is a 'best
fit' line. The least squares method plots the
line through the prices so as to minimize the
distances between the prices and the trend line.
Variation: Extend the lines forward and/or
backward in time. |
 |
|
Channel Lines |
|
| Channel Lines are
constructed parallel to a Trend Line with a
spacing that contains the highest high and
lowest low of the chart bars.
Variation: The spacing is based on the
Standard Deviation of the prices.
Variation: The spacing is based on a
percentage of the price.
Variation: Raff Regression Channel lines are
equidistant channel lines drawn parallel to a
Linear Regression trend line. |
 |
 Pesavento Patterns
 |
|
| This draw tool is
named after Larry Pesavento, who popularized
this analysis method in his book 'Profitable
Patterns for Stock Trading'. The technique
labels the X-B line with the price percentage
relationship of A-B compared to X-A.
In the example: (Price A - Price B) /
(Price A - Price X) = 0.618 |
 |
|
Support and Resistance Lines |
|
| Support trend lines
are drawn underneath chart bars by connecting
swing lows. Resistance trend lines are drawn
above chart bars by connecting swing highs. The
most popular use of such lines is to watch for
the trend to break through the trend line, at
which time a position is taken in the direction
of the new trend.
Variation: Add a channel line parallel to a
Support or Resistance trend line. For example,
a channel line could be drawn through point A
that is parallel to the X-B line. |
 |
 Fibonacci Extension
 |
|
| The X-A-B pattern
is often used to forecast future price action.
The Fibonacci Extension technique constructs the
next trend line B-C parallel to the X-A trend
line. The length of B-C will be a Fibonacci
percentage of the length of the X-A line. The
three most common lengths considered are 0.618,
1.000 and 1.618. The example shows these three
target price levels.
Variation: Point C (the 1.000 Fibonacci
Extension) can be obtained by moving the X-B
line to point A. The line A-C is equal in
length to X-B and parallel to X-B. The A-C line
is a measured move to the Price Time Target. The
expression Price Time Target (PTT) comes from
the book 'Precision Trading with Stevenson
Price and Time Targets'. |
 |
 Parallel Lines
 |
|
| A line is drawn
parallel to the X-A line to create a channel
through point B. The channel is sub-divided
with more lines that are equally spaced.
Variation: Use different percentages to
sub-divide the A-B line, such as the Fibonacci
percentages of 0.214, 0.382, 0.50, 0.618, and
0.7856
Variation: Use larger percentages to draw
additional parallel lines outside of the A-B
channel.
Variation: Draw the X-B leg first, and then
move to point A. This will draw the lines
parallel to the X-B line instead of parallel to
the X-A line. |
 |
 Andrews Pitchfork
 |
|
| The Andrews
Pitchfork is constructed using parallel lines
using three points labeled X-A-B. X, A, and B
are typically swing peaks. The pitchfork
handle is constructed from point X through the
midpoint of the A-B trend line. Two lines
(tines) are drawn parallel to the handle from
points A and B.
Variation: Addition lines (tines) are drawn
at the quarter and eighth points along the A-B
trend line, i.e.. at 0.125, 0.25, 0.375, 0.625,
0.75, and 0.875.
Variation: Fibonacci percentages are used
instead of the eighth points, i.e.. 0.214,
0.382, 0.618, and 0.786.
Variation: Draw tines outside of A-B by
using higher percentage levels.
|
 |
|
Schiff Lines |
|
| Schiff Lines are
constructed like the Andrews Pitchfork. The
difference is the end of the pitchfork handle
begins at the midpoint of the X-A line instead
of from point X. Thus, the tines are parallel
to the X-B line. |
 |
 Speed Lines (general form)
 |
|
| Speed Lines are
another variation of the Andrews Pitchfork.
All lines (rays) are drawn from point X. The
rays pass through sub-division points on the A-B
line. A-B may be sub-divided into eighths or
Fibonacci percentages. |
 |
 Fibonacci Levels
 |
|
| Fibonacci Levels is
one of the most popular tools. It is basically
the Schiff Lines variation of the Andrews
Pitchfork with point B relocated to form a right
triangle with the X-A line. This is a two point
construction because point B is automatically
aligned horizontally with point A and vertically
with point X.
The A-B line is sub-divided using Fibonacci
percentage levels of 0.382, 0.50, 0.618, and
0.786.
Variation: Add Fibonacci extension levels at
1.272, 1.618, 2.00, etc.
Variation: Sub-divide A-B into eighths:
0.25, 0.375, 0.50, 0.625, 0.75, etc. |
 |
|
Speed Lines (Fibonacci form) |
|
| Speed Lines are a
variation of the Fibonacci Levels tool. Instead
of horizontal lines being drawn at the
sub-division points on the A-B line, rays are
drawn from point X through the sub-division
points on the A-B line. This is the special
case where point B forms a right triangle with
the X-A line.
Variation: Sub-divide A-B into eighths:
0.25, 0.375, 0.50, 0.625, 0.75, etc. |
 |
 Gann Fan
 |
|
| The Gann Fan was a
primary construction technique used by the
famous trader W. D. Gann. The A-B line is
divided into eighths (or thirds), and rays are
drawn from point X to or through the A-B
sub-division points. Likewise, the horizontal
distance is sub-divided into eighths (or
thirds), and rays are drawn from point X to the
horizontal division points.
The unique characteristic is that the A-B
length should equal the X-B length. This means
there is a specific relationship between price
(A-B line) and time (X-B line). Therefore,
some unit of price equals some unit of time.
The 1x4 label means the line moves 1 unit of
price in 4 units of time. This is 25 percent of
the A-B height. The 1x2 line passes through
the A-B midpoint.
|
 |
 Gann Square
 |
|
| The Gann Square is
created by drawing a Gann Fan from each of the
four corners of a square. The example shows the
3 primary fan lines of 2x1, 1x1, and 1x2 drawn
from each corner.
Variation: Draw additional fan lines for the
quarter point sub-divisions.
Variation: Arrange additional Gann Squares
to be adjacent to each other to form a grid for
the chart bars to overlay. |
 |
 Pyrapoint
 |
|
| Pyrapoint is an
automation of the Gann Square principle. A
unit of time is automatically derived from a
price to create a square. The 1x1 fan lines
are drawn from corner to corner to create the
ascending and descending channels.
Variation: The tool is based on degrees of
rotation around Gann's Square of Nine. Larger
or smaller squares can be selected by changing
the parameter for the degrees of rotation.
Pyrapoint is copyrighted by Don E. Hall and
discussed in detail in his book titled 'Pyrapoint'. |
 |
 Fibonacci Retracement
 |
|
| Fibonacci
Retracement combines a Gann Fan being drawn from
point A and Fibonacci Levels drawn between the
fan lines. The tool draws the 2x1, 1x1, and
1x2 fan lines. The 1x1 line in the retracement
fan is a mirror image of the X-A line reflected
about point A.
Variation: Draw an inverted fan from point
B, which is the point that forms a right
triangle with the X-A line.
Variation: Draw the retracement fan from the
midpoint of the A-B line.
Variation: Use eighth division levels:
0.25, 0.375, 0.50, 0.625, 0.75, etc. |
 |
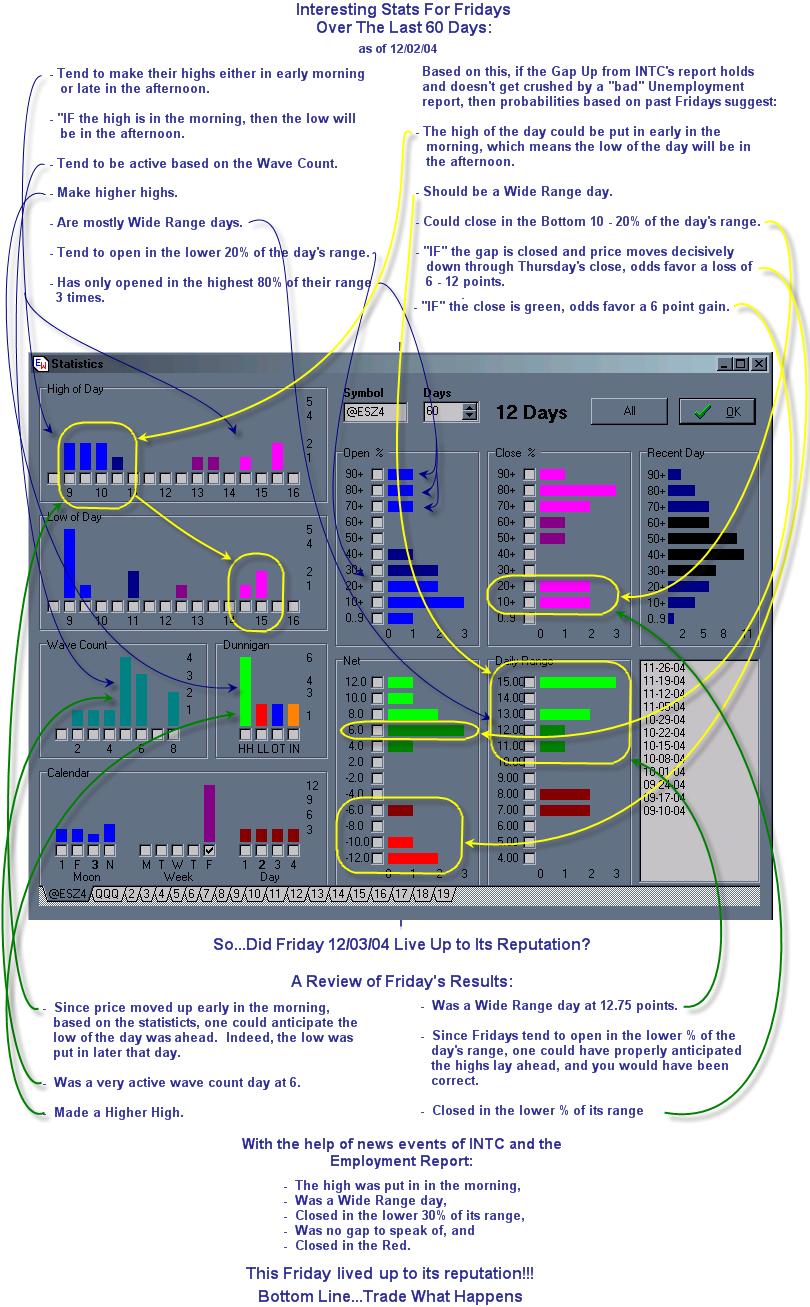
Trading Tip:
Friday Statistics
by Donald Dix
Trading Tip:
Volume Alert
by Howard Arrington
The following chart shows when the volume is above the
average volume.
The visual shows volume with the Blue
histogram bars, and a 10 period simple average of volume
plotted as the Red line curve. When the volume moves above
the average volume, a fat Green histogram bar is plotted
through the height of the average volume curve. The
following study alert was used to create this visual effect.
Panel A returns a 10 period simple average
of the volume. The period for the average function is the
Number field, which can be changed to plot a different
average volume. The alert test is True when the average
volume is below the panel B value which returns the bar's
volume. When the condition is True, the Green histogram is
plotted. When the condition is False, the Red curve is
plotted. The value plotted is the average volume
calculated by panel A |