by Howard Arrington
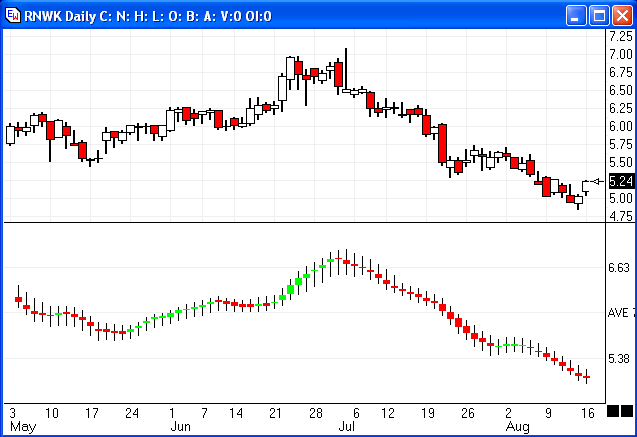
This chart example shows actual candlesticks in the upper half, and Average Candlesticks in the lower half. The Average Candlesticks show the directional flow of the market better. They were created using moving averages to create an average range and an average candle body. Apply a moving average study to the chart and set its properties to the following which calculates an average of the bar Highs and an average of the bar Lows. The spread between these two averages is plotted using the Marker as a thin vertical line. This step creates the average candle range.
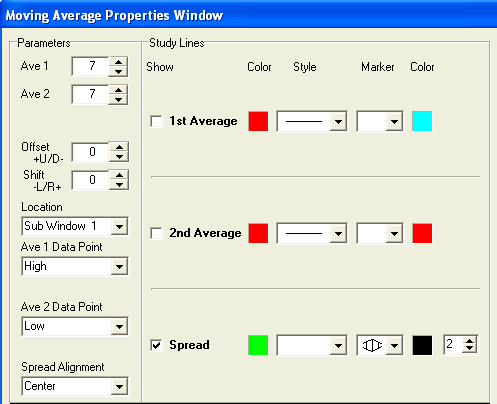
Apply a 2nd moving average study to the chart and set its properties as shown below. This average object will calculate an average of the bar Closes and an average of the bar Opens. The spread between these two averages creates the candle body. Use the Above..Below Study Mode so that an Up candle body can be plotted in the Green color, and a Down candle body can be plotted using Red. The Marker selection is the wide vertical line as shown below.
Trading Tip: by Howard Arrington Ensign Windows has the ability to have the input for a study be another study. This is often called a 'Study on Study' type of calculation. One popular use of this concept is StoRSI where a Stochastic is calculated on the Relative Strength Index. Another common use of Study on Study would be plotting an average of the original study values, and using as a trade signal the study crossing its average. A third use of Study on Study capabilities would be to plot the spread between two different studies, which will be illustrated in this article.
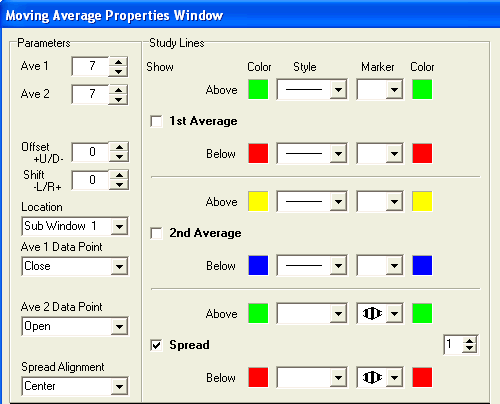
This chart has a Stochastic %K line plotted in Blue. Parameters are Bar=14, %K=5, %D=3. The Red line in the same study window is a 5 period average of a 9 bar Relative Strength Index (RSI). The issue being investigated is the spread between the Stochastic and the RSI which is the area that is painted yellow. A MACD oscillator study plots the spread between two averages. For this example, the Data Point for the 1st average was set to use the Stochastic %K study. The Data Point for the 2nd average was set to use the Average RSI study. The average parameters are set to 1 so the raw study values are used for the spread calculation.
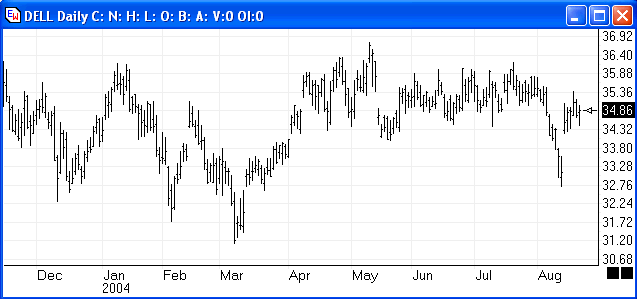
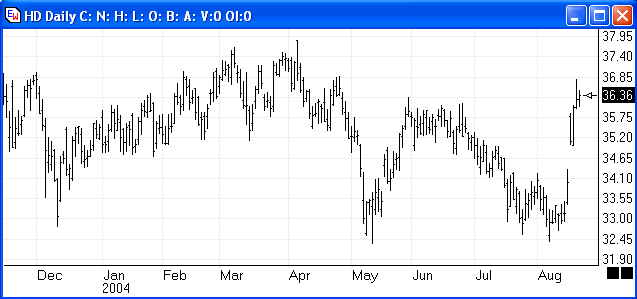
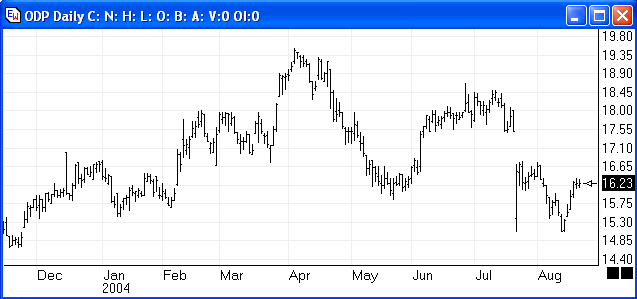
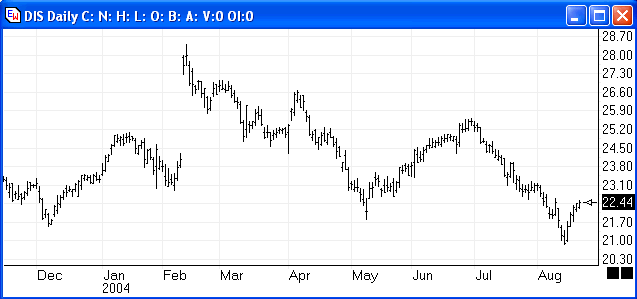
The Study Mode selected is Zones, which will permit the MACD line to be plotted using Green when it is above the threshold of zero, and Red when its value is below the threshold of zero. The MACD plot is shown in the bottom study window of the chart. You can visually see the correlation that when the Stochastic %K line (Blue) is above the Average RSI line (Red) then the MACD study line is above zero and plots using Green. This visual effect has been transferred to the chart bars by using the Color Bar selection in the Marker drop down list. When the MACD is above zero and plotting a Green line, the color bar Marker is also coloring the chart bars Green. When the MACD is below zero and plotting a Red line, the color bar Marker is coloring the chart bars Red. Trade signals might be created from this concept of comparing one study to another. The signals on the example chart look promising. However, there has been no attempt to optimize the parameters that were used in presenting the concept of Study Spreads. The article is just showing how different studies might be compared with each other by using the MACD oscillator to calculate a Study Spread. Education: by Howard Arrington and Bill Hatch I was impressed with Bill Hatch's article Straddle-Strangle-Swap in the July 2004 Trading Tips issue and have asked Bill to coach me in paper trading an account for the balance of the year. So, let me define the scope of this project, and publish an update each month for the rest of 2004. The paper trading goal is a monthly revenue of around $4,000. The expectation is that this revenue objective can be achieved with a trade size of 1000 shares in each of four different stocks. The paper trade model will use four stocks mentioned by Bill Hatch in the July article, namely Dell Computers (DELL), Home Depot (HD), Office Depot (OPD), and Disney (DIS). Stock options expire on the Friday before the 3rd Saturday of the month. In cases where the 1st day of the month is a Saturday, the options expire on the 2nd Friday. Therefore, the roll out date each month will be the Thursday before expiration. The initial paper trades for this learning exercise use the settlement prices from August 20th, 2004. A desirable characteristic is for the stocks to be tracking sideways. The following are daily charts for the four stocks in our model.
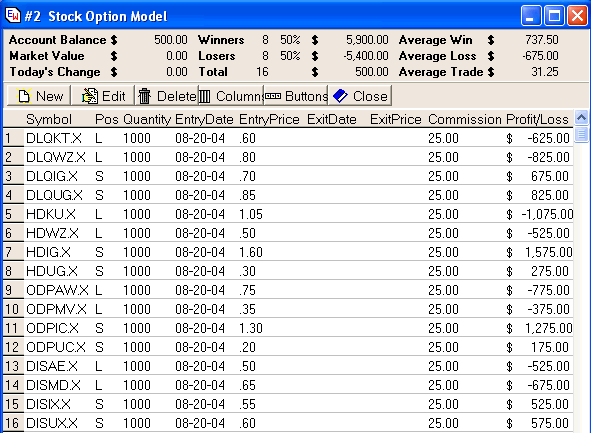
A Strangle is an option combination strategy where both a Call and a Put are purchased with space between the strike prices. For each of these paper trades, a Call is bought with a strike price that is $5.00 higher then the Put strike price. The Strangle is the insurance policy that limits the potential loss. DELL: In November options, bought a $37.50 Call (DLQKT.X) and bought a $32.50 Put (DLQWZ.X). This is the Strangle that limits the amount that can be potentially lost. In September options, sold a $35.00 Call (DLGIG.X) and sold a $35.00 Put (DLQUG.X). This is the Straddle, which is the first in a series of revenue months. The September Straddle will be bought back on September 16th, and replaced by selling an October Straddle. Home Depot: In November options, bought a $37.50 Call (HDKU.X) and bought a $32.50 Put (HDWZ.X). In September options, sold a $35.00 Call (HDIG.X) and sold a $35.00 Put (HDUG.X). Office Depot: In January options, bought a $17.50 Call (ODPAW.X) and bought a $12.50 Put (ODPMV.X). In September options, sold a $15.00 Call (ODPIC.X) and sold a $15.00 Put (ODPUC.X). Disney: In January options, bought a $25.00 Call (DISAE.X) and bought a $20.00 Put (DISMD.X). In September options, sold a $22.50 Call (DISIX.X) and sold a $22.50 Put (DIXUX.X). Here are the initial trades for the Straddle-Strangle-Swap, initiated with settlement prices from August 20th, 2004.
Commissions: Commission expenses will vary, depending on your brokerage. A typical cost would be around $25 for each of the trades shown in this table. Account Size: Most brokerages will require equity in the account to cover the maximum loss for each set of trades. In our model, the maximum loss could be $2,500 for each of the four stocks. So the minimum account size needed is $10,000. Account Balance: Can't complain that we are $500 to the good just by setting up the model account. Disclaimer: Hypothetical or simulated performance results have certain inherent limitations. Unlike an actual record performance record, simulated results do not represent actual trading. Also, since the trades have not been executed, the results may have over or under compensated for the impact, if any. No representation is being made that any account will or is likely to achieve profits or losses similar to those shown. This article is published for educational purposes only. |