by Paul Boughton Combining Gann Cycles With The Golden Ratio Gann wrote about natural time cycles and published a list of trading days to watch out for, but to the best of my knowledge never explained how he arrived at them. The following is just the tip of the Gann time iceberg.
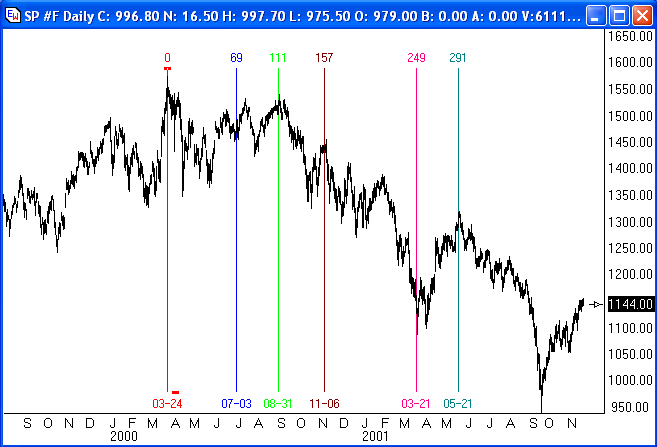
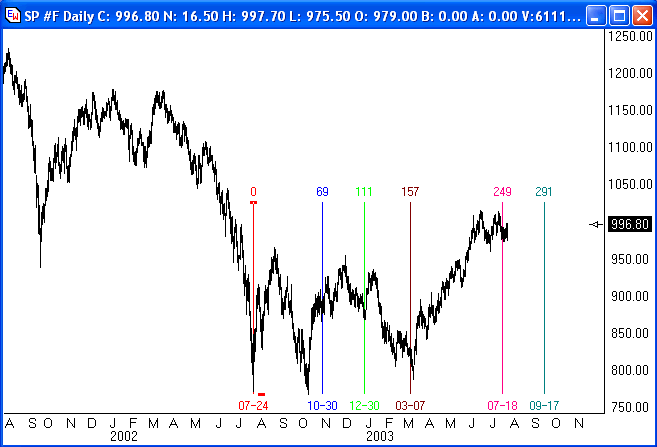
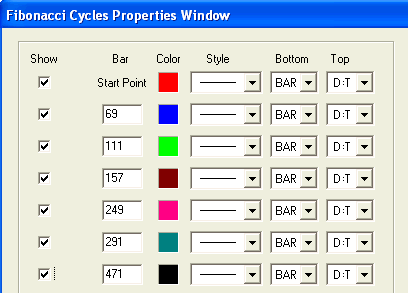
Start with the March 24th, 2000, S&P high and plug some of these numbers into the bar counts using the Fibonacci Cycles tool in Ensign Windows. Over 80% are direct hits. A chart has been attached showing the 180 series from the March 24th, 2000, high. The 2nd chart shows the 180 series from the July 24th, 2002, low.
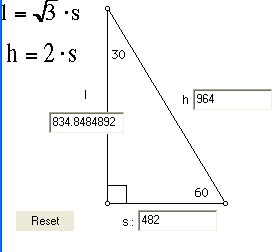
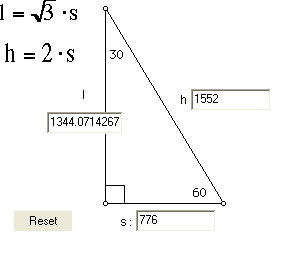
Trading Tip: by Paul Boughton The diagonal of a square with a base of 1 is 1.414, or square root of 2, or a 45 degree angle. The S&P 500 high in 1994 was 482, time 1.414 = 681 which was the next high in the SP in the middle of 1996. So we can say 681 is 45 degrees from 482, a price angle. And, 681 x 1.414 = 964 is another 45 degree price angle. (Editor's note: 482 x 1.414 x 1.414 = 482 x 2 = 964, which is the same as 482 at a 60 degree angle.)
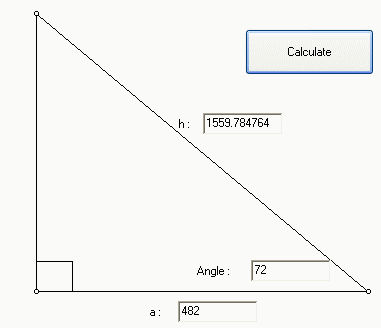
Now lets add some other angles. The diagonal of a 1x1x1 cube is the square root of 3. The square root of 4 is 2 or a 60 degree angle, and so on. The square root of 10 is approximately pi. The diagonal of a 3x1 rectangle is almost a 72 degree angle. 482 x square root of 10 = 1524. 482 x pi = 1514. 482 at a 72 degree angle is 1559 which is the all time S&P high of 1552.
On the flip side of the S&P mountain, the square root of the 1552 high is 39.40, divided by 1.414 = 27.89, resquared = 776. 39.43 x 1.414 = 55.7 x 1.414 = 78.8 x 1.414 =111.4. Oops thatís our time series of natural trading days for the 0.618 row in the table in the first article! Taking it to another level of understanding, the first time vibration was 291 bars which at 60 degrees is 582 bars or the time of the July 2002 low. And 1552 at 60 degrees is 776 which was the July 2002 price low. So we can say that price and time met at 60 degrees.
There are angles in price and angles in time and when they meet change is inevitable. Price and time are interrelated. Book Review: by Howard Arrington This article is a book review of 'Why Stock Markets Crash' by Didier Sornette, published in 2003 by Princeton University Press. The 396-page book is written for academia at an advanced mathematical level with 463 references to other scholarly books, journals and papers. The most interesting and readable chapter was the first chapter with its historical reviews of the Crash of October 1987, the Tulip Mania of 1650, the South Sea Bubble of 1720, and the Great Crash of October 1929. Beginning in Chapter 2, the author establishes the concept of the efficient stock market and that there are no arbitrage opportunities. Considerable discussion treats the hypothesis of the Random Walk and that prices are therefore unpredictable. The historical crash days are defined in Chapter 3 as 'Outliers', which means they are abnormalities on a normal frequency distribution and defy the possibility of existing based on probability. Yet it is a historical fact these crashes exist. One of the criticisms I have of the approach taken was the focus on those crashes which were short term events lasting from 1 to 11 days. Thus, the NASDAQ crash of the past 3 years in its fall from a high of 5013 on March 14th, 2000, to a low of 1108 on October 10th, 2002, is not considered. Chapter 4 introduces theories about 'feedback' as the reason why price action deviates from a random walk. Investors exhibit characteristics of 'herd' behavior and 'crowd' effect. Chapter 2 was supposedly the proof that the markets are a random walk, yet Chapter 4 and other chapters present research that proves the markets are not random. Subjects covered include informational cascades, herding at various levels, imitation, rumors and the gambling spirit. Several systems, models, and studies are presented along with their supporting theories and probability formulas. The mathematics used to model the data set is the Nonlinear Log-Periodic Formula given on page 336. This formula has several log, cosine, and exponent terms. The formula is too complex to attempt to include it in this article, and the terms and parameters would not be understood anyway. The author optimizes six factors to curve fit the formula to the Dow Jones for a 5-year daily data set preceding a crash. The optimized formula was applied to both the 1929 and 1987 crashes and claims made that the formula correctly brackets the crash dates. (page 338) The formula is applied to the Nikkei crash of 1999 and shown to have good correlation. The author does not make any near term predictions about any pending crashes or market direction. Every example in the book was already history before the book went to press in the middle of 2001. Chapter 10, final chapter, speculates about the next 50 years, presenting both pessimistic and optimistic viewpoints. I felt more material on the impact of a shrinking European and Russian population would have been beneficial. The author does discuss the impact of an aging 'Baby Boomer' population where the assets this generation has pumped into the markets and savings during their working years are withdrawn during their retirement years. I think the essence of his long term bias is that the stock market will be in a range bound period of consolidation or stagnation for a decade, and then have a period of growth acceleration that sets the market up for another severe crash with a critical time around 2050. (pages 356-7) Reviewers offered praise for the book with word like 'fascinating, mind-expanding, cutting edge, intriguing, expert and well written'. The book can be summarized as an encyclopedia of theories about stock market behavior, but I must admit I failed to see the connection between many of the topics covered in the book. This book is not about technical analysis tools that are common place in charting applications like Ensign Windows and used by day-traders and swing traders. There was a singular paragraph in the book which acknowledged that technical analysis tools such as Gann, Elliott, Fibonacci, head and shoulders, oscillators and averages appeal to a certain class of traders. The answer to the question of 'Why Stock Markets Crash' which I understood best is found in Chapter 8 about bubbles and crashes. (quote)
This scenario applies essentially to all market crashes, including old ones such as October 1929 on the U.S. market... The robustness of this scenario is presumably deeply rooted in investor psychology and involves a combination of imitative/herding behavior and greediness (for the development of the speculative bubble) and overreaction to bad news in periods of instabilities. (end quote) (page 283) |
