by Howard Arrington In literature, the 'Holy Grail' is generally considered to be the cup from which Christ drank at the Last Supper and the one used by Joseph of Arimathea to catch his blood as he hung on the cross. The term 'holy grail' has been used among traders to represent the ultimate mechanical trading system that would return unlimited wealth. Though many seasoned traders say the Holy Grail does not exist, it is a never ending pursuit of many traders to find a Holy Grail. Armed with a computer as a research tool, thousands of traders have tested their ideas against historical data sets in search of the ultimate trading system. Many ideas are marketed, surrounded by claims of phenomenal success with graphs showing the hypothetical accumulation of wealth if the system had been used to trade financial markets over the past few years. Many of these mechanical systems are promoted with 'rags-to-riches' testimonials in the advertising literature which arrives unsolicited in my mail box each week. Perhaps it has been my luck to just be unlucky. The $3000 systems I am familiar with have ended up being more phony than legitimate. Thus, my bias is more likely to embrace the philosophy that the Holy Grail does not exist. I consider the following are very valid questions to ask about any system being offered.
Sorry I do not have the answers to these questions. However, the real purpose of this article is to discuss the challenges of designing mechanical trading systems. Consideration of these principles in one's design should be helpful to those who engage in a search for the Holy Grail. 1) Type of Market We all realize that there are different types of markets, namely: trending, swing, and choppy. Different systems try to take advantage of a particular type of market, and their results look great when applied to the type of market they were designed for. These systems have poor results in the wrong type of market. System designers feel they have a great system if they can put money in the bank when the market is the right type, and break even when the market is the wrong type. Studies serve as a basis for the design of many trading system, or are used as either a filter or a signal in the system design. The following common studies have been categorized by the type of market they work best with.
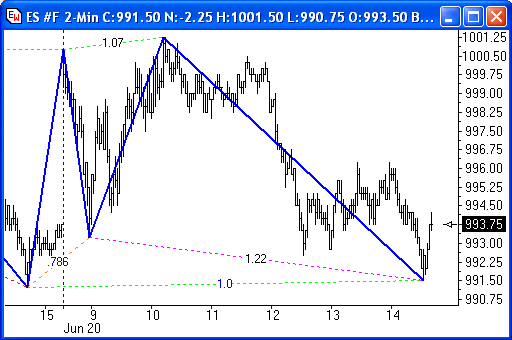
Traders often try to label the Elliot wave counts so they can anticipate the type of market unfolding, whether the market is in a consolidating wave 4 triangle, or whether a wave 3 breakout thrust is underway. They can then adjust their trading strategy for the type of market. 2) Slippage Some systems suffer from trading too frequently. Commissions and slippage costs become a high percentage of the expected gain. For example, if two systems both generate a profit of $4000, would you prefer system A that did so with 10 trades or system B that did so with 100 trades? The average trade in system A is $400 while the average trade in system B is $40. For example, if the fills in real life are one tick worse in the E-mini markets, $25 has evaporated from the average trade results, and the penalty on 100 trades is more severe than on 10 trades. Thus, a big factor to consider in evaluating a system's success record is the number of trades. Too few trades may not be statistically sound, and too many trades may suffer from commissions and slippage losses, not to mention the constant wear it is on one's emotions. 3) Emotion Emotion is one of the hardest areas to design for. The whole reason traders seek a Holy Grail is because they have had a few bad experiences in the markets, and no longer trust themselves to trade well.. They assume that the computer can analyze the facts more logically and pull the trigger more mechanically, which are areas they feel they need help with. The results look good on paper, up $60,000 for the year with the system, and the maximum draw down looks tolerable compared to the benefit. So, courage is mustered and commitment to faithfully follow the system's signals is expressed to one's friends. But what happens over the next couple weeks. Our emotions want instant success. We are unwilling to tolerate a series of losing trades. All systems eventually have a string of losing trades and a draw down in equity. Such is part of the statistical results buried somewhere in those beautiful graphs of wealth accumulation. However, a graph of past performance is emotionless. The real thing, with my money on the line, is 100% emotion. When I am ahead I am elated at how easy it is. When I am behind, I start to second guess every signal and think I am smarter than the system, and I can improve on the trading system by applying my experience. Surely I am aware of intangibles the system failed to consider. For example, does the trading system know what is the correct thing to do when the news is showing horrifying pictures of planes flying into tall buildings, or war has broken out in the Middle East, or the dock workers have decided to go on strike, or Greenspan is speaking before Congress? Suddenly we convince ourselves we know more than the Holy Grail system, and we abandon it as we seek a place of greater personal comfort. It is easier to design a mechanical system than it is to actually trade it! I know... I have been there and done that. 4) Now you see it, now you don't One problem when doing analysis on a daily data set is the urge to jump the gun and execute a new signal during the day. For example, you may see study lines cross during the day, which would constitute a signal, and you want to execute the trade now before the market runs away from you. However, signals based on a daily data set only know the four prices of Open, High, Low and Close. During the day the Open is known. However, the High and Low are moving targets. And the Close in not known until the market closes. To execute any trade based on a signal during the day is to jump the gun. Though you see the signal intra-day, the signal conditions will often undo themselves. For example, a simple signal might be when the Close is above the Open. When the market is putting in new highs, the signal condition is True. However, the market can turn around and put in new lows wherein the signal condition has reversed to being False. Signals which incorporate the Close price either directly or indirectly through studies should analyze through the last completed bar on the chart, and avoid giving a signal during the time period the current bar is under construction. Otherwise they will suffer from the "'now you see it, now you don't" challenge. 5) Moving target One of the unique studies in Ensign Windows is the Pesavento Patterns tool. The program uses its set of proprietary rules to identify swings and label them with their percentage of retracement when compared to other swing. The problem with using a study like this for a signal is that the target can move, as illustrated by this sequence of 3 charts.
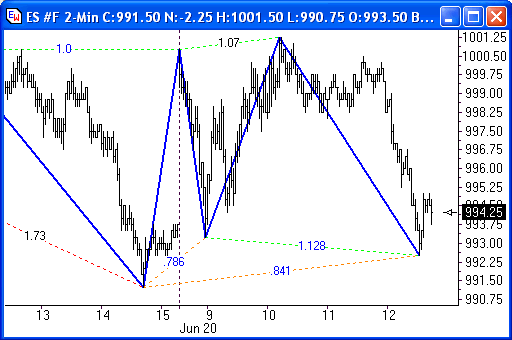
Here the price has dipped to a swing low of 992.50, and the swing ratios are favored 1.128 and .841. One might think there is a Buy signal in effect because of the ratios and the pattern. If the markets were to rally, buying the apparent signal would look like a stroke of genius. Now consider what happened.
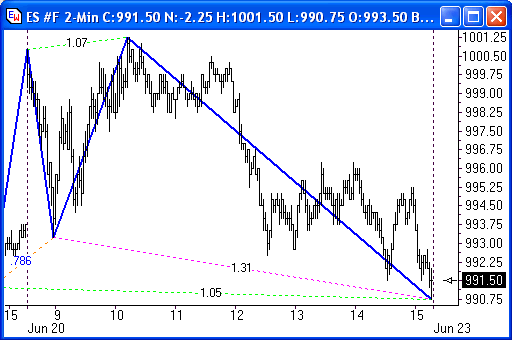
The market dribbled higher in sideways chop between 12:30 and 14:00, then fell to a new low at 991.50. The Pesavento Pattern tool adjusted to used the new swing low. At 991.50 we have another favored ratio of 1.0 for a double bottom. Do we have a buy signal at this double bottom? Well consider what happened next.
The market traded lower into the close and the Pesavento Patterns tool adjusted again to this new swing low. None of the bounces off of the prior swing low points were of sufficient amplitude to qualify as a new up trend because our minimum swing size parameter was set for 5 points. Fluctuations under 5 points in size are being ignored by the Pesavento Patterns tool. The tool illustrates a general problem where it is easier to see things with the benefit hindsight. This can be said about most divergence patterns. It is easy to see the last divergence where the market finally turned. It is easy to overlook other divergence patterns that existed at the time, but were not the ones to be traded once additional bars were added to the chart and they became obscured by a subsequent pattern. Often the patterns we seek to identify, the divergences, the study lines crossing, are a moving target. In hindsight it is easy to say, "Of course, there it is, I see it" yet in real-time we are frustrated by seeing similar patterns and signals prematurely in the moving target. If we wait for the signal to be confirmed we are often late in our execution. For example, it will be 5 points after the fact before we know for sure the current Pesavento Pattern is not going to adjust again to a new lower low. 6) Interior sequence
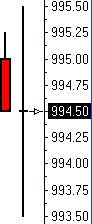
So in back testing, is the buy signal at 994.50, which would be the case if the market opened, and then went to the low of 993.50 and then rallied back to 994.50? Or is the signal at the high of 995.50, which would be the case if it rallied from the 994.50 open to put in the high first? We cannot tell. We simply lack the detail of knowing the interior sequence of how the bar came to be. The only thing known about the bar are the four fixed prices of its Open, High, Low and Close. Another illustration of the interior sequence challenge is this. Let's assume the Buy signal was one tick higher than the high of the bar on the left. The buy trigger would be a known price of 995.50, and since the bar traded at that price, we can assume the position was filled. Now suppose our protective stop is an automatic 2 points below our fill price. Are we in or out of this trade on this bar? The answer all depends on the sequence. If the Low was put in prior to the High, then we have not been stopped out. If the Low was put in after the order was executed, then the position is stopped out for a loss. What happened is uncertain because the detail of how the bar was constructed is unknown in the historical data set. 7) Execution price I often find fault with the price chosen for execution. A trading system I recently looked at used for its Sell price the High of the bar following the signal. What a phony deal! Using the High of any bar is biasing the sell statistics to be executed as a most favorable and unlikely price. Likewise, using the Low of any bar as the execution price is biasing the buy statistics with a favorable and unlikely price. My opinion is that the execution price should be the Open of the bar following the signal. A second choice could be the Close of the bar that generated the signal. While this is a fixed price in your historical data set, it is a moving target in real-time and leads you to anticipate the price or the signal just prior to the close of the bar. We have already talked about this challenge in our "Now you see it, now you don't" discussion. Another consideration is whether the execution price is a study value, such as a Parabolic Stop value, or a bar price such as its Close. When a bar touches the Parabolic Stop, did you have a buy or sell stop in place to execute your trade? That is fine if your system was designed for the trigger to be the Low or High of the bar touching the stop, as opposed to the bar closing across the stop. If your signal is based on where the bar closes, then the execution price should be the bar's Close price and not the study value. Also, the study value might be unrealistic if the bar gapped across the line, in which case the Open price of the gap bar should be used as the execution price. 8) Time of day Many day traders want a system that incorporates the time of day in its consideration. Some systems are designed to avoid the choppiness of the market open. Others may want to consider avoiding new trades near the close of the day. Some systems will want to exit all positions ahead of the market close. I find fault with scalping systems that establish trades just prior to market close, are blind to all Globex activity, and then exit at an excessive profit objective at the following day's favorable gap open. My opinion is that scalping systems are day trading systems and their statistical results should not include holding positions overnight, nor be blind to the Globex trading if a position is held past the day session close. 9) Optimization The computer lends itself to endless number crunching. System designers adjust parameters endlessly in an effort to tweak more performance out of their idea. They will adjust study parameters such as the number of bars in a moving average, adjust trigger thresholds such as CCI crossing 100, adjust entry and exit rules, and adjust slack parameters such as a stop offset from a bar high or low. The number of possibilities is mind boggling. The billions of calculations, permutations and combinations are unfathomable. When it is all said and done, the author announces the greatness of his work, expounds on the difficulty of the project and the cleverness of his creativity. A price tag is picked, advertising hype assembled, and marketing efforts directed at would be buyers. The problem is that the system performance is often over optimized in an effort to tweak great performance out of the historical data set used to design the system. When I started Ensign Software 22 years ago, one of my first products was the CAT program (Computer Analyzed Trading). It basically was a High/Low stop concept with an optimized slack value for each futures symbol. CAT had an optimized slack value for Japanese Yen, a different slack value for Gold, and a different slack value for Live Cattle. The idea was to put the good trends in the bank, and hold its own in choppy markets. A really good trend came along in each market a couple times each year, and the impressive wealth accumulation was to catch those trends and put them in the bank. The other 9 or 10 months of the year, the small winners would balance out the small losers. The downfall of the system was over optimization. Trading the program signals in real-time did not amass the same results as the back tested results. Why? It took a long time for me to admit to what the problem was because of my ego. The system was being optimized to find a slack value for each market such that the stops would be far enough away to optimally avoid whip lash. This meant we back tested tighter stops (enter and exit the trade sooner for more profit per trade) and wider stops (try to avoid whip-lash). Somewhere between these conflicting objectives would be some slack values that would show positive returns in the back testing results. The finely tuned slack values that generated 80+% winning trades, were valid for the historical data set the analysis was done on, but were not necessarily the best values to use for the immediate future. The hope was, and it was definitely just a hope, that the past would repeat itself in the future and so the optimized parameters should continue to work. Sometimes they did, often they did not. When you see advertisements showing stellar results, please realize that the graphs and reports show Optimized settings, optimized for the past. And wisely the small print says, "Past performance is no guarantee of future performance." Trust me... future performance will be worse than the past performance because the past was optimized. 10) Just one more rule The dilemma with every system designer is that their work is never done. They are plagued with the perpetual need to add just one more rule to handle just one more situation that just came up in today's market that was not handled as profitably as it should. If only we had one more rule too keep us out of that losing trade today, then the system would be perfect. So one more rule, one more exception is incorporated into the system. But the process is repeated over and over again as the original pure idea evolves into a different beast. One more rule is just another form of on-going optimization. Often this type of optimization is based on what happened today, and not on thorough back testing. I have seen systems that worked in general and were statistically proven through back testing, become specialized and cease to work at all because of the addition of rules to handle special situations. Rules get added to avoid opening gaps that exceed a certain threshold, or to avoid trading during certain windows of time during the day, or to increase the trade size if a particular formation is seen, etc. Too often the rules use specific hard coded values instead of being generalized so they auto adapt to different instruments or auto adapt to calmer or more volatile markets. I guess the lure to harvest more money from the field of opportunity will keep the Holy Grail seekers forever employed. Not all will agree on the ideas on which different mechanical system are founded. One trader shooting for the moon might be confident even when a big position is against him 20 thousand dollars, while other traders would be financially and emotionally wiped out. We each have a different 'risk avoidance' threshold and comfort zone. May each of you find a methodology that fits your personality and pocket book, and helps you be successful in your trading. Research: by Howard Arrington Ensign Windows has a powerful programming language called ESPL. This Delphi (Pascal) like language can be used to implement proprietary studies, draw tools, alerts, reports, and program control. This article will demonstrate using ESPL to develop a trading system and back test its performance. Consult the Ensign web site for information about ESPL and for the ESPL programming manual, http://www.ensignsoftware.com/espl/espl.htm Our trading system must be kept simple for the sake of being a teaching example. Yet, it will demonstrate many of the design principles that would be used in designing any trading system and back testing its performance. Let's begin by outlining the characteristics of the example trading system.
The structure of the ESPL program will be like this. Each section will be developed, and then the program will be shown in its entirety.
Initialize The Initialize procedure will be where variables are initialized prior to calculating the trades and accumulating the results for the report. ESPL has the ability to trade our trades and generate a report. The ResetTrades statement is used to define specific Trading System values. The statement is used in conjunction with the Trade, and TradeReport commands. ResetTrades is used to initialize a Trading System. The statement prepares a file to receive the Buy and Sell trades specified by the Trade command. The Commission per contract or per share is specified. The style of the Arrows (marking the trades on a chart) is also specified.
Calculate The Calculate procedure will find the chart, clear it of all studies and markers, put on the Parabolic stop, and loop through all bars in the chart file and make trades based on the rules for the Buy and Sell signals.
Report The Report procedure will close out the current position, and print a report in the Output window on the ESPL editor form.
Exit Rules For this simple trade system, a position will be exited when it has hit the protective stop or when it has achieved the scalp objective.
Signal Logic This trading system will watch for higher highs and lower lows to determine swing points. The Parabolic stop will be used to determine the trend. When in an up trend, the signal will be a bar whose High is lower than the swing high. When in a downtrend, the signal will be a bar whose Low is above the swing low. Execution will use the Open of the bar following the signal bar. The Exit Price objective will be the entry price plus a scalp size. The protective stop price will be the entry price minus the stop size. The scalp size and the stop size were variables set in the Initialize procedure and can be adjusted to test the profitability of different settings.
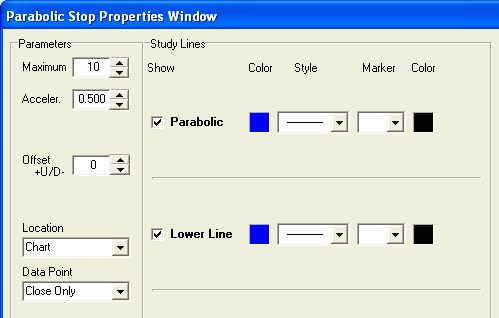
Full Program Cut and the text from this newsletter and paste it into the ESPL editor form in Ensign Windows, or use the Internet Services form to download the script file from the Ensign web site. Open a chart, such as 3-min ES #F, and apply the Parabolic Stop study. For my tests, I have reduced the Acceleration rate and Maximum limit on the Parabolic parameters so the study indicates the bigger trends and has less whip lash. The Parabolic Stop will be used as the indicator for the trend. The trading system only takes Long trades when the Parabolic stop is rising, and Short trades when the Parabolic Stop is falling. After changing the Parabolic Stop properties, check the Use as Default check box so these parameters are used as the default settings.
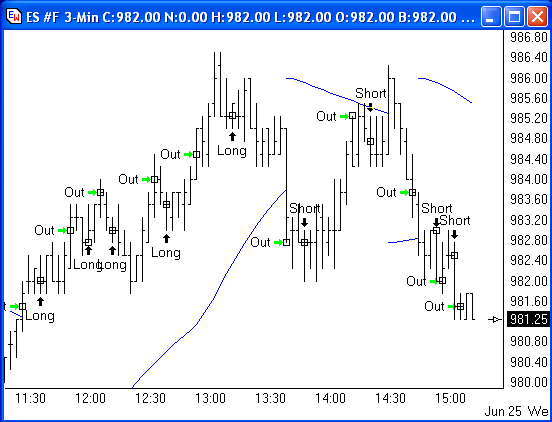
Back Test Results For all tests, a $10 round trip commission will be used. The chart being tested is the 3 minute ES #F. The data set has been limited to Day Session Only data for the three dates of June 20th, 23rd, and 24th. For the first test, let's try a small scalp objective of one full point, and a generous stop size of 2.50 points. The following are the back test results, and the chart shows some of the trades. ES #F Profit Trades Average Ratio
79% of the trades were profitable scalps, but the Net Profit is only $220 after paying commissions on 43 trades. Let's try a bigger scalp objective, knowing in advance a lower percentage of winning trades will be achieved. The following results are for a scale objective of 2.50 points. ES #F Profit Trades Average Ratio
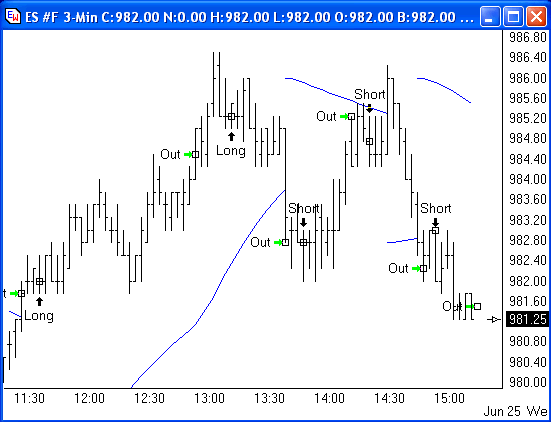
The larger scalp objective generates more profit, on fewer trades, which is good on both points. Further testing could be done with this trade system to determine whether one should use a tight or a generous stop, and whether the scalp objective should be large or small. The parameters for the Parabolic stop should also be adjusted to see the impact it has on the trade system. Finally, the system should be tested using more data to simulate a wider variety of market conditions. Some may wish to modify the logic for the Buy and Sell signals to test other ideas. The tools are available in Ensign Windows for designing trade systems and the effort can be both rewarding and fun |
 Another
challenge in back testing a signal idea is the loss of
detail in looking at historical bars versus knowing a real
time tick sequence. Consider a signal where we want to buy
when the market rises 1 full point. In this bar example we
do not know whether the High was put in before or after the
Low.
Another
challenge in back testing a signal idea is the loss of
detail in looking at historical bars versus knowing a real
time tick sequence. Consider a signal where we want to buy
when the market rises 1 full point. In this bar example we
do not know whether the High was put in before or after the
Low.