by Howard Arrington Leonardo de Pisa de Fibonacci (born around 1170 in Pisa, Italy) was a mathematician who studied the Great Pyramid at Giza and discovered a number series which we now call Fibonacci numbers. The number in the series is the sum of the two previous numbers, and includes the set 1, 2, 3, 5, 8, 13, 21, 34, 55, 89, and 144. Dividing one number by the next after the 8th sequence yields 0.618, which happens to be the relationship of the height of the Great Pyramid to its base. Another relationship is that the next number in the sequence is approximately 1.618 times the preceding number. These relationships are also a Fibonacci number series: 0.382, 0.618, 1.000, 1.618, and 2.618, etc. Fibonacci numbers are valuable because these numbers and relationships are found everywhere in nature and in the markets. Frequently the magnitude of a wave will have a Fibonacci relationship to the magnitude of another wave structure. A wave's magnitude is determined by measuring the price range from a significant top to a significant bottom. The magnitude of a Trend wave might be 1.618 times the magnitude of the previous Retracement wave. A corrective Retracement wave might be 0.618 times the magnitude of the previous Trend. Larry Pesavento shows in his book 'Profitable
Patterns for Stock Trading' that two additional ratios
are frequently found in the markets. These ratios are the
square roots of the two primary Fibonacci ratios. The
square root of 0.618 = 0.786, and the
square root of 1.618 = 1.272. Larry uses
these two additional relationships, 0.786 and 1.272, because
not all waves are a ratio of 0.618 and 1.618, or the other
common ratios of 0.382, 0.500, and 2.618.
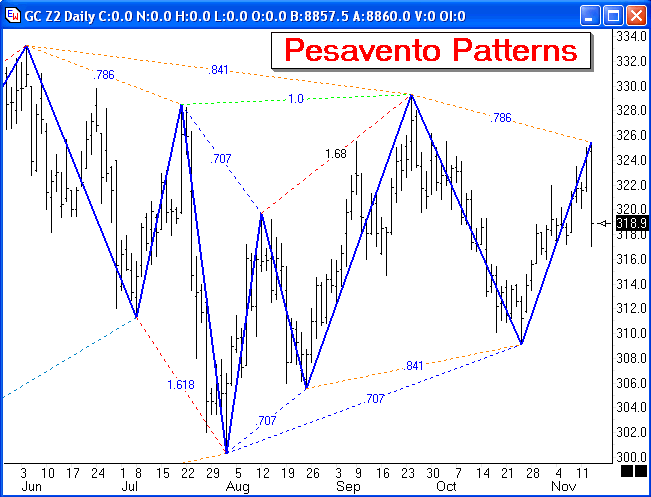
A powerful feature in Ensign Windows automatically finds major swings and labels the swing relationships with their retracement percentages. The patterns are called Pesavento Patterns in honor of Larry Pesavento who has studied these relationships for 4 decades and published a book on the subject: 'Fibonacci Ratios with Pattern Recognition'.
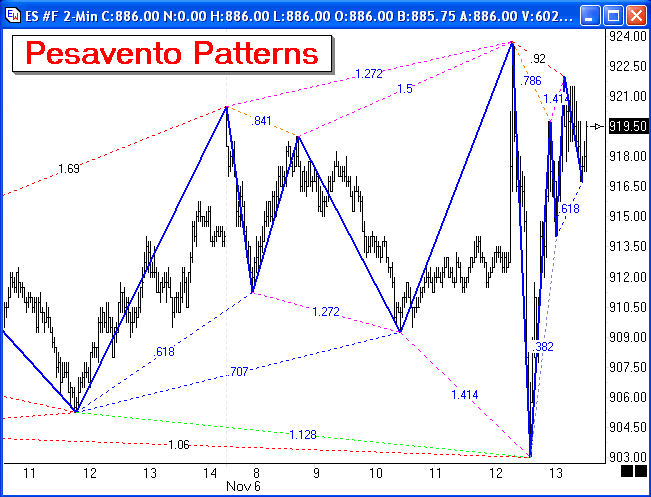
In this chart showing 2 minute bars for the ES e-mini contract, note the large number of relationships whose ratios appear in the Table of Relationships. The blue labels are Key Ratios followed by Larry Pesavento. The swing ratio was within 4% of the blue label's value. The 3 black labels are actual swing ratios that were not within 4% of the key ratios. 80% of the swing relationships marked on this chart were key ratios. The trading tip being taught is that markets turn at these key ratios. Note that many of the turns had multiple relationships at the key ratios. For example, the sharp drop to 903.00 was 1.414 times the size of the prior swing, and also a 1.128 extension measured from a prior swing low as shown. The Pesavento Patterns tool in Ensign Windows finds and labels all of these relationships.
Larry Pesavento's web site is www.tradingtutor.com where he gives trade recommendations and commentary on the markets. The following charts and commentary from Nov 13th, 2002, are typical of how Larry uses the Pesavento Patterns to analyze the markets.
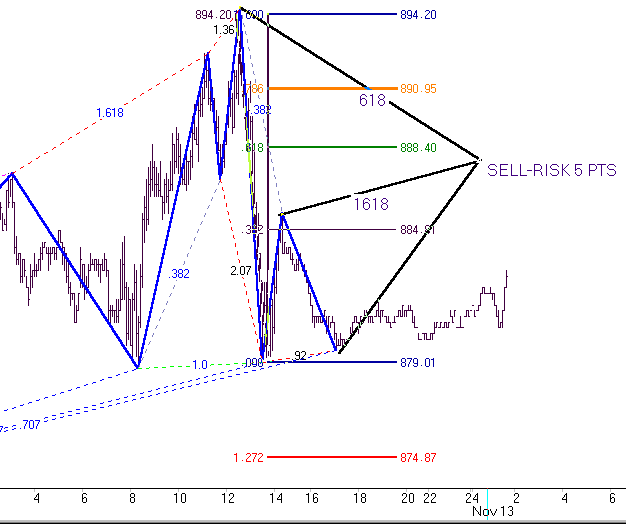
Here is another example of Larry's use of
Key Ratios to establish his game plan prior to market open.
This example is using 5-minute bars on the ES e-mini
contract and shows a portion of one of Larry's charts. The
3 heavy black lines were manually drawn and labeled by
Larry. 
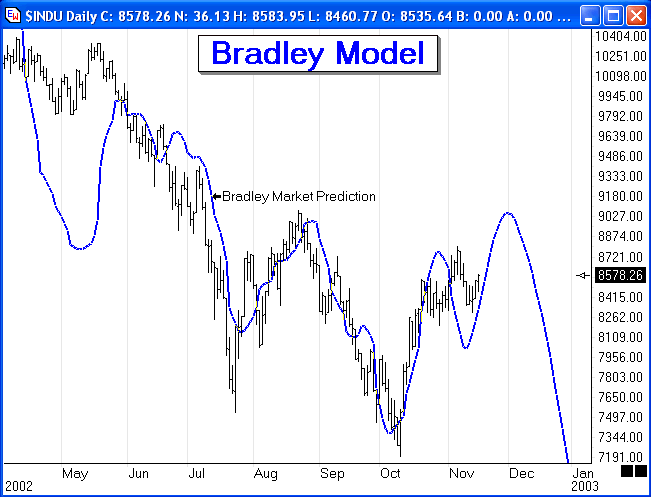
Article: by NQoos aka Jim Swartz 1- Get Ensign Windows You can play back any day to practice. Buffy is often available in the B-Line chat room for great commentary and instruction on high % setups. Ensign Windows is the best tool an unprofitable trader can have. If you already have another charting program get Ensign also. Its only $39.95/month. Better is to also get a real-time data feed. If you’re still working a 9/5 job as you learn you can trade the playback anytime. 2- Only trade with Sim-broker in Ensign Windows...no real $$ trades allowed. Great to have arrows automatically placed on chart showing all your entries and exits. When you’re done it will show how many trades you took, % winners and total profits. Really GREAT. 3- Trade only 1 setup, high % trade with the trend. Flag break...1-2 bar setup----slingshot. MOF or whatever works for you. Find your high % trade setup. 4- Keep all screenshots and Sim-broker results each day. Study your good and bad entries and exits. 5- No posting allowed in chat rooms. Most unprofitable traders can't concentrate on trade execution/management and post at same time or simulate trade and learn effectively at same time. Chat rooms can be a great place to learn from moderators and some posters that explain why they entered and exited a trade. Chat rooms can offer a wealth of trading related information. Unfortunately there is also a wealth of misinformation dispensed in chat rooms. So...verify all yourself. 6- After market, mark trade entries and exits you missed or those that would have maximized your bottom line. I believe marking charts trains the brain to see it easy and fast in real-time. When you can show 4 profitable weeks in a row, you’re ready for a new setup high % trade and can trade for $$$. Article: by Larry Pesavento In 1946, Donald Bradley wrote a small paperback book entitled Stock Market Predictions. It cost a whopping $4.00 (which in 1947 was a lot of money). Llewellyn Publications from Minnesota sold very few copies. Bradley only included 2 years of data for the book from 1947-1948. The book was not mass marketed and laid in obscurity for many years. During the transition years from pattern recognition into astrology (I have returned in earnest), the book was given to me by one of my mentors Dr. Ruth Miller of Indiana. The importance of the little pamphlet would not be revealed to me until 1987. Astrology had pulled me into its intricate web and I was writing Astro Cycles a Bi-Weekly publication featuring stock indices and commodities. The astrological data I was using came from the Astro Computing Company of San Diego, California. Neil Michelson, the owner, had become a good friend and introduced me to many aspects of astrology that I wasn't even aware they existed. When I mentioned the Bradley book and the sidereal graph, Neil volunteered to run the tests to see if it could pass rigid statistical study. Good financial data was not readily available until 1876, ten years after the Civil War. I remember this well because I was only 10 at the time. Neil proceeded to run all years from 1876 to 1987. The results were amazing! Although it didn't work every year, statistically it was better than 65% predictable at forecasting the trend of the stock market for the year. What is truly incredible is the fact that you can do these trends decades in advance. Why it works is an elusive answer. It is the reason I came back to pattern recognition. The chart patterns repeat and are predictable within a chaotic market environment. In order to keep it simple I found that the ratios and patterns are what makes it tradable and profitable. The Bradley model has been programmed by our friends at Ensign Software and will now be featured as a weekly segment of my Trading Tutor newsletter. Those of you in search of answers about what may cause this should read Dr. Al Larsen's classic book, My Electric Life. The book describes a theory of electron magnetic energy that sure makes sense. It should be in everyone's library (only $25.00). The chart below demonstrates the Bradley Stock Market Model laid over the Dow Jones so that you can compare the astrological forecast with the markets performance in recent months.
|
||||||||||||||||||||||||||||||||||||||||||||||||||||||||||||


