by Howard Arrington We all seek a leading indicator that gives advance notice of what the market is going to do next. I have been watching the interaction of JNPR (Juniper Networks) and the June Nasdaq futures contact. At several key turning points in NQ M2, I see that JNPR is already leading the way, giving advance notice of what the NQ M2 market will do next. Permit me to share with you a three day sequence in comparing both charts using 5-minute intra-day bars.
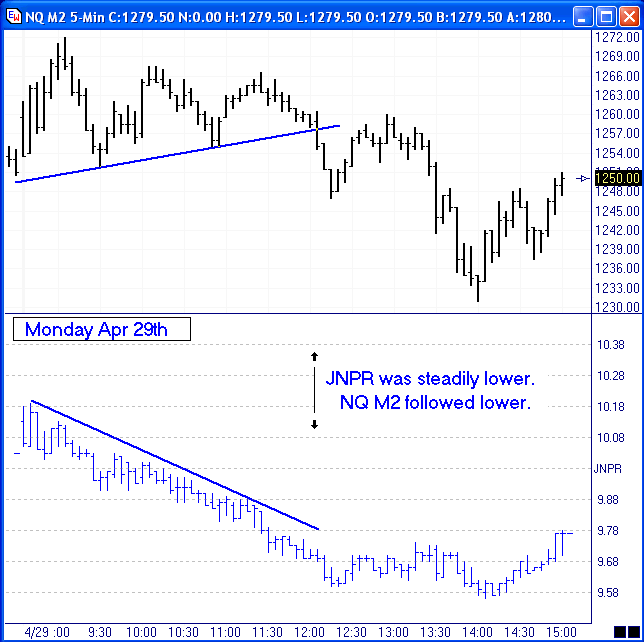
On Monday, NQ M2 formed a wedge from the open until 12:00 (noon Central time). The question in the minds of NQ traders was whether the breakout from the wedge would be up or down. The JNPR chart was steadily lower all morning serving as an advance indicator that NQ would be going DOWN and not up.
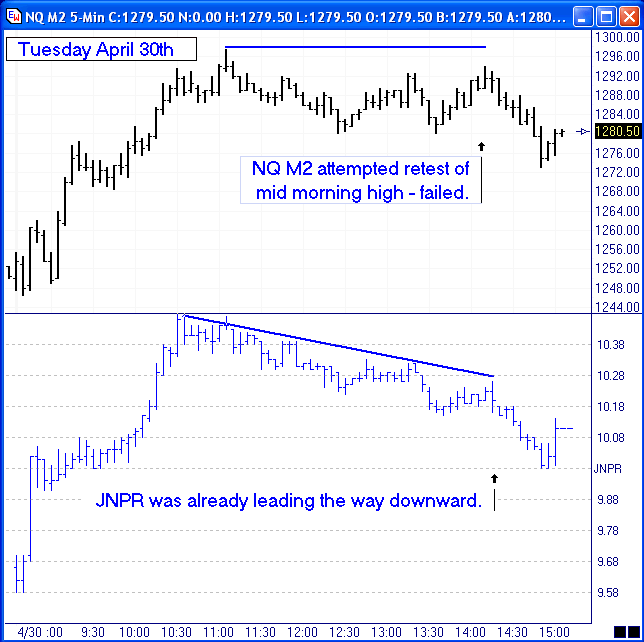
On Tuesday, JNPR and NQ M2 both rallied until 10:30. NQ M2 put in a new high at 11:05, but JNPR did not. This is a first BIG clue that the 11:05 top in NQ M2 was going to be the daily high. At 14:10, NQ M2 was pushing higher for a possible retest of the 11:05 high, but JNPR was definitely in a downtrend. JNPR's 14:10 rally was nowhere near its mid-morning high. Again, JNPR served as an advance indicator that the NQ M2 retest of the high would fail, and NQ M2 would go lower.
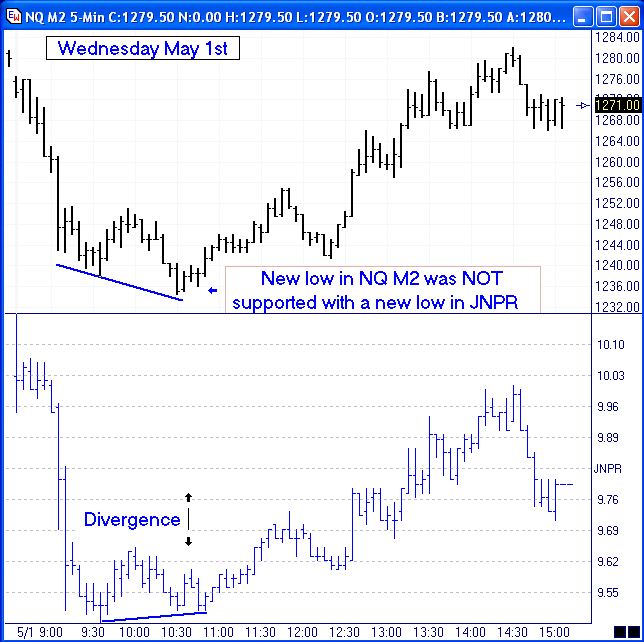
Wednesday opened with a sharp sell-off in both JNPR and NQ M2. They both put in lows at 9:35. NQ M2 put in a new lower low at 10:30, but JNPR found support and did not put in a new low. Again, JNPR gave advance notice that the market would not continue lower. See the divergence that is marked on this chart. From the 10:30 lows, both JNPR and NQ M2 experienced significant rallies. Have I found the crystal ball for NQ in the
form of JNPR? I doubt it. Useful correlation found (with
the benefit of hindsight) on three charts is not
statistically sound. However, the trading tip being taught
is that an individual stock may respond a bit quicker than a
composite index. JNPR is a heavily traded Nasdaq stock, and
I am seeing useful correlation where the e-mini Nasdaq
future follows the direction set by JNPR. At least in the
three day sequence documented in this article, JNPR was a
worthy leading indicator. There was significant divergence
at three key turning points in comparing JNPR behavior at
these tops and bottoms with the NQ M2 behavior. NQ M2
followed the JNPR lead either higher or lower. When NQ M2
tried to go higher but JNPR was going lower, NQ M2 turned
around and went lower. When NQ M2 tried to go lower, but
JNPR would not follow lower, NQ M2 turned around and went
higher. This is just the type of leading divergence
indicator sought after by analysts who use studies to show
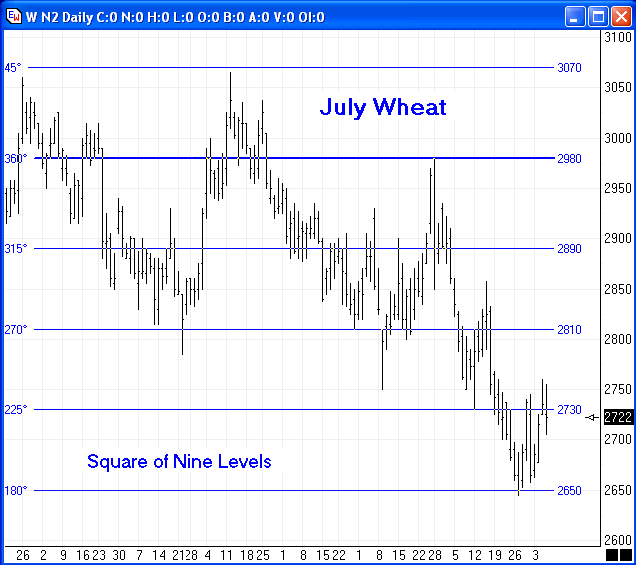
confirmation and divergence. Trading Tip: by Howard Arrington Appreciation is expressed to Greg Corbin for sharing this amazing chart of July Wheat showing the Gann Square of Nine levels marked on the chart. Note how frequently the market turns on one of the 45 degree intervals on the Gann Square of Nine.
The Square of Nine is a spiral of numbers on a grid, starting with 1 in the center. The spiral gets its name from the first inner square counting to nine. The left side horizontal is known as the zero or 360 degree line. 90 degrees would be the prices that align vertically above the center point, and is measured clockwise from the zero line. Example beginning of the Square of Nine number spiral: 31 32 33 34
35 36 37 The number series continues to spiral outward to ever increasing values. Eventually the values shown on the chart are discovered on the Gann Square of Nine. On the Square of Nine the number 2650 is on the 180 degree ray, and the number 2980 is on the 360 degree ray. The Gann Square of Nine is a tool available in the Ensign Windows program. Analysis: by Dom Concilio Part I Does history repeat itself? Is there something to MOON PHASES, TRIPLE WITCHING, LUNAR and SOLAR ECLIPSES? What about FOMC DAYS, or WEEKS, or any other possible repetitive/cyclical possibilities you can think of? What of PATTERN RECOGNITION, and PROGRAM TRADING? Is there really anything to all this stuff, or is just another bunch of hocus pocus? Did you know that, since 1982 (the first year the SP FUTURES started trading), FULL MOON TRADING DAYS in AUG close NEGATIVE 76% of the time? Here are the only times in SP history that the FULL MOON was on a Thursday in August.
Tip: This year the FULL MOON is on Thursday, August 22, 2002. I've invested in the markets for some years now. At one point I was getting a little bored. So a friend of mine suggested that I check out a website www.programtrading.com. It was back in 1997 and I read all this stuff about when the CRASH was coming. The site wrote about some Monday in October, and that it was the Anniversary of the Crash of 29, that it was some color and some moon thing and some other stuff. I said to myself, "sure". October came and guess what? Yes, we did have a market drop of over 7%. And Yes, it was on the date that was mentioned on the website. So I decided to check out one of these Program Trading Seminars. This is the 5 minute chart of the "CRASH OF '97"
This seminar changed my whole view on things. I proceeded to gather all types of historical data, and created a database of many things. There was a problem however, in that I couldn't get the historical charts to look at all like what I am used to looking at every day. I spent some time developing this database, but yet could not apply it in a simple way. The simplest way for me would be to be able to print out historical charts that would match my existing real-time software. I've used Ensign Software since 1997, and I have found that there is no better software in the world for me. It's so easy to use and so easy to SEE. So I set out to create a charting software for historical data that could do what I wanted it to do. A software to give me the flexibility for viewing and printing that I needed. AND one that had no limitations with regard to sizes of data files. Now with this software I can print out any charts I want and it is if I just printed it from today's trading day. I found this to be Very Powerful. It's like having duplicates of the same photo. Is it real, or is it just a random walk? Expiration Fridays in December close POSITIVE 80% since 1982. That's 16 of 20. Knowing this, wouldn't you want to have a printed chart of every one of them, in your preferred time frame, and it looks just like what you are looking at real time? These are 2 of the December Expiration Fridays. GDP report was also released these days. Yes, it was the only times that the GDP was released on EXP Friday in December.
Tip: I believe that this year, Expiration Friday is 12/20/2002. And I believe that GDP will be released the same day. How about this? When Expiration Friday in December is on the 15th of the month, (3 times in SP history), there were 3 of the 4 times that a December Expiration Friday closed NEGATIVE. The HIGH of the morning was 8:35 am. Wouldn't it be nice to have those charts printed out and at your fingertips? Historical research. It's a lot of fun. I was on a plane one day with a friend of mine. We were on our way to another one of these seminars. While we were waiting, I started doing some research on that particular trading day. I said, "Hey Tom, look at this. Almost every one of these days sell off after the first hour of trading. Let's call this in". So I called the broker from the plane, and instructed him to sell some S&Ps at around 9:30, and put a stop above the high of the day. Then I told him to tighten stops at lunch, and look for the lows of the day to be in the last hour. He complied. When we got off the plane and got all our things together we gave a call to see how we made out. That day was April 14,2000. The high of the day was 9:15 and the low of the day was 2:50. The S&P dropped 88 points that day. Needless to say, we were quite pleased.
(Editor's note: Dom's article is lengthy, but very intriguing. The balance of his article will be published in the June 2002 issue of the Trading Tips newsletter.) |


