by Howard Arrington In May of 1999, my good friend Larry Pesavento sent me his new book, 'Profitable Patterns for Stock Trading'. While the entire book is informative, it was the chapter on 'The Non Random Nature of Chaos Theory' that caught my attention. In this chapter, Larry gives a brief history of his introduction to neural networks in 1992, and his subsequent consuming research with neural networks. The neural network forecasts that Larry has shared with me over the past few years have been impressive, even down right profound. Neural networks have been used as an expert system in stock market forecasting with astonishingly accurate results. We all want to have tomorrow's Wall Street Journal delivered today, and perhaps neural networks are the closest thing yet to having a crystal ball so we can see tomorrow today. A Neural Network is a mathematical system loosely modeled on the human brain. A neural network attempts to simulate market behavior using sophisticated software which has multiple layers of simple processing elements called neurons. Each neuron or node is linked to other neurons with varying coefficients of connectivity that represent the strengths of these connections. Learning (training the network) is accomplished by adjusting these strengths to cause the overall network to output useful results.
Since neural networks have a strong similarity to the human brain a great deal of the terminology is borrowed from neuroscience. Artificial neurons are the basic unit of neural networks. Although biological neurons are more complex than the artificial neurons, the artificial neurons simulate the four basic functions of natural neurons of accepting input, analysis, feedback, and generating output for other neurons. The basics of an artificial neuron are shown in this figure.
In the network each neuron receives various inputs, each multiplied by a connection weight. In the simplest case, these products are summed and processed through a transfer function to generate an output. The neurons are interconnected and processing may pass through multiple layers of neurons before arriving at the final output. The minimal network structure would have an input layer, a hidden center layer, and an output layer.
Neural networks can be designed in many ways, but all are constructed from the basic building blocks. You should start with a commercial software package for creating neural networks because the mathematics involved are very complex. Then your challenge as a researcher will be to go through a period of trial and error in the design decisions before coming up with useful results. The design issues are complex and useful results may elude anything but a serious effort and commitment. These design issues must be given thoughtful consideration when creating a neural network:
Issues 1) and 2) are configuration parameters that are set in the neural net software program. Issue 3) is accomplished by allowing the network to learn the appropriate connection weight values by using a training data set. The majority of the work involved in working with neural nets will be in the preparation and maintenance of training data sets. The biggest challenge is issue 4), the selection of inputs and outputs for the neural network. Obviously some inputs will be more worthwhile than other inputs. What is not obvious is knowing what those inputs should be. The process of designing a neural network is an iterative process. Just like the brain which learns from experience, neural networks learn by changing its connection weights until it learns the solution to a problem. The weight-value for every neuron to neuron connection is stored or memorized so the network can process a new set of inputs to generate a predictive output. The system needs to be retrained on a frequent basis so that connection weights can be adjusted to incorporate new knowledge. Neural nets have the ability to generalize. The training data sets teach the neural net to recognize more than just what has been seen in the past. A neural net can discover characteristics about the training data sets that may elude our perception. While market movement may at first glance appear to be random, neural nets demonstrate that markets are not totally random. There are waves, vibrations and patterns that repeat. The value of the neural net is its ability to digest massive amounts of data and perform hundreds of thousands of calculations to discover the market's intrinsic characteristics, and generate useful predictions. Do I have the 'crystal ball' yet? No. I feel I am like Galileo who put two glass pieces on the ends of a tube and discovered with his crude telescope he could now see something he could not discern before. Was Galileo's first telescope the 'crystal ball'? No. Through time and effort, telescopes evolved into better instruments with greater power, with an occasional radical new design. Neural nets are a work in progress as new inputs are considered and more research is performed. The end objective is greater accuracy and correlation between tomorrow's forecast and reality. Some days the forecasts are very accurate and give the advantage of knowing in advance where and when the markets will turn. On other days, however, the forecasts are not worth the paper they are printed on. The goal of every neural net researcher is improved accuracy and a reduction in the frequency of occurrence of worthless or misleading forecasts. I won't tell you the specifics of where I am at in my personal evolution with neural nets. I will pass on a few tips to help you get started if you are inclined to seriously investigate neural nets.
The next chart shows an intra-day forecast for January 22nd, 2002. The forecast was made in advance for the entire day.
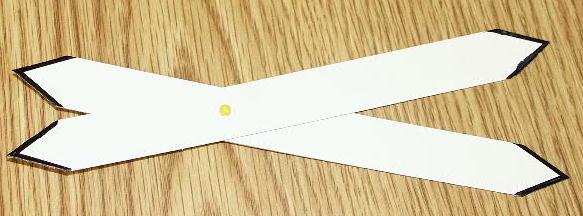
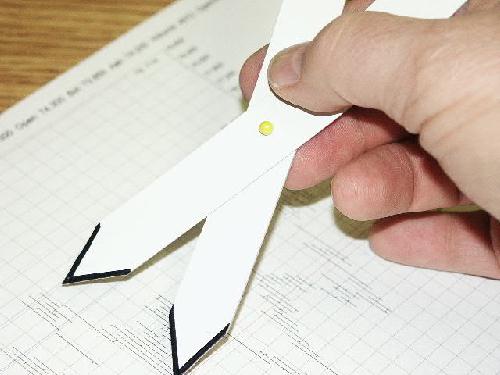
Appreciation is expressed to Dr. John Arrington for permission to publish the two chart examples which are the result of his research over several years with neural networks. His research is focused on the live cattle markets for his personal trading. He does not have anything to discuss, share, or sell. So please respect his privacy. Study Tip: Fibonacci dividers are two rods joined with a pivot like
a pair of scissors and pointed on both ends. The pivot
point is located at 61.8% of the length of the rods. A pair
of Fibonacci dividers can be made from a 10 inch dinner size
plastic plate and 2 map pins.
Use the Fibonacci dividers to measure 61.8% relationships:
Use the Fibonacci divider to measure 161.8% relationships:
Fibonacci dividers are a convenient tool for measuring and projecting Fibonacci relationships. The dividers can be used in the vertical direction on a chart to measure price relationships, or in the horizontal direction to measure time relationships. |