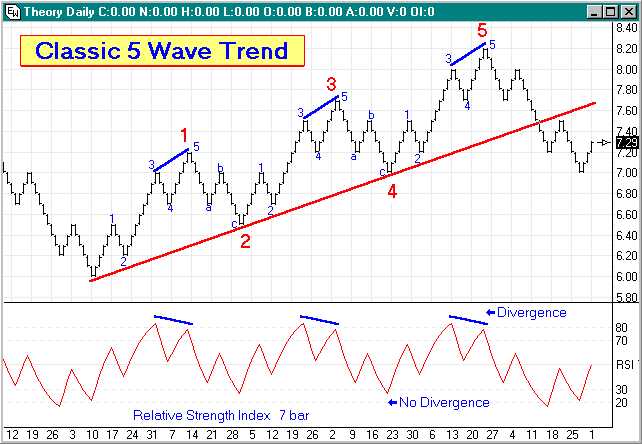
by Howard Arrington The August 2001 issue of the Trading Tips newsletter introduced the use of a theoretical Elliott wave formation as an aid in understanding the fundamental behavior of a study. The theoretical formation will be used this month for understanding the Relative Strength Index introduced by J. Welles Wilder Jr. in his book, "New Concepts in Technical Trading Systems".
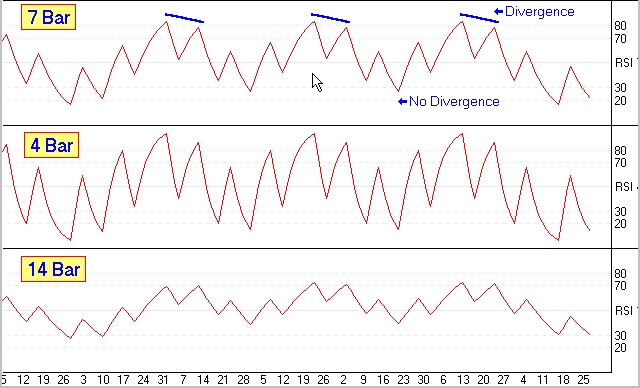
Various characteristics can be found in the 7 bar Relative Strength Index (RSI) study applied to this theoretical chart. 5 Wave Minor Trend Analysis: (blue 1-2-3-4-5 small numbers) 1) The RSI crosses above 50 in minor wave 1, but stays below 70. 2) Minor wave 2 may cause RSI to momentarily dip back below 50. 3) Minor wave 3 takes RSI higher, often to around 80. In the real world %K will often reach 80 but rarely 90. Study tip: It is important to realize that it is minor wave 3 that takes RSI to its highest high! 4) Minor wave 4 causes RSI to cross below 70 from its lofty high, but remain above 50. This crossing is the FALSE signal that traders fall for all too often. Going short because of a turn at 3 is premature, and your stop just above the top at 3 is taken out by the final thrust to the top at minor wave 5. The psychological tendency is to ignore the signal at 5 because of the loosing short attempted at wave 3. 5) Minor wave 5 causes RSI to rise again, often crossing back above 70, but the market lacks the duration in trend to elevate RSI to a higher high. When RSI turns down and crosses 70 the second time, this is the signal. Study tip: Look for divergence, where the price action put in new highs, but the study does not. Divergence between RSI and price is a very strong indicator of a turning point. Divergence is marked on the theoretical chart with short blue lines. 3 Wave Minor Correction Analysis: (blue a-b-c letters) a) Minor wave a returns to the previous support level of minor wave 4. But the drop of RSI is huge, falling from a lofty high below 40. This rapid fall is similar to the rapid rise that occurred in minor wave 1. b) Minor wave b is a Fibonacci retracement from a back towards 5. The example has its price stopping at the top of wave 3. The effect on RSI is to rally back above 50, possibly around 60. c) Minor wave c takes RSI to new lows around 30. The example shows a drop slightly below 30. Study tip: Divergence will not occur this time. Therefore, the signal to go long is the first time RSI crosses above 30. This is shown in the example at major waves 2 and 4 (large red numbers) where the market meets the long term support trend line shown in red. Signal Summary: The process starts over again as Relative Strength Index behaves in a similar fashion for major waves 3 and 5 as it did for major wave 1. The a-b-c correction of major wave 4 will be similar to major wave 2. The ideal place to short is after major wave 5 is in place, at what will be minor wave 2 of the first trend leg of the new major correction. Study tip: Relative Strength had three turns with divergence at the end of major waves 1, 3 and 5 marked in red. RSI turns at the end of the two reaction waves 2 and 4 did not have divergence. Look for this pattern to help you identify the 5th major Elliott wave. The divergence signal at the end of wave 5 is the ideal place to go short after a major up-trend, or long after a major down-trend. Bar Parameter: Now that the fundamental behavior of Relative Strength Index is understood as the Elliott waves develop in a market, the theoretical chart will be used to observe the effect of different bar parameters on the RSI. The bar parameter is used in the RSI formula to average the Up and Down net totals. Changes in the bar parameter affect the volatility of the study as illustrated below. Study tip: Use a bar parameter that produces RSI highs around 80 and lows around 20.
|

