by Peter Matske If your trading is based only upon study indicators you may find that adding additional techniques may be of benefit. Most studies are based upon price, in fact very few consider time at all, other than to smooth or average a number. The techniques of Gann, Elliott, and Fibonacci all offer the integration of time as well as price, and therefore may add value to your trading. W. D. Gann, R. N. Elliott, and L. Fibonacci all developed techniques which can be useful to project future areas which may be significant in either price or time. Some of the following topics may be contentious to some people, since many of the techniques have not been verified to theoretical academic standards. The counter point is that becomes the exact reason why the principles may be of value, because they may provide a trader’s edge. J.P. Morgan was a very successful trader, perhaps one of the greatest of all time. From his writings, I believe that he would concur with the techniques of Gann, Elliott and Fibonacci. He was quoted as saying, 'Anyone can become a millionaire, but if you want to become a billionaire, then you need an astronomer.' I believe that he was referring to the price time relationships, which have been associated by some as 'spatial relationships.' Fibonacci found that a number series, which increases by 1.618, has importance. He found this series to be almost universal in nature, from the structure or composition of plants to animals. The series is 1, 2, 3, 5, 8, 13, 21, 34, 55, 89, 144, 233, etc. What is interesting is that the relationship can be arrived at in many different ways and yet still comes to the same conclusion. I will later attempt to show that time and price are directly related. But first here’s a little math teaser. Write down on a piece of paper any two numbers. Start a Fibonacci sequence by adding the first number to the second number to create the third number. Continue adding pairs of numbers to get the next number in the sequence. For example: 72, 81, 153, 234, 387, 621, 1008, 1629, 2637, 4266 etc. The more numbers in the series, no matter what numbers are used as the starting point, will yield a relationship of 1.618 (i.e. 2637 *1.618=4266). Fibonacci found this relationship of 1.618 to be of great significance and he used it throughout his works. Note the following:
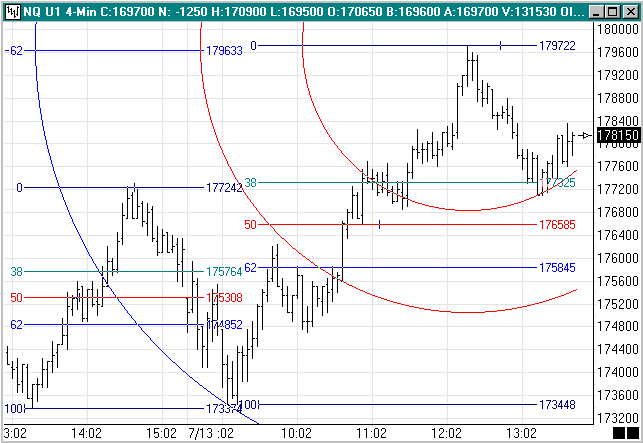
Referring to the first graph, note the use of the 1.618 relationship in the following ways: On the left side a retracement scale exists depicting the Fibonacci range from 173374 to 177242. Using Fibonacci extension principles the subsequent high 179633 would be an area that may be considered significant to watch. Note also the Fibonacci circles use the same relationships. These tools function both forward and backward, in time and price. Gann and Fibonacci found a few relationships which are more significant than others 90, 180, 270, and 360 degrees of rotation may mark points of interest in both price and time. If a tool exhibits at least two of these points of interaction it has the potential to be significant in a third or fourth point. Note that each time price came in contact with the circle there was a change in market direction. This interaction may carry forward or backwards over many subsequent circles.
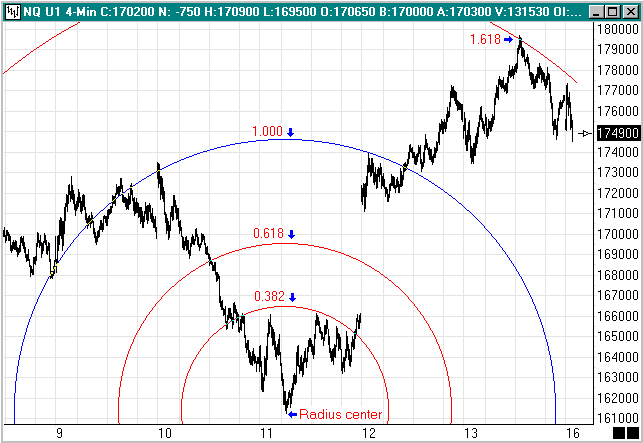
In this figure the same construction is applied from the preceding low point, and again shows multiple points of significant interaction both forward and backwards in time and price. Circles may be placed upon a chart well in advance of anticipated significant areas with the use of the Fibonacci circles tool. The Fibonacci numbers series should be used in Fibonacci circles and retracements. R.N. Elliot used this same sequence as a cornerstone in the development of the Elliot Wave structure. Elliott found several patterns to be quite common that exhibit this relationship. One very important thing to keep in mind is that there are many continuous interactions on different levels. The same or opposite structure may exist on a 1 min, 15 min, 45 min, daily, weekly, or monthly chart. The interaction of the different chart structures may be of significance as it can reaffirm points or areas that may become significant.
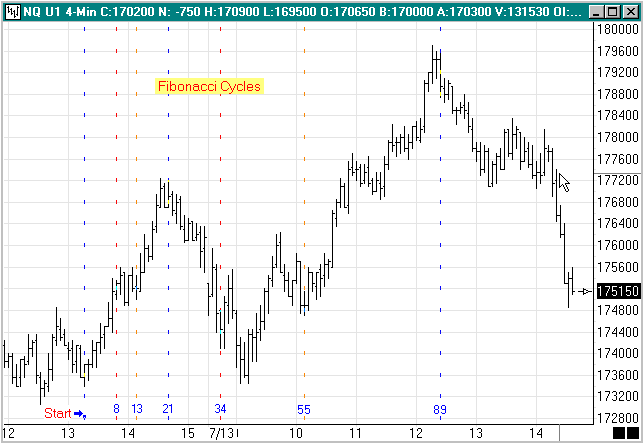
This figure shows Fibonacci cycles using the 1.618 relationship. Note how the tool identified areas of significance. The first line at bar 8 points to the first high. The 13 line points to the end of the congestion and the start of the next wave up to the 21 line and another high. Note how the series continues to be useful at pointing to future areas of importance at bars 34, 55, and 89.
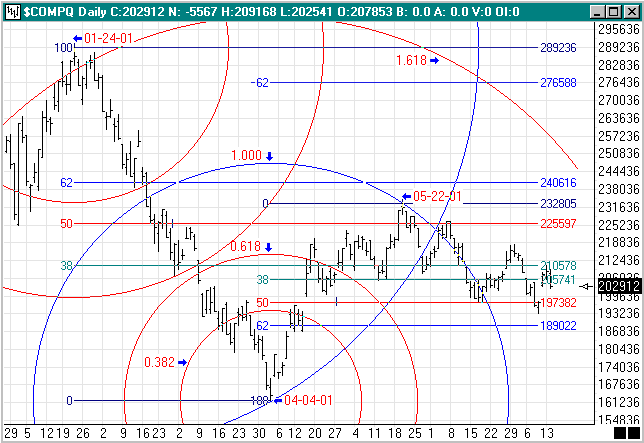
This figure shows a daily chart of the $Compq. Depicted on the chart are Fibonacci levels from each visually significant high or low. Two retracements are depicted, one measures the high of 01-24-01 to the low of 04-04-01. The other measures the low of 04-04-01 to the most recent high of 05-22-01. Whenever there is a retracement of a minimum price movement of .382%, the point that the retracement began from should mark a valid point for a Fibonacci circle. Note in this graph that the low of 04-04-01 is the starting point a circle that uses the 05-22-01 high as its 1.000 circle. Another circle can be drawn from the high on 01-24-01 which uses the low of 04-22-01 as its 1.000 circle.
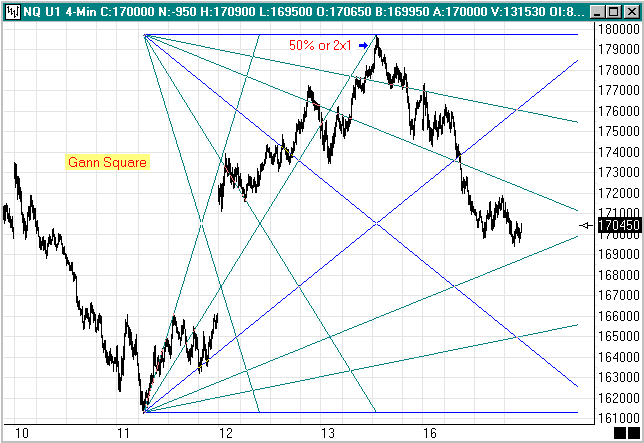
This graph shows a Gann Square anchored on the preceding low which shows many points of interaction with the fan lines along the way. Squares are generally best constructed from visually significant highs or lows. Although many shapes and sizes of the square may be used and prove useful, some demonstrate more consistent results which include height to width (rise to run) of 1x1, 1x5, 5x1, 10x1, and 1x10 Another method for constructing the box is to use Gann’s square of nine to calculate what I refer to as natural box sizes. This is done for you when you use the Pyrapoint tool. I would contend that each of the following 8 statements could be verified with the sufficient desire, time, and resources to support the verification. Obviously that’s a pretty bold statement since verifying mere fractional portions of a contention by academic theorists has resulted in significant awards. 1. Time forecasts Time (time can be used to
suggest future areas of significance, by counting different
time series. Some possible uses include: high to low, low
to high, high to high, and low to low) 2. Price forecasts Price (price can be used to
suggest future areas of significance, by counting different
price series. Some possible uses include: high to low, low
to high, high to high, and low to low) 3. Time forecasts Price (time can be used to
suggest future points, repetitive levels, or increments in
price) 4. Price forecasts Time (price can be used to
suggest future points, repetitive levels, or increments in
time) 5. Time forecasts Price and Time (time can be used
to suggest future points in price and time) 6. Price forecasts Price and Time (price can be
used to suggest future points in price and time) 7. Price and Time forecasts Price (price and time
can be used in conjunction to suggest future points in
price) 8. Price and Time forecasts Time (price and time
can be used in conjunction to suggest future points in
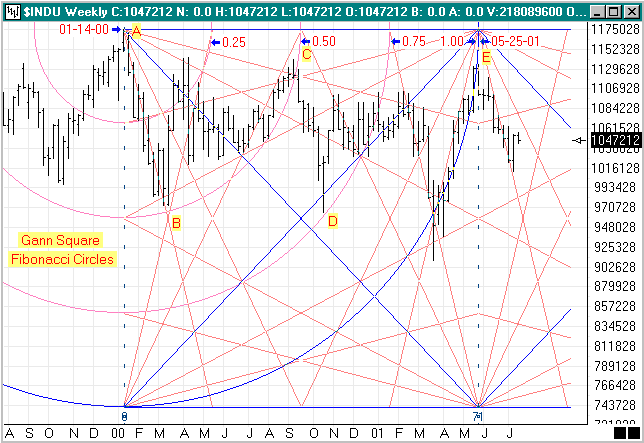
time) The numbers or series may be created by any of the following methods and may be viable: addition, subtraction, multiplication, division, squaring or square root of a number. The relationships may also be represented graphically in simple geometric shapes: circle, triangle, square. They may be represented in two or three dimensions: square to cube, circle to sphere etc. Three-dimensional representations can often demonstrate speed of movement, as what may appear to be congestion in an x-y plane may be continuous motion in the y-z plane. Ensign Windows provides the tools to easily create forward-looking interactions. I find it useful when multiple techniques point to the same conclusion. This may suggest that the identified area may become significant and that may provide the desired trader’s edge. Trading Tip: Analysis by Steve Grimaldi gts@nb.net Text by Howard Arrington This chart is the weekly Dow Jones Industrial, analyzed using the major high of 11750.28 on 01-14-00 (point A) and the prior major low of 7400.30 on 09-04-98 (not shown). All constructions are based on these two major points. Both the major high and the major low are marked by horizontal blue lines. The Gann Square was sized so its vertical range used these two major prices, and its horizontal width used the 01-14-00 bar for its left edge and the recent high on 05-25-01 as the right edge. The Fibonacci circles were sized with the center on the major high on 01-14-00 and the 1.00 circle passing through 05-25-01. The chart scale was adjusted so the 45 degree line from the circle tool would pass through the corners of the Gann Square, thus squaring Time and Price.
There are 71 weeks between the 09-04-98 low and the 01-14-00 high, and 71 weeks between 01-14-00 and 05-25-01! This cycle is close to the 72 week cycle - half of Gann's 144. There is considerable symmetry of moves on the different
radii. You will need to construct the circles yourself to
see the symmetry for the data off the left side of the
chart. Sorry the chart size that can be included in this
newsletter does not permit more chart bars to be shown. Compliance News:
The Securities and Exchange Commission (SEC) approved amendments to National Association of Securities Dealers, Inc. (NASD®) NASD Rule 2520 relating to margin requirements for day traders (the “amendments”). The amendments become effective on September 28, 2001 and are substantially similar to amendments by the New York Stock Exchange (NYSE) to its margin rules. The amendments provide for the following changes to current margin requirements: (1) Definition of “pattern day trader.” Under the amendments, “pattern day traders” are defined as those customers who day trade four or more times in five business days. If day-trading activities do not exceed six percent of the customer’s total trading activity for the five-day period, the clearing firm is not required to designate such accounts as pattern day traders. The six percent threshold is designed to allow clearing firms to exclude from the definition of pattern day trader those customers whose day-trading activities comprise a small percentage of their overall trading activities. In addition, if the firm knows or has a reasonable basis to believe that the customer is a pattern day trader (for example, if the firm provided training to the customer on day trading in anticipation of the customer opening an account), the customer must be designated as a pattern day trader immediately, instead of delaying such determination for five business days. (2) Minimum equity requirement. The amendments require that a pattern day trader have deposited in his or her account minimum equity of $25,000 on any day in which the customer day trades. The required minimum equity must be in the account prior to any day-trading activities; however, firms are not required under the rule to monitor the minimum equity requirements on an intra-day basis. The minimum equity requirement addresses the additional risks inherent in leveraged day trading activities and ensures that customers cover losses incurred in their accounts from the previous day before continuing to day trade. (3) Day-trading buying power. The amendments limit day-trading buying power to four times the day trader’s maintenance margin excess. This calculation is based on the customer’s account position as of the close of business of the previous day. (4) Day-trading margin calls. Under the amendments, in the event a day-trading customer exceeds his or her day-trading buying power limitations, additional restrictions are imposed on the pattern day trader that more adequately protect the firm from the additional risk and help prevent a recurrence of such prohibited conduct. Members are required to issue a day-trading margin call to pattern day traders that exceed their day-trading buying power. Customers have five business days to deposit funds to meet this day-trading margin call. The day-trading account is restricted to day-trading buying power of two times maintenance margin excess based on the customer’s daily total trading commitment, beginning on the trading day after the day-trading buying power is exceeded until the earlier of when the call is met or five business days. If the day-trading margin call is not met by the fifth business day, the account must be further restricted to trading only on a cash-available basis for 90 days or until the call is met. (5) Two-day holding period requirement. The amendments require that funds used to meet the day-trading minimum equity requirement or to meet a day-trading margin call must remain in the customer’s account for two business days following the close of business on any day when the deposit is required. (6) Prohibition of the use of cross-guarantees. Under the amendments, pattern day traders are not permitted to meet day-trading margin requirements through the use of cross-guarantees. Each day-trading account is required to meet the applicable requirements independently, using only the financial resources available in the account. Accordingly, pattern day traders are prohibited from using cross-guarantees to meet the minimum equity requirements or to meet day-trading margin calls. In addition, the amendments revise the current interpretation that requires the sale and repurchase on the same day of a position held from the previous day to be treated as a day trade. The amendments treat the sale of an existing position as liquidation and the subsequent repurchase as the establishment of a new position not subject to the rules affecting day trades. Similarly, if a short position were carried overnight, the purchase to close the short position and subsequent new sale would not be considered a day trade. For more information regarding the SEC Approval of Proposed Rule Change Relating To Day-Trading Margin Requirements, please refer to NASD Notice-To-Members 01-26 |
