|
Regression Techniques
by Howard Arrington Everyone seeks a crystal ball for tomorrow's price. If prices are trending down, a statistically good guess for tomorrow's close would be "today's close, but with a downward bias." This is a logical assumption. A linear regression trend line approximates this price movement by finding a 'best fit' trend line through the data. This line is an equilibrium with an equal balance of data above the line and below the line. A common use of a linear regression line is to construct parallel lines on either side to show the range in which prices can be expected to deviate.
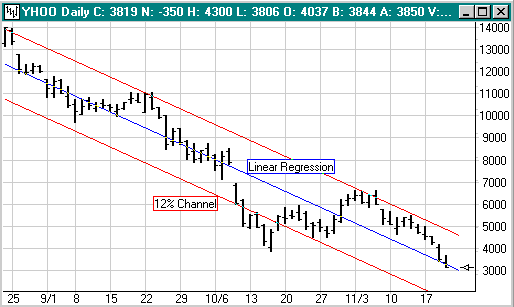
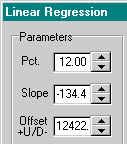
The chart shows a Linear Regression line in blue applied to the Yahoo daily closes from 08-24-2000 through 11-22-2000. The red channel lines are spaced at a distance of 12% of the linear regression price on 08-24-2000. The slope of this 'best fit' line is down at a rate of $1.34 per day over this time period. The slope is read from the tool's parameter form:
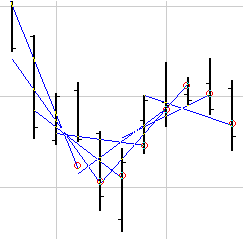
Ensign Windows provides another regression tool called a Regression Channel. The channel is automatically created by applying a linear regression line to each bar on the chart to obtain a single price where the regression line intersects the last bar in the regression period. To illustrate, this chart shows a 5-bar regression line applied to each bar on the chart, and the intersection is marked with a red circle.
The intersection prices as marked by the red circles are connected to form a regression curve, quite like a moving average curve. Channels are created by plotting parallel curves on either side at some percentage of the price. This study performs a tremendous amount of data manipulation, but that is why computers are used to do the task.
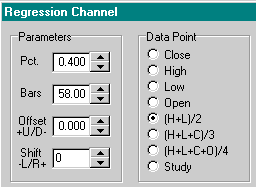
Here are specific parameter settings shared by a broker using Ensign Windows, with his permission for their publication in this newsletter. On a 3-minute chart of December ES, he uses these parameters:
On a 34-tick chart for ES0Z, he uses parameters of Pct. = 0.20, Bars = 64, and Data Point = (H+L)/2. The trader who shared these parameters says the Regression Channel study provides quick parallel lines that keep him with the trend, and that he takes profit when the prices move outside the channel lines. |


