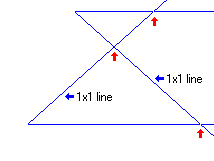
by Howard Arrington W. D. Gann designed several unique techniques for studying price charts, and central to his techniques were geometric angles of time and price. This month's trading tip is how one might use the intersection of primary Gann angles to predict the timing of a turn. I have looked in my library of technical analysis books and do not find this idea discussed. So, I must plead ignorance as to where and when I was introduced to this idea. It is not my idea. I don't even know if Gann used this technique. But I like it and want to share it as I understand it. I will use a daily chart of JDS Uniphase in my example. I am not giving any investment advise. I am only showing the thought process I go through to discover market timing using Gann angles. Be aware that my illustrations of this idea benefit from hindsight. The basic principle is this: an upward Gann angle will be placed on the chart at a significant low turning point, and a downward Gann angle will be placed at a significant high turning point. Of primary interest to us are the intersections of the 1x1 lines with horizontals lines, and the intersection of the two 1x1 lines. These intersections are marked with red arrows in this example.
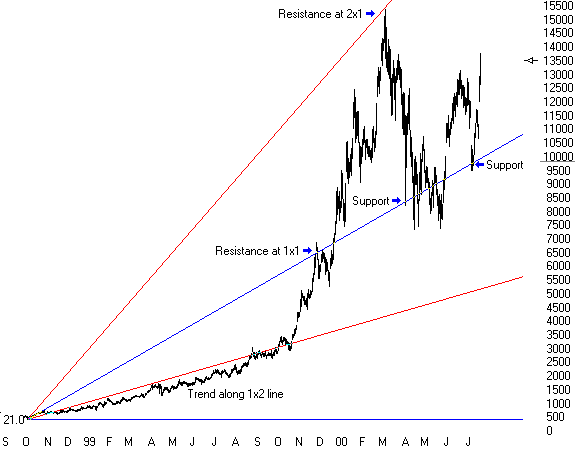
 I have kept it simple by showing in the first illustration just the intersections for the 1x1 lines. However, I also like to consider the 2x1 and 1x2 lines and their intersections, and will do so in my illustrations on the JDSU daily chart. I start with a blank JDSU chart, and first try to discover an appropriate time and price relationship to use as a 1x1 line. To do this, I use the Gann fan tool in Ensign Windows and set the default parameters to show only the 1x1, 2x1 and 1x2 angles. Also, I check the box to use the bar's high or low value for placement of the fan vertex. The 1x1 lines are drawn in blue while the 2x1 and 1x2 lines are drawn in red. The first fan was placed on the significant low of 10-05-1998. I adjusted the 1x1 line placement to visually fit the market action. I am looking for trending along these lines or support and resistance bounces on these lines. The more correlation I can find, the better the fit. As a fan is being placed on the chart, Ensign shows the relationship between time and price as a number by the fan vertex. I watch this number and try to select a 1x1 time and price value that is a multiple of a price unit, or has some relationship to a Gann number, a Fibonacci number, or the subdivision of a circle. My first fan from 10-05-1998 fit with a 1x1 value of 21.0. This means that the 1x1 line is ascending at a rate of 21 cents per day. I am comfortable with 21 since it is both a Gann sequence number and a Fibonacci sequence number.
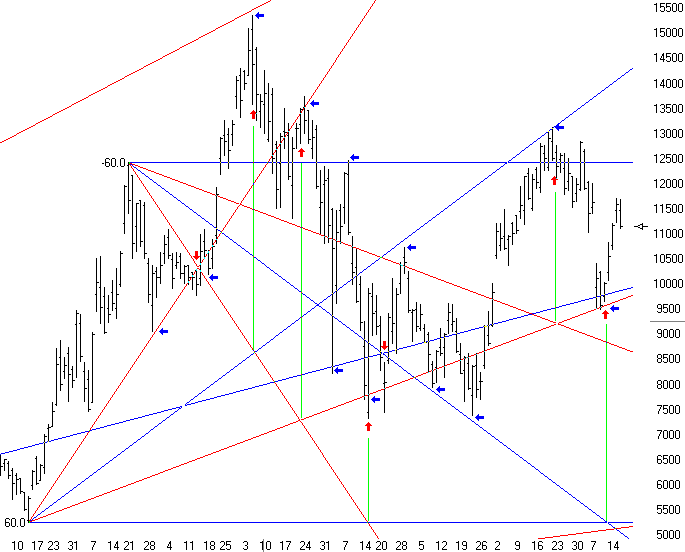
 For the placement of additional Gann fans from recent significant highs and lows, I will expand the bar spacing. I will find a new 1x1 value since the volatility of JDSU in 2000 is much greater than its 1998 volatility. I find that a 1x1 slope of 60 cents per bar fits, and choose to use 60 as the 1x1 value for all fans in the remainder of my discovery. I like the number 60 because it is an even subdivision of a 360 degree circle whereas 58, 59, 61, and 62 are not. I have added an upward fan from the 12-15-1999 low and a downward fan from the 01-21-2000 top to see what timing intersections might be present. I marked the intersections which predict the timing of a turn with red arrows. The vertical green lines are just a visual aid to extend the line of sight from the red arrows to the intersections. Note that the descending 2x1 line (steepest red) had a useful intersection with all four lines of the upward Gann fan drawn from the 12-15-1999 low. Gann angles also provide support and resistance, and many of these points have been marked with horizontal blue arrows. As you study the example, look for another Gann technique that when an angle is penetrated, prices will move and consolidate at the next angle. Looks interesting, doesn't it. I hope you have been fascinated by the illustrations. I'm sure that there is more yet to be discovered, and other Gann fans could be used besides the ones I have used to illustrate these trading tips. But that is OK. I am not trying to be a final word on anything, but rather, I am teaching techniques that you may not have considered before. Hopefully, you will use these trading tips, and do your own discovery of market timing on charts you like to trade.
 |