| Study Insight:
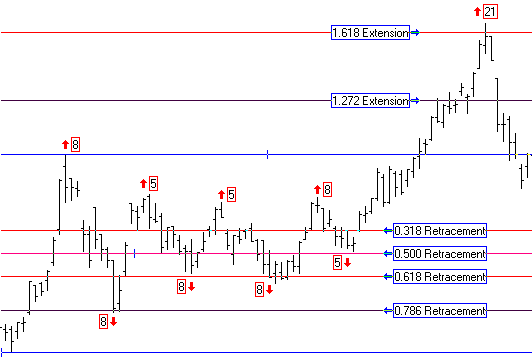
by Howard Arrington Leonardo de Pisa de Fibonacci (born around 1170 in Pisa, Italy) was a mathematician who studied the Great Pyramid at Giza and discovered a number series which we now call Fibonacci numbers. The number in the series is the sum of the two previous numbers, and includes the set 1, 2, 3, 5, 8, 13, 21, 34, 55, 89, and 144. Dividing one number by the next after the 8th sequence yields 0.618, which happens to be the relationship of the height of the Great Pyramid to its base. Another relationship is that the next number in the sequence is approximately 1.618 times the preceding number. These relationships are also a Fibonacci number series: 0.382, 0.618, 1.000, 1.618, and 2.618, etc. Fibonacci numbers are valuable because these numbers and relationships are found everywhere in nature and in the markets. Frequently the magnitude of a wave will have a Fibonacci relationship to the magnitude of another wave structure. A wave's magnitude is determined by measuring the price range from a significant top to a significant bottom. The magnitude of a Trend wave might be 1.618 times the magnitude of the previous Retracement wave. A corrective Retracement wave might be 0.618 times the magnitude of the previous Trend. Larry Pesavento shows in his book 'Profitable Patterns for Stock Trading' that two additional ratios are frequently found in the markets. These ratios are the square roots of the two primary Fibonacci ratios. The square root of 0.618 = 0.786, and the square root of 1.618 = 1.272. Larry uses these two additional relationships, 0.786 and 1.272, because not all waves are a ratio of 0.618 and 1.618, or the other common ratios of 0.382, 0.500, and 2.618. This example daily chart, Lucent Technologies Inc. (LU), is loaded with Fibonacci relationships. The number of bars in each trend is shown in a red box. Note that the number of bars in the initial trend and its narrowing triangle consolidation sum to a Fibonacci number 55 = 8 + 8 + 5 + 8 + 5 + 8 + 8 + 5. Note the three wave bottoms that occur on the 13th bar cycle from the prior bottom. Note the break away gap and the 21 bar run to the 1.618 Fibonacci extension level top.
 Fibonacci ratios are easily applied to a chart using the Fibonacci Levels tool in Ensign Windows. When you click on the Fibonacci Levels button, the cursor will change to a pencil while in the draw mode. A start and end point are necessary to draw Fibonacci Levels on a chart. The distance between the start and end points is divided into Fibonacci Levels which suggest possible support and resistance points. To draw Fibonacci Levels on a chart move the cursor on the chart to the starting point. The starting point is generally an important high or low on the chart. Click the left mouse button down and drag the mouse to the ending point, and release the mouse button. The ending point is usually the end of an important trend or correction following the starting point. Watch for the completion of a trend or correction at a Fibonacci Level. After drawing Fibonacci lines on a chart, click the right mouse button to display the tool's properties window. The properties window is used to change the levels, color, style, and defaults. A check box list of common ratios is provided so that specific levels can be displayed or hidden. The list includes the levels 0.786 and 1.272 that are the focus of this month's study insight. |