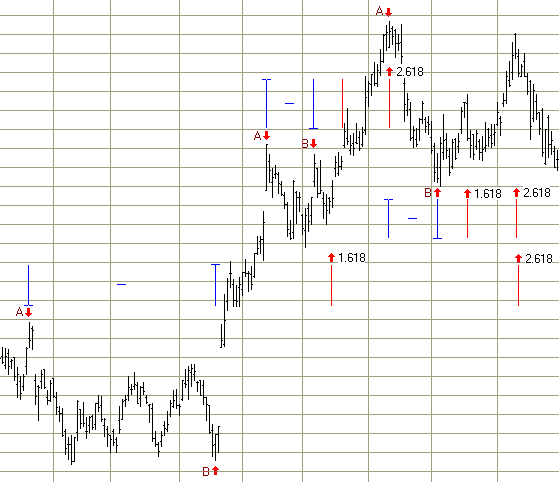
by Howard Arrington The Fibonacci sequence involves the use of ratios, and the two ratios that are focused on in this trading tip are 1.618 and 2.618. Time can be forecast by measuring the horizontal time period between two points A and B, and multiplying by the Fibonacci ratios. The result is plotted rightward from point A. Fibonacci time projections can be made from top to top, bottom to bottom, or top to bottom. Because of the multiplicity of swing tops and bottoms, there is the problem of a multitude of possible relationships. One solution to the problem is to use this tool in conjunction with other time-oriented information, such as Elliott wave counts or cycle analysis. The following chart illustrates three Fibonacci Time Projections. Each time period measured is marked with blue lines and arrows labeled A and B. The forecasts are marked with red lines and labeled for the Fibonacci ratio used.
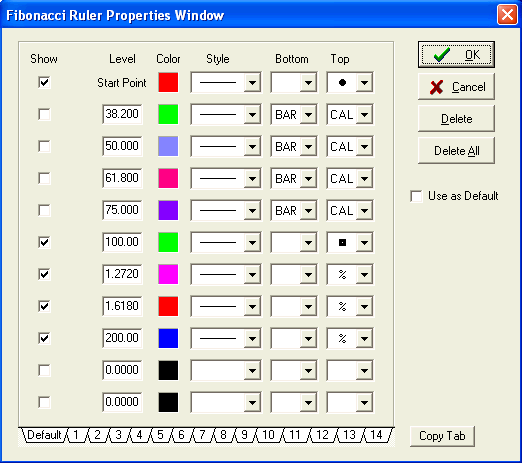
 Fibonacci Time Projects are easy to make using the Fibonacci Ruler tool in Ensign Windows. The percentages, colors and markers are configured on the tool's property form.
Study Insight: by Howard Arrington
This code is called in a loop so the test is made for each bar on the chart. The rPaint array will store a value of 1 to color the bar for an Up trend, or the value of 2 to color the bar for a Down trend. if rPaint[y]=1 then begin r[] is an array of bar records. The .h field is the
bar's high. The .l field is the bar's low. The programming logic can be expressed with this word description: If the previous bar's trend is Up, then make two tests: If the previous bar's trend is Down, then make two tests: If the current bar has not be colored by the above tests,
then make these tests: |

 The
Trends study is applied to a chart by clicking on the Color
Bars button, and selecting Trends in the list. Bars in an
Up trend are colored with one color, such as green, and bars
in a Down trend use a different color, such as red. This is
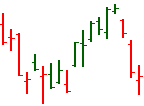
the logic used to create the Trends Color Bar study.