LEARN THE TURNS
Law #7: Track oscillators. Oscillators help identify overbought and oversold markets. While moving averages offer confirmation of a market trend change, oscillators often help warn us in advance that a market has rallied or fallen too far and will soon turn. Two of the most popular are the Relative Strength Index (RSI) and Stochastics. They both work on a scale of 0 to 100. With the RSI, readings over 70 are overbought while readings below 30 are oversold. The overbought and oversold values for Stochastics are 80 and 20. Most traders use 14-days or weeks for stochastics and either 9 or 14 days or weeks for RSI. Oscillator divergences often warn of market turns. These tools work best in a trading market range. Weekly signals can be used as filters on daily signals. Daily signals can be used as filters for intra-day charts. - John Murphy
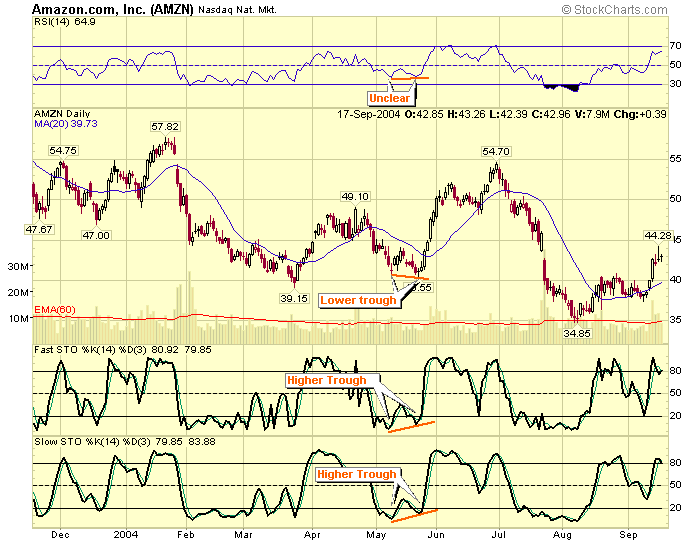
John pretty much covered the key points in his description of Law #7. Here's an example of what he's talking about:
First, notice that the RSI doesn't move from overbought to oversold as "wildly" as the Stochastics oscillator does - you'll rarely find an RSI reading above 90 or below 10 and your often find the RSI indicator near 50. On the other hand, the Stochastics Oscillator "loves" to swing quickly between readings below 10 and readings above 90 and it truly"hates" hanging around 50 - while it often reverses near there, it rarely stays near the center line for long.
Because the Stochastics Oscillator is so jumpy, we offer a "Slow" and a "Fast" version. The fast version is essentially the "raw" version of the oscillator. The slow version is simply the fast oscillator that has been smoothed some by running it through a Moving Average calculation. You can see on the chart above how the two lines are similar, but the "Slow STO" link is smoother.
I've added some annotations to the chart that point out one of the "Divergences" that John mentioned which warn of market turns. You can see where both of the Stochastic Oscillators put in a higher trough when AMZN was putting in a lower one. (The RSI was characteristically non-committal at the time.) Soon afterwards, the stock zoomed up 20+ percent. There's another divergence later on that same chart - see if you can spot it.
More Info:
This ChartSchool article has more on Oscillators in general.
If you want an excellent book on the subject, check out Chapter 10 of John's own
"Technical
Analysis of the Financial Markets".
For more on the RSI, check out the book "RSI
- The Complete Guide" by John Hayden.
Note: John's entire 10 Laws of Technical Trading can be found in our "ChartSchool" area under "Trading Strategies". If you missed any of my previous articles on Murphy's Laws, the ChartWatchers Archives page will take you to any of them.
- Chip Anderson