FOLLOW THAT AVERAGE
Law #6: Follow moving averages. Moving averages provide objective buy and sell signals. They tell you if existing trend is still in motion and help confirm a trend change. Moving averages do not tell you in advance, however, that a trend change is imminent. A combination chart of two moving averages is the most popular way of finding trading signals. Some popular futures combinations are 4- and 9-day moving averages, 9- and 18-day, 5- and 20-day. Signals are given when the shorter average line crosses the longer. Price crossings above and below a 40-day moving average also provide good trading signals. Since moving average chart lines are trend-following indicators, they work best in a trending market. - John Murphy
A couple of weeks ago, we looked at trends and trendlines. We talked about how trendlines are line "non-horizontal" support/resistance levels. Well, think of moving average lines are like "flexible" trendlines. They help you see the trend that's "hidden" amongst all the noisy short-term price fluctuations.
Unfortunately, unlike trendlines and resistance levels, there are an unlimited variety of moving averages that you could look at. There's the 50-day MA, the 200-day MA, the 20-day MA, the 9-day MA, etc. Going beyond that, there are Simple Moving Averages (SMAs) and Exponential Moving Averages (EMAs) (and still others beyond those!). How do you choose?
The general rule is simple - the longer your time horizon, the longer the MA period you should use.
Are you a buy-and-hold investor? Use longer term MAs like the 50-day and 200-day ones that I like to write about. Are you a day trader? Use shorter term MAs like the 4-day and 9-day ones that John mentioned.
Note however that while longer-term investors can generally ignore short-term MAs , the reverse is not true. Even day-traders should be aware of where important long-term MA levels are. Resistance from the 200-day MA can impact day traders too.
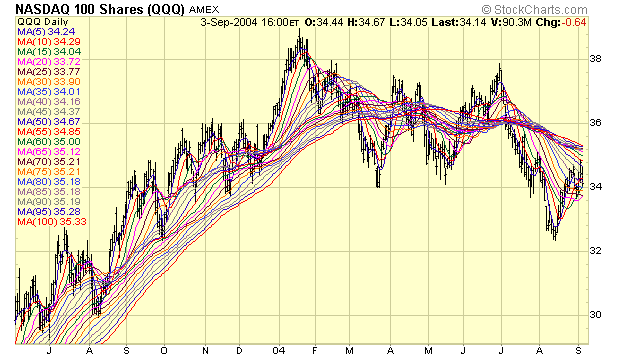
The help see how different MAs work, I often look at something I call an "MA Ribbon Chart". It contains a series of MAs - each with a slightly different period setting:
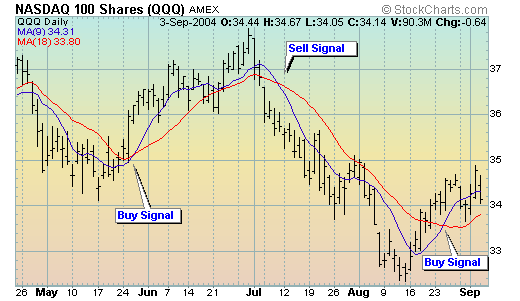
As John mentions in Law #6, MA Crossover signals can be very useful in trending markets. That where you focus on the points where two different MAs intersect. When the shorter MA moves above the longer MA, a "buy" signal is given. When the shorter MA moved below the longer MA, a "sell" signal is given. Here are some examples:
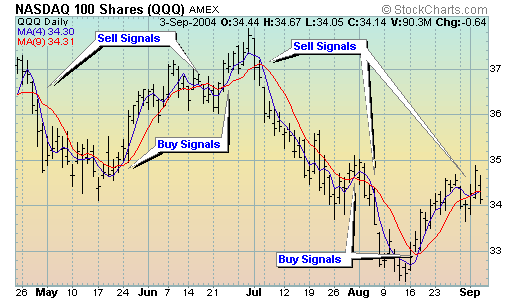
As you can see, shorter MAs periods lead to more signals. You'll need to take some initiative here and experiment to see what combination fits your trading goals and style. Fortunately, StockCharts.com makes it very easy to try whatever combinations you want.
Finally, don't forget to watch the 50 and 200-day MAs. Why? Because lots of other people watch them and thus, they often act like important support and resistance zones.
Next week: Law #7 - Learn the Turns
- Chip Anderson