Charting Cumulative and Volume-based Indicators
Most of the time, charting an indicator with a computer is very straightforward - get all the data, calculate the value for each time period on the chart, "connect the dots" and then add the vertical scale. Sometimes however, things aren't so simple. There are two common "gotcha's" that all ChartWatchers need to be aware of.
"Getting ALL the Data"
With some indicators, like the Simple Moving Average, it is very easy to determine the amount of data you need to complete the calculation. A 20-period Simple Moving Average needs 20 data points for each period on the chart, therefore you only need the 20 addition periods beyond the left edge of the chart.
As we've documented previously, Exponential Moving Averages (EMAs) are more complicated. Click here for all the gory details.
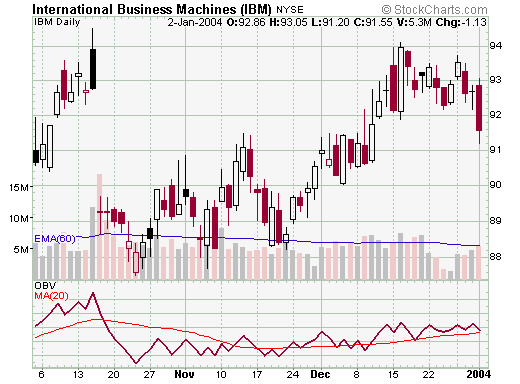
There's a similar issue with so-called "cumulative" indicators like "On Balance Volume (OBV)". OBV is created by adding (if the stock rises) or subtracting (if it falls) today's volume value from yesterday's OBV value. In theory, you need to carry that calculation all the way back to when the stock first started trading. Unfortunately for most stocks, that results in the computer crunching lots of additional data. The good news is that the "shape" of the OBV curve is the same regardless of how much additional data is used in the calculation. The only thing that using all of the data gets you is a consistent final value for the OBV itself, however that value is not used when interpreting the OBV indicator. The OBV is not an oscillator, so whether it is positive or negative is not significant. What is important is whether the OBV line is rising or falling, whether the OBV line is higher or lower than it has been in the past, and/or whether it is above or below its signal line.
This is identical to how you interpret other "cumulative" indicators such as Price-by-Volume and the various Advance-Decline lines. For all of these indicators, we (like most other charting programs) do not calculate things back to the beginning of trading. Instead we only use the data that is visibly displayed on the chart. And since that causes the computed values to vary from chart to chart, we do not display anything on the vertical scale.
"Calculate for EACH TIME PERIOD"
The other "strange" thing that occurs when we calculate indicators has to due with volume-based indicators and incomplete price bars. To see the issue, consider the following weekly chart that was created in the middle of a Monday:
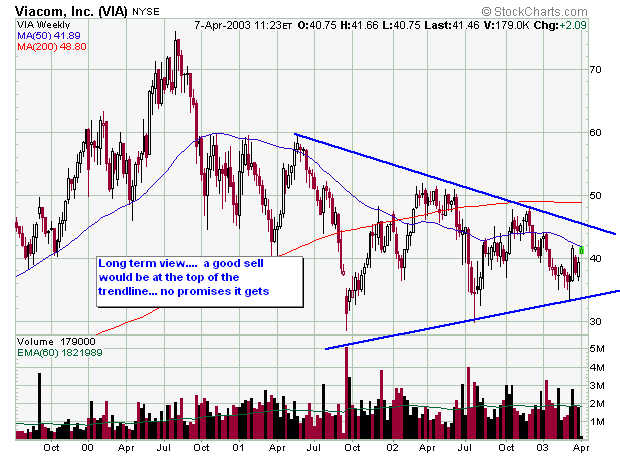
Ignore the commentary - instead, just focus on the very last volume bar (the small black one on the right edge of the chart). Notice that it is much smaller than the other volume bars. This makes sense since those other bars are the total of five days of trading (typically) while the right-most bar only contains volume for one half of one day. At this point, based on this chart, we can't really say if VIA is having a good week or a bad week volume-wise. We need to wait until the week is over and then compare the "fully grown" volume bar to the others.
The same is true for any volume-based indicators that use this data. Examples of volume based indicators include OBV, Accumulation/Distribution, Chaikin Money Flow, and the PVO. If we were to calculate those indicators based on the data displayed in the chart above, we would probably see a big drop (typically) in those indicators based on the fact that the final volume bar is so short. Since that kind of drop would be very misleading, we do not include the value of incomplete volume bars in the calculation of our volume-based indicators. (We display the date of the last complete volume bar used in the calculation in the upper left corner of the indicator window.)
Note that in the example above, I used a partial week compared to a full weekly chart. The same principle holds for other time frames though - e.g., a couple of minutes into a hourly chart, a couple of hours into a daily chart, etc.
Knowing how and why each indicator is calculated can really help you understand what the charts are telling you. While it takes some time to fully understand what is going on, experienced ChartWatchers know that it is time well spent.
- Chip Anderson