The Relative Strength Index (RSI) is a popular oscillator developed by Welles Wilder, Jr (see his book, New Concepts in Technical Trading Systems). RSI measures the relative changes between higher and lower closing prices, and provides an indication of overbought and oversold conditions.
The term "Relative Strength" is slightly misleading and often causes some confusion. Relative strength generally means a comparison between two different markets or indices. RSI, on the other hand, looks at the internal strength of a single market.

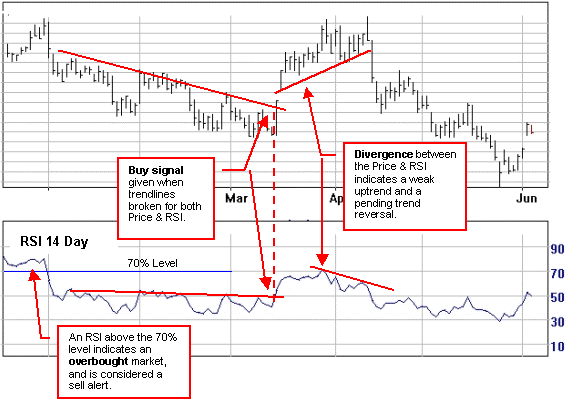
RSI is plotted on a vertical scale of 0 to 100. The 70% and 30% levels are used as warning signals. An RSI above 70% is considered overbought and below 30% is considered oversold. The 80% and 20% levels are preferred by some traders. The significance depends upon the time frame being considered. An overbought reading in a 9-day RSI is not nearly as significant as an RSI for a 12-month period.
An overbought or oversold condition merely indicates that there is a high probability of a counter reaction. It is an indication that there may be an opportunity to buy or sell, but does not provide the final signal. RSI signals should always be used in conjunction with trend-reversal signals offered by the price itself.
RSI can be plotted for any time span. Wilder originally recommended using a 14-day RSI. Since then, the 9, 10 and 25-day RSIs have also become popular. The shorter the time period, the more sensitive the oscillator becomes. If the user is trading short-term moves, the time period can be shortened. Lengthening the time period makes the oscillator smoother and narrower in amplitude.
In using RSI, a crossover above the 70% level is a warning signal to prepare to sell and, conversely, when the RSI falls below 30% you have a notice to prepare to buy. The actual buy and sell signals are given when the RSI reverses (see below). RSI crossings through the 50% level are also used as buy and sell signals by some traders.
Tops & Bottoms, Failure Swings, Divergence
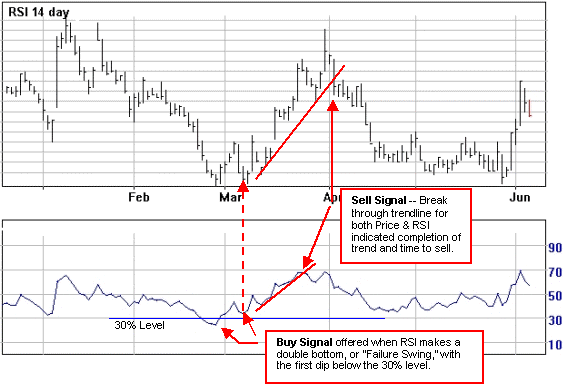
Traders watch for double tops or what Wilder referred to as "failure swings." If the RSI makes a double top formation, with the first top above 70% and the second top below the first, you get a sell signal when the RSI falls below the level of the dip. Conversely, a double bottom at or below 30% (with the first low below 30% and the second at or above the same level) gives you a buy signal when the RSI breaks above the previous peak.
These failure swings can lead to divergences between the price action and the RSI. For example, a divergence occurs when a market makes a new high or low, but the RSI fails to set a matching new high or low. A divergence can be an indication of an impending reversal. In Wilder's opinion, divergences are the most important signal provided by RSI.

Trendlines
RSI trendlines can provide good signals, particularly when used in conjunction with price patterns. When both price and RSI trendlines are violated within a short period you could have an important buy or sell signal.