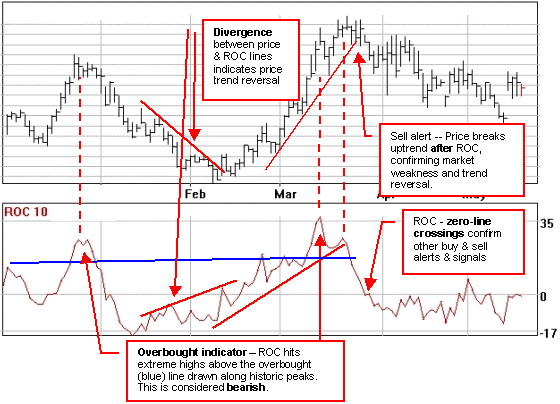
Rate of Change, ROC, can be very useful, because it is a leading indicator (ROC changes direction before the underlying price). ROC is sometimes also referred to as Price Rate of Change (PROC).

Whereas the Momentum indicator provides the difference between the current price and the price from a past period as a ratio, ROC displays the same information as a percentage on an open scale.. The zero-line, or equilibrium line, represents the level where the price is the same as the reading for the past period (e.g., 10 days for the 10-day ROC).
The ROC displays the amount prices have changed over the given time period as an oscillator. When the wave is above the equilibrium line, the market price is higher than it was at the start of the ROC time period. The higher the wave, the greater the change. When the wave sinks below the equilibrium line into a trough, the lower it goes, the lower the market is in comparison to the previous price. As the wave starts coming up from the bottom of a trough, in a rising ROC, this indicates expanding momentum (considered bullish). Conversely, a falling ROC is considered bearish.
Comparing the ROC's of different time spans improves the accuracy of the analysis. A 12 month period is usually the most reliable for long term trends and 3 or 6 month period works well for intermediate trends. As mentioned previously, a 10 or 12-day ROC is a good short term indicator, oscillating in a fairly regular cycle.
The lower the ROC, the more undersold the market and the more likely a recovery. Although the opposite may hold true in that the higher the ROC, the more overbought the market, both extremes can indicate the formation of a sideways channel.
Overbought/ Oversold Levels
Overbought and oversold lines can be drawn on the ROC chart, generally along previous highs and lows. There are no hard and fast rules about where these lines should be drawn. Like trend lines they should be drawn in response to the previous actions of the price and ROC indicator itself. Overbought levels can only be relied on to indicate a coming market reversal when a bull market has matured, or during bearish phases.
You can filter out a many premature buy and sell signals by waiting for:
Divergences
Divergences can provide warnings or alerts of weaknesses in market trends, but do not represent actual buy or sell signals. It is essential to wait for a confirmation from the price itself that the overall trend has reversed.
Zero-line crossings
Although the long-term price trend is still the overriding consideration, a crossing upward through the zero line can confirm a buy signal and a crossing downward through the zero line, a sell signal.
Trendline Violations
The trendlines on the ROC chart are broken sooner than those on the price chart. The value of the momentum indicators is that it turns sooner than the market itself, making it a leading indicator.
Also see Momentum