Previous year's price/earnings ratio are considered actual (using a historical price), current/next year price/earnings ratio would be estimates. In either case,' P ' is equal to the current price. Companies that are not currently profitable (negative earnings) do not have P/E ratio's.
When comparing a company's P/E, one should look at comparing the ratio against similar companies. Different industries and even different companies have different P/E ratio's. Technology companies typically have above market P/E ratio's (approx double the average market P/E), while banks have typically have below market P/E ratios.
Understanding the P/E number
A P/E of 40, would mean that it would take 40 years for the investor to see a return on the investment. High P/E ratios can represent low recent earnings, whilst a low P/E ratio could imply low expectations or that the stock is undervalued.
It would be advisable to also consider comparing the P/E ratio to the growth of earnings per share (P/E divided by growth rate). The resulting PEG ratio can aid the investor in determining whether investor expectations are reasonable given the companies past performance.
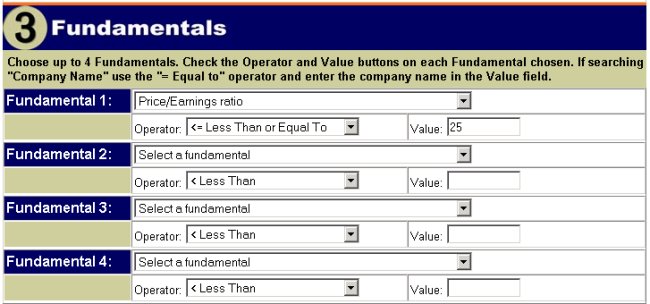
Sample Filter for P/E less than or equal to 25: