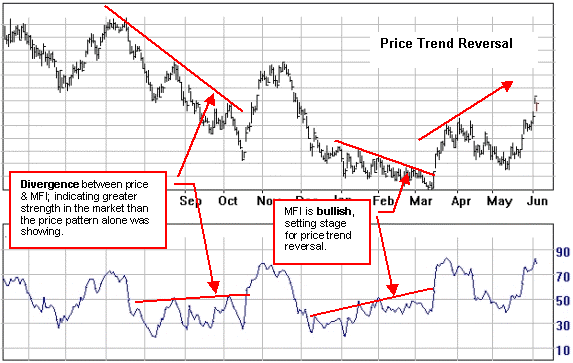
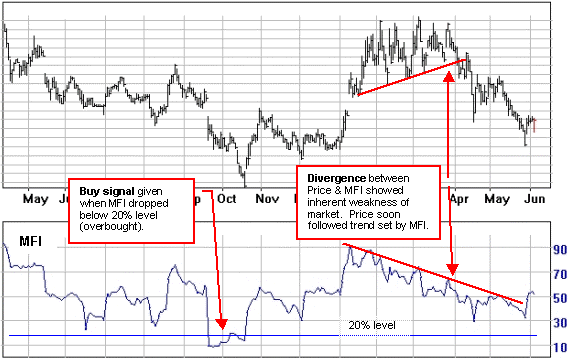
A divergence between the Money Flow Index and price trend can warn of a possible trend reversal.
Overview
-
The Money Flow Index (MFI) tracks the flow of money into or out of a market.
-
Price typically follows MFI and will eventually move in the same direction.

If a stock trades up 1 cent on 100 shares, and the next trade is down 1 cent on 10,000 shares, it shows that large sellers are more aggressive, and vice versa. Given that large-volume single trades are more significant than smaller-share trades, the Money Flow Index reflects this comparing today's average price with yesterday's and weighs the average price by volume. The volume of shares traded on upward moves is added up and then the volume of shares traded on downward moves is subtracted. The cumulative total for the day of every trade's volume is then plotted against a 0 - 100 scale. MFI is usually calculated over a 14 day period.
The Money Flow Index was developed by Laszlo Birinyi, Jr. as a real-time variation on the On-Balance Volume indicator. Instead of using each day as a reference point (as OBV does), MFI analyzes each trade. And instead of ignoring the price or the amount that the market is up or down, MFI weights each trade by price.
MFI is based on Money Flow but the two are not the same.
Interpretation
Money flow analysis is a volume weighted relative strength index. It is effective for both stock and company selection because it gives a view of a market's essential strength or weakness. Normally, MFI shows the same trends as the price pattern; indicating that, in an uptrend, money is flowing into the market, and when prices fall, money is flowing out of the market.
- Since Price - MFI divergences can exist for a fairly long period, other indicators should be used as confirmation and to select entry points
- Different time spans should be considered; often the longer the better.
Signals
-
A divergence between price and MFI often signals an imminent reversal of the trend.
-
Readings below 20 on the scale are considered oversold (bullish).
-
Readings above 80 on the scale are considered overbought (bearish).

Also see On-Balance Volume (OBV)