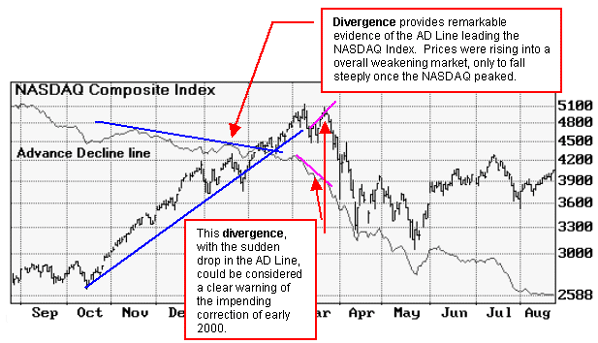
The AD Line is calculated by taking the difference between the advancing and declining issues each day (usually on the NYSE). This positive or negative number is added to the cumulative AD line.

In using the AD Line, keep an eye on the Trend and watch for Divergence from other indices or sectors:
Trend: By studying the trend of the AD Line you can see if the market is in a rising or falling trend, if the trend is still intact, and how long the current trend has prevailed.
Divergence: The AD line should trend in the same direction with the market averages. When the AD line peaks out ahead of the market, as it often does, investors are alerted to poor market breadth.
Typically, the daily AD Line is used to watch for short to intermediate trends. A weekly AD Line is considered more useful for trend comparisons that span several years.
Overbought/Oversold Indicator
The Overbought/Oversold Indicator (OB/OS) is simply a smoothed AD Line. The smoothing is done by taking the 10-day exponential moving average of the A/D Line. Smoothing the A/D Line makes it fluctuate within a narrower range with heavier weighting given to past data.
The OB/OS indicator generally fluctuates in a range of +400 to -400. A level above +200 suggests an overbought market while a level below -200 suggests an oversold market.
There are a number of other useful indicators for measuring market breadth. See also the McClellan Oscillator, McClellan Summation Index, Upside-Downside Volume, and the Arms Index.
Sidebar on the NYSE
The New York Stock Exchange (NYSE) is the largest equities marketplace in the world and is home to 3,025 companies worth more than $16 trillion in global market capitalization. As of year-end 1999, the NYSE had 280.9 billion shares listed and available for trading worth approximately $12.3 trillion.
Over two-thirds of the roster of NYSE companies have listed here within the last 12 years. These companies include a cross-section of leading U.S. companies, midsize and small capitalization companies. Non-U.S. issuers play an increasingly important role on the NYSE. As of July 1999, 382 non-U.S. companies were listed here - more than triple the number 5 years ago.
-- From the NYSE website at NYSE.com