In the 1600s, the Japanese developed a method
of technical analysis to analyze the price of
rice contracts. This technique is called
candlestick charting. Candlestick charts are
simply a new way of looking at price; they don't
involve any calculations.
Candlestick charts are much more visually
appealing than a standard two-dimensional bar
chart. As in a standard bar chart, there are
four elements necessary to construct a
candlestick chart, the OPEN, HIGH, LOW and
CLOSING price for a given time period. Below are
examples of candlesticks and a definition for
each candlestick component:
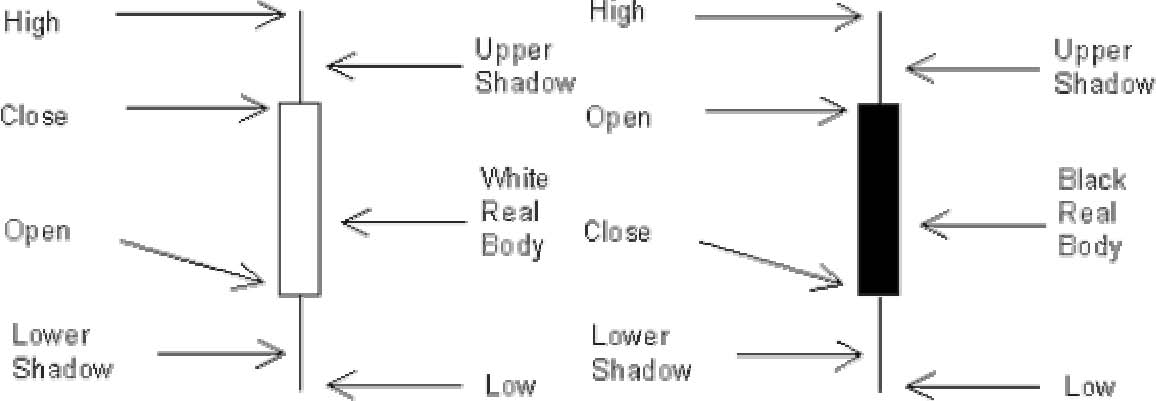
The body of the candlestick is called the
real body, and represents the range between the
open and closing prices.
A black or filled-in body represents that the
close during that time period was lower than the
open, (normally considered bearish) and when the
body is open or white, that means the close was
higher than the open (normally bullish).
The thin vertical line above and/or below the
real body is called the upper/lower shadow,
representing the high/low price extremes for the
period (one period of time measures the duration
of selling or buying within the market). As a
trader, you can use any time period you want,
time intervals may be a tick chart, 1 min, 5min,
10 min, 1 hour, 4 hour, 1 day,…
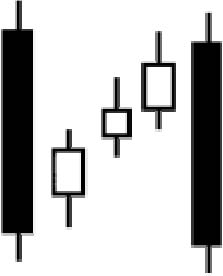 |
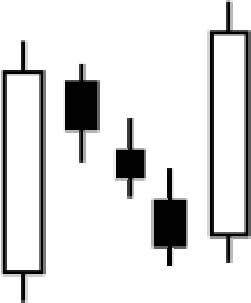
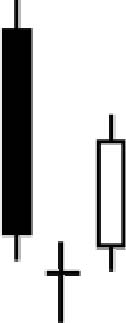
Bearish 3 Pattern: A
long black body followed by several
small bodys and endingin another long
black body. The small bodys are usually
contained within the first black body's
range.
Interpretation: A bearish
continuation pattern. |
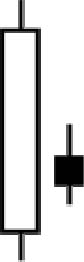 |
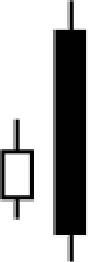
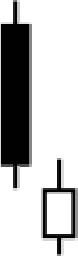
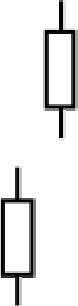
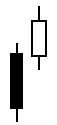
Bearish Harami Pattern:
A very large white
body followed by a small black bodythat
is contained within the previous bar.
Interpretation: A bearish pattern
when preceded by an uptrend. |
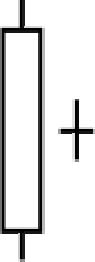 |
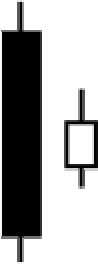
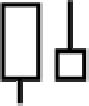
Bearish Harami Cross Pattern:
A Doji contained within a large white
body.
Interpretation: A top reversal signal
|
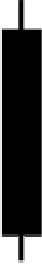 |
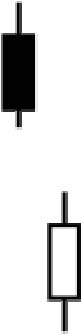
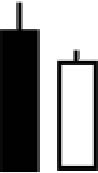
Big Black Candle Pattern:
An unusually long black bodywitha wide
range.Prices open near the high and
close near the low.
Interpretation: A bearish pattern.
|
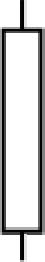 |
Big White Candle Pattern:
A very long white bodywitha wide
range between high and low.Prices open
near the low and close near the high.
Interpretation: A bullish pattern.
|
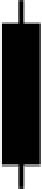 |
BlackBody Pattern:
This candlestick is formed when the
closing price is lower than the opening
price.
Interpretation: A bearish signal.
More important when part of a pattern.
|
 |
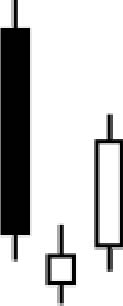
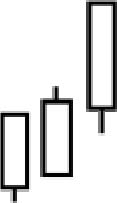
Bullish 3 Pattern: A
long white body followed by three small
bodies, ending in another long white
body. The three small bodies are
contained within the first white body.
Interpretation: A bullish
continuation pattern. |
 |
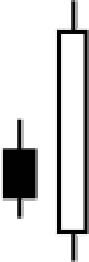
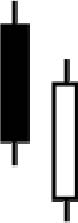
Bullish Harami Pattern:
A very large black bodyis followed by a
small white body and is contained within
the black body.
Interpretation: A bullish pattern
when preceded by a downtrend. |
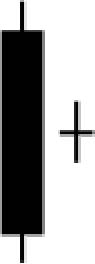 |
Bullish Harami Cross Pattern:
A Doji contained within a large black
body.
Interpretation: A bottom reversal
pattern. |
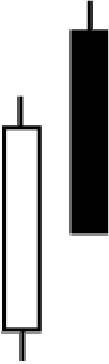 |
Dark Cloud Cover Pattern:
A long white body followed by a black
body.The following black candlestick
opens higher than the white
candlestick's highand closes at least
50% into the white candlestick's body.
Interpretation: A bearish reversal
signal during an uptrend. |
 |
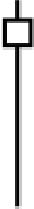
Doji Pattern:
The open and close are the same.
Interpretation: Dojis are usually
components of many candlestick patterns.
This candlestick assumes more importance
the longer the verticle line. |
 |
Doji Star Pattern: A
Doji which gaps above or below a white
or black candlestick.
Interpretation: A reversal signal
confirmed by the next candlestick (eg. a
long white candlestick would confirm a
reversal up). |
 |
Engulfing Bearish Line Pattern:
A small white body followed by and
contained within a large black body.
Interpretation: A top reversal
signal. |
 |
Engulfing Bullish Line Pattern:
A small black body followed byand
contained within a large white body.
Interpretation: A bottom reversal
signal. |
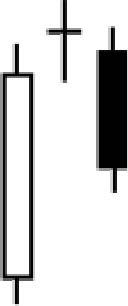 |
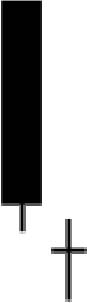
Evening Doji Star Pattern:
A large white body followed by a Doji
that gaps above the white body. The
third candlestick is a black body that
closes 50% or more into the white body.
Interpretation: A top reversal
signal, more bearishthan the regular
eveningstar pattern. |
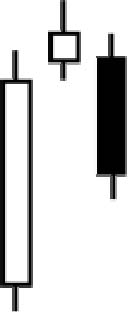 |
Evening Star Pattern:
A large white body followed bya small
body that gaps above the white body. The
third candlestick is a black bodythat
closes 50% or more intothe white body.
Interpretation: A top reversal
signal. |
 |
Falling Window Pattern:
A gap or "window" between the low of the
first candlestick and the high of the
second candlestick.
Interpretation: A rally to the gap is
highly probable. The gap should provide
resistance. |
 |
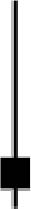
Grave stone Doji Pattern:
The open and close are at the low of the
bar.
Interpretation: A top reversal
signal. The longer the upper wick, the
more bearish the signal. |
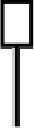 |
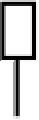
Hammer Pattern: A
small body near the high witha long
lower wick with little or no upper wick.
Interpretation: A bullish pattern
during a downtrend. |
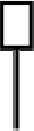 |
Hanging Man Pattern:
A small body near the high with a long
lower wick with little or no upper wick.
The lower wick should be several times
the height of the body.
Interpretation: A bearish pattern
during an uptrend. |
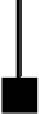 |
Inverted Black Hammer Pattern:
An upside-down hammer witha black body.
Interpretation: A bottom reversal
signal with confirmation the next
trading bar. |
 |
Inverted Hammer Pattern:
An upside-down hammer witha white or
black body.
Interpretation: A bottom reversal
signal with confirmation the next
trading bar. |
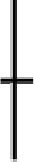 |
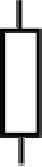
Long Legged Doji Pattern:
A Doji pattern with long upper and lower
wicks.
Interpretation: A top reversal
signal. |
 |
Long Lower Shadow Pattern:
A candlestick with a long lower wick
with a length equal to or longer than
the range of the candlestick.
Interpretation: A bullish signal.
|
 |
Long Upper Shadow Pattern:
A candlestick withan upper wick that has
a length equal toor greater than the
range ofthe candlestick.
Interpretation: A bearish signal.
|
 |
Morning Doji Star Pattern:
A large black body followed by a Doji
that gaps below the black body. The next
candlestick is a white body that closes
50% or more into the black body.
Interpretation: A bottom reversal
signal. |
 |
Morning Star Pattern:
A large black body followed by a small
body that gaps below the black body. The
following candlestick is a white body
that closes 50% or more into the black
body.
Interpretation: A bottom reversal
signal. |
 |
On Neck-Line Pattern:
In a downtrend, a black candlestick is
followed by a small white candlestick
with its close near the low of the black
candlestick.
Interpretation: A bearish pattern
where the market should move lower when
the white candlestick's low is
penetrated by the next bar. |
 |
Piercing Line Pattern:
A black candlestick followed by a white
candlestick that opens lower than the
black candlestick's low, but closes 50%
or more into the black body.
Interpretation: A bottom reversal
signal. |
 |
Rising Window Pattern:
A gap or "window" between the high of
the first candlestick and the low of the
second candlestick.
Interpretation: A sell off to the gap
is highly likely. The gap should provide
support. |
 |
Separating Lines Pattern:
In an uptrend, a black candlestick is
followed by a white candlestick with the
same opening price.
Interpretation: A continuation
pattern. The prior trend should resume.
|
 |
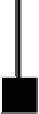
Shaven Bottom Pattern:
A candlestick with no lower wick.
Interpretation: A bottom reversal
signal with confirmation the next
trading bar. |
 |
Shaven Head Pattern:
A candlestick with no upper wick.
Interpretation: A bullish pattern
during a downtrend and a bearish pattern
duringan uptrend. |
 |
Shooting Star Pattern:
A candlestick with a small body, long
upper wick, and little or no lower wick.
Interpretation: A bearish pattern
during an uptrend. |
 |
Spinning Top Pattern:
A candlestick with a small body. The
size of the wicks is not critical.
Interpretation: A neutral pattern
usually associated with other
formations. |
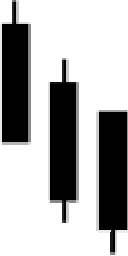 |
Three Black Crows Pattern:
Three long black candlesticks with
consecutively lower closes that close
near their lows.
Interpretation: A top reversal
signal. |
 |
Three White Soldiers Pattern:
Three white candlesticks with
consecutively higher closes that close
near their highs.
Interpretation: A bottom reversal
signal. |
 |
Tweezer Bottoms Pattern:
Twoor more candlesticks with matching
bottoms.The size or color of the
candlestick does not matter.
Interpretation: A Minor reversal
signal. |
 |
Tweezer Tops Pattern:
Two or more candlesticks with similar
tops.
Interpretation: A reversal signal.
|
 |
White Body Pattern: A
candlestick formed when the closing
price is higher than the opening price.
Interpretation: A bullish signal.
|