| Technical Analysis
Articles | Written
by Adam Rosen | |
ATR: Reading Volatility
As buyers and sellers pass through the
marketplace throughout the course of a trading
session, the price charts will simply reflect
the behavior of the two opposing forces, and
their varying waves of strength and weakness.
Like ocean currents, the market will oscillate
between relative degrees of volatility and
direction. Volatility decreases and trading
ranges develop as the market inhales to absorb
capital from both buyers and sellers. Eventually
price action break's out as the volatility
increases, and the market exhales in the
direction of least resistance. The ATR (Average
True Range) gauges the average range from low to
high of each candlestick during its respective
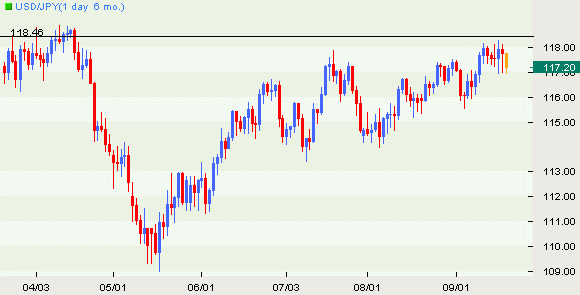
period of time. In the first segment of the
following chart, we can see a trading range
develop as the ATR indicated a decreasing amount
of volatility. Eventually as the market became
complacent, one side of the market took control;
in this case the sellers, as a breakdown
occurred to new low prices. Understanding this
basic mechanism can help us understand when it
is a good time to 'play the range'; as
volatility decreases, and 'buy the breakout' as
volatility increases.
 |