Making the Momentum Indicator Work for You
When analyzing markets I often use the term
"momentum" when referring to the amount of
strength the bulls or bears have at a given
point in time. This market "momentum" is a key
indicator regarding the strength of a trend, or
whether a trend is about to end or begin.
When I worked as a market reporter on the
trading floors of the Chicago Board of Trade and
the Chicago Mercantile Exchange, I (as well the
floor traders) had a very keen sense of which
camp (bulls or bears) had momentum on their
side. This was especially true in the grain pits
at the Board of Trade. One obtained this keen
awareness by being right on the trading floor,
talking with all the market-makers who helped
determine prices.
By examining charts, cycles, seasonality and
other technical indicators-and near-term
fundamentals--one can also get a good reading on
whether the bulls or the bears have the edge in
any given market. However, I must admit that
when trying to gauge market momentum there is no
substitute for working right on the trading
floor and talking face-to-face with the
market-makers. But very few get that
opportunity, so other tools have to be employed.
One such technical tool is the Momentum
indicator.
The Momentum indicator is a popular technical
study. It is easy to calculate and can be
applied in various ways. Momentum can be
calculated by dividing the day’s closing price
by the closing price "X" amount of days ago and
then multiplying the quotient by 100.

The Momentum study is an oscillator-type that
is used to interpret overbought/oversold
markets. It assists in determining the pace at
which price is rising or falling. This indicates
whether a current trend is gaining or losing
momentum, whether or not a market is overbought
or oversold, and whether the trend is slowing
down.
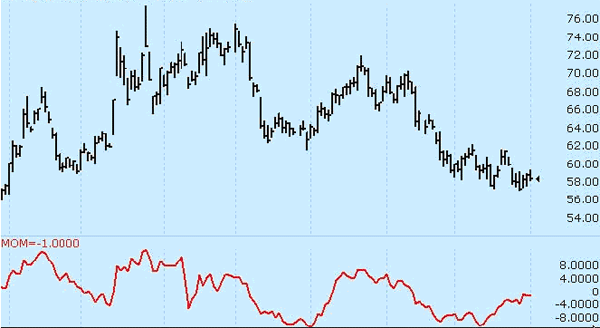
Momentum is calculated by computing the
continuous difference between prices at fixed
intervals. That difference is either a positive
or negative value, which is plotted around a
zero line. When momentum is above the zero line
and rising, prices are increasing at an
increasing rate. If momentum is above the zero
line but is declining, prices are still
increasing but at a decreasing rate.
The opposite is true when momentum falls
below the zero line. If momentum is falling and
is below the zero line, prices are decreasing at
an increasing rate. With momentum below the zero
line and rising, prices are still declining but
at a decreasing rate.
The normal trading rule is: Buy when the
momentum line crosses from below the zero line
to above. Sell when the momentum line crosses
from above the zero line to below. Another
possibility is to establish bands at each
extreme of the momentum line. Initiate or change
positions when the indicator enters either of
those zones. You could modify that rule to enter
a position only when the indicator reaches the
overbought or oversold zone and then exits that
zone.
You specify the length of the momentum
indicator. You must determine a value suitable
to your trading needs and methods. Some
technicians argue the length of the momentum
indicator should equal the normal price cycle.
The best method is to experiment with different
lengths until you find the length that works
best for that particular commodity you are
trading.
Like most other "secondary" trading tools in
my trading toolbox, I do not use the Momentum
indicator, solely, to generate buy and sell
signals, or to gauge the overall technical
situation in a market. I use the Momentum
indicator to help confirm or refute general
ideas I have developed by using my "primary"
trading tools, such as trend lines, chart
patterns and fundamental analysis. |