How I use Bollinger Bands in My Trading
The Bollinger Bands (B-Bands) technical study
was created by John Bollinger, the president of
Bollinger Capital Management Inc., based in
Manhattan Beach, California. Bollinger is well
respected in the futures and equities
industries.
Traders generally use B-Bands to determine
overbought and oversold zones, to confirm
divergences between prices and other technical
indicators, and to project price targets. The
wider the B-bands on a chart, the greater the
market volatility; the narrower the bands, the
less market volatility.
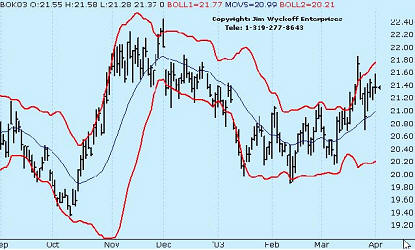
B-Bands are lines plotted on a chart at an
interval around a moving average. They consist
of a moving average and two standard deviations
charted as one line above and one line below the
moving average. The line above is two standard
deviations added to the moving average. The line
below is two standard deviations subtracted from
the moving average.
Some traders use B-Bands in conjunction with
another indicator, such as the Relative Strength
Index (RSI). If the market price touches the
upper B-band and the RSI does not confirm the
upward move (i.e. there is divergence between
the indicators), a sell signal is generated. If
the indicator confirms the upward move, no sell
signal is generated, and in fact, a buy signal
may be indicated.
If the price touches the lower B-band and the
RSI does not confirm the downward move, a buy
signal is generated. If the indicator confirms
the downward move, no buy signal is generated,
and in fact, a sell signal may be indicated.
Another strategy uses the Bollinger Bands
without another indicator. In this approach, a
chart top occurring above the upper band
followed by a top below the upper band generates
a sell signal. Likewise, a chart bottom
occurring below the lower band followed by a
bottom above the lower band generates a buy
signal.
B-Bands also help determine overbought and
oversold markets. When prices move closer to the
upper band, the market is becoming overbought,
and as the prices move closer to the lower band,
the market is becoming oversold.
Importantly, the market's price momentum
should also be taken into account. When a market
enters an overbought or oversold area, it may
become even more so before it reverses. You
should always look for evidence of price
weakening or strengthening before anticipating a
market reversal.
Bollinger Bands can be applied to any type of
chart, although this indicator works best with
daily and weekly charts. When applied to a
weekly chart, the Bands carry more significance
for long-term market changes. John Bollinger
says periods of less than 10 days do not work
well for B-Bands. He says that the optimal
period is 20 or 21 days.
Like most computer-generated technical
indicators, I use B-Bands as mostly an indicator
of overbought and oversold conditions, or for
divergence--but not as a specific generator of
buy and sell signals for my trading
opportunities. It's just one more "secondary"
trading tool, as opposed to my "primary" trading
tools that include chart patterns and trend
lines and fundamental analysis. |