| How I
Trade Using Multiple Timeframes
|
|
|
| Technical Analysis
Articles | Written
by David Floyd | |
How I Trade Using Multiple
Timeframes
Confluence on Three Time Frames Indicates
Solid Short Set-Up
One of the topics I will be addressing in an
upcoming segment of my ongoing FX Tutorials is
combining multiple time frames looking for
'confluence' areas where the technical picture
becomes very clear.
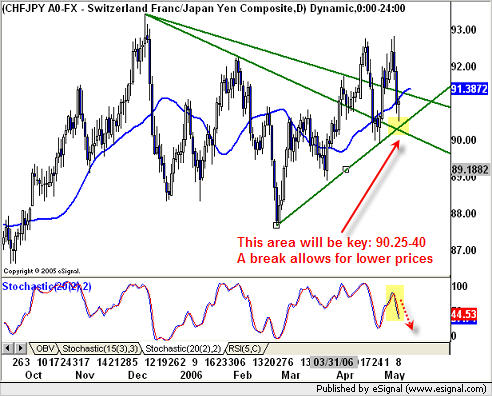
The charts below of CHF/JPY outline a very
basic, yet effective, example of several
resistance an support areas coming together at
the same time that may well result in a solid
short
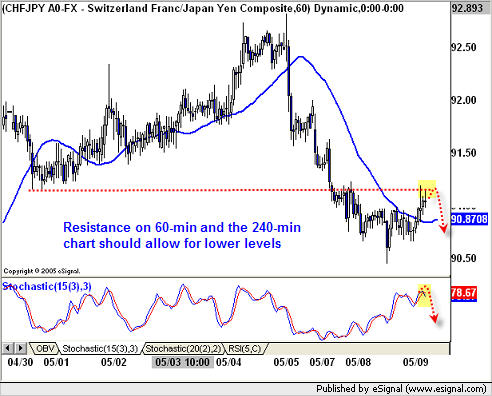

Key Points:
- the 60-min chart finds resistance at a low
from back on April 30th
- the 240-min chart has fib resistance at
roughly the same area, 91.35
- the daily chart has failed at trend-line
resistance and is now set to push below bull
trend-lines (yellow highlighted area)
- momentum, as defined by the stochastics is
bearish, although the 240-min chart exhibits a
bit of upside price pressure |