| Moving Averages |
| Introduction |
Moving averages are one of the most popular and easy to use tools available to the technical analyst. They smooth a data series and make it easier to spot trends, something that is especially helpful in volatile markets. They also form the building blocks for many other technical indicators and overlays.
The two most popular types of moving averages are the Simple Moving Average (SMA) and the Exponential Moving Average (EMA). They are described in more detail below.
| Simple Moving Average (SMA) |
A simple moving average is formed by computing the average (mean) price of a security over a specified number of periods. While it is possible to create moving averages from the Open, the High, and the Low data points, most moving averages are created using the closing price. For example: a 5-day simple moving average is calculated by adding the closing prices for the last 5 days and dividing the total by 5.
The calculation is repeated for each price bar on the chart. The averages are then joined to form a smooth curving line - the moving average line. Continuing our example, if the next closing price in the average is 15, then this new period would be added and the oldest day, which is 10, would be dropped. The new 5-day simple moving average would be calculated as follows:
Over the last 2 days, the SMA moved from 12 to 13. As new days are added, the old days will be subtracted and the moving average will continue to move over time.
In the example above, using closing prices from Eastman Kodak (EK), day 10 is the first day possible to calculate a 10-day simple moving average. As the calculation continues, the newest day is added and the oldest day is subtracted. The 10-day SMA for day 11 is calculated by adding the prices of day 2 through day 11 and dividing by 10. The averaging process then moves on to the next day where the 10-day SMA for day 12 is calculated by adding the prices of day 3 through day 12 and dividing by 10.
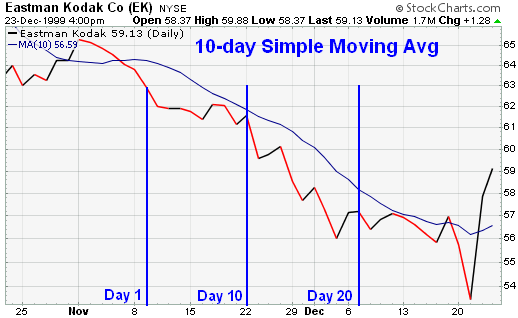
The chart above is a plot that contains the data sequence in the table. The simple moving average begins on day 10 and continues.
This simple illustration highlights the fact that all moving averages are lagging indicators and will always be "behind" the price. The price of EK is trending down, but the simple moving average, which is based on the previous 10 days of data, remains above the price. If the price were rising, the SMA would most likely be below. Because moving averages are lagging indicators, they fit in the category of trend following indicators. When prices are trending, moving averages work well. However, when prices are not trending, moving averages can give misleading signals.
| Exponential Moving Average (EMA) |
In order to reduce the lag in simple moving averages, technicians often use exponential moving averages (also called exponentially weighted moving averages). EMAs reduce the lag by applying more weight to recent prices relative to older prices. The weighting applied to the most recent price depends on the specified period of the moving average. The shorter the EMA's period, the more weight that will be applied to the most recent price. For example: a 10-period exponential moving average weighs the most recent price 18.18% while a 20-period EMA weighs the most recent price 9.52%. As we'll see, the calculating and EMA is much harder than calculating an SMA. The important thing to remember is that the exponential moving average puts more weight on recent prices. As such, it will react quicker to recent price changes than a simple moving average. Here's the calculation formula.
Exponential Moving Average Calculation
Exponential Moving Averages can be specified in two ways - as a percent-based
EMA or as a period-based EMA. A percent-based EMA has a percentage as it's
single parameter while a period-based EMA has a parameter that represents the
duration of the EMA.
The formula for an exponential moving average is:
EMA(current) = ( (Price(current) - EMA(prev) ) x Multiplier) + EMA(prev)
For a percentage-based EMA, "Multiplier" is equal to the EMA's specified percentage.
For a period-based EMA, "Multiplier" is equal to 2 / (1 + N) where N is the specified number of periods.
For example, a 10-period EMA's Multiplier is calculated like this:
This means that a 10-period EMA is equivalent to an 18.18% EMA.
Note: StockCharts.com only support period-based EMAs.
Below is a table with the results of an exponential moving average calculation for Eastman Kodak. For the first period's exponential moving average, the simple moving average was used as the previous period's exponential moving average (yellow highlight for the 10th period). From period 11 onwards, the previous period's EMA was used. The calculation in period 11 breaks down as follows:
*The 10-period simple moving average is used for the first calculation only.
After that the previous period's EMA is used.
(Click here to download this table as an Excel spreadsheet.)
Note that, in theory, every previous closing price in the data set is used in the calculation of each EMA that makes up the EMA line. While the impact of older data points diminishes over time, it never fully disappears. This is true regardless of the EMA's specified period. The effects of older data diminish rapidly for shorter EMAs than for longer ones but, again, they never completely disappear.
| Simple Versus Exponential |
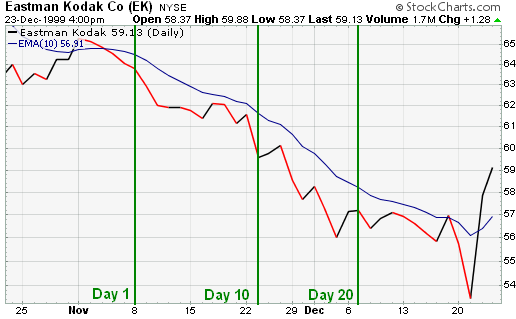
From afar, it would appear that the difference between an exponential moving average and a simple moving average is minimal. For this example, which uses only 20 trading days, the difference is minimal, but a difference nonetheless. The exponential moving average is consistently closer to the actual price. On average, the EMA is 3/8 of a point closer to the actual price than the SMA.
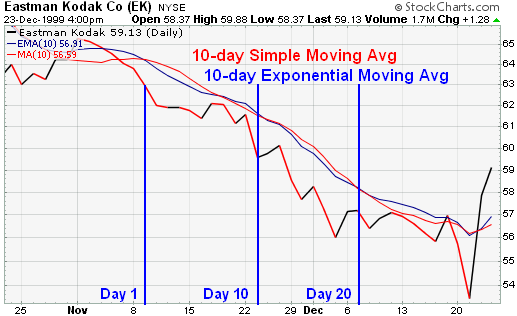
From day 10 to day 20, the EMA was closer to the price than the SMA 9 out of 10 times. The only time the SMA was closer was in period number 18, and this did not last long. The average absolute difference between the exponential moving average and the current price was 1 and the simple moving average had an average absolute difference of 1.33. This means that on average, the exponential moving average was 1 point above or below the current price and the simple moving average was 1.33 points above or below the current price.
When EK stopped falling and started to trade flat, the SMA kept on declining. During this period, the SMA was closer to the actual price than the EMA. The EMA began to level out with the actual price and remain further away. This was because the actual price started to level out. Because of its lag, the SMA continued to decline and even touched the actual price on 13-Dec.

A comparison of a 50-day EMA and a 50-day SMA for IBM also shows that the EMA picks up on the trend quicker than the SMA. The blue arrows mark points when the stock started a strong trend. By giving more weight to recent prices, the EMA reacted quicker than the SMA and remained closer to the actual price. The gray circle shows when the trend began to slow and a trading range developed. When the change from trend to trading began, the SMA was closer to the price. As the trading range continued into 2001, both moving averages converged. In early 2001, CPQ started to trend up and the EMA was quicker to pick up on the recent price change and remain closer to the price.
| Which is better? |
Which moving average you use will depend on your trading and investing style and preferences. The simple moving average obviously has a lag, but the exponential moving average may be prone to quicker breaks. Some traders prefer to use exponential moving averages for shorter time periods to capture changes quicker. Some investors prefer simple moving averages over long time periods to identify long-term trend changes. In addition, much will depend on the individual security in question. A 50-day SMA might work great for identifying support levels in the Nasdaq, but a 100-day EMA may work better for the Dow Transports. Moving average type and length of time will depend greatly on the individual security and how it has reacted in the past.
The initial thought for some is that greater sensitivity and quicker signals are bound to be beneficial. This is not always true and brings up a great dilemma for the technical analyst: the trade off between sensitivity and reliability. The more sensitive an indicator is, the more signals that will be given. These signals may prove timely, but with increased sensitivity comes an increase in false signals. The less sensitive an indicator is, the fewer signals that will be given. However, less sensitivity leads to fewer and more reliable signals. Sometimes these signals can be late as well.
For moving averages, the same dilemma applies. Shorter moving averages will be more sensitive and generate more signals. The EMA, which is generally more sensitive than the SMA, will also be likely to generate more signals. However, there will also be an increase in the number of false signals and whipsaws. Longer moving averages will move slower and generate fewer signals. These signals will likely prove more reliable, but they also may come late. Each investor or trader should experiment with different moving average lengths and types to examine the trade-off between sensitivity and signal reliability.
| Moving Averages |
Trend-Following Indicator
Moving averages smooth out a data series and make it easier to identify the
direction of the trend. Because past price data is used to form moving averages,
they are considered lagging, or trend following, indicators. Moving averages
will not predict a change in trend, but rather follow behind the current trend.
Therefore, they are best suited for trend identification and trend following
purposes, not for prediction.
When to Use
Because moving averages follow the trend, they work best when a security is
trending and are ineffective when a security moves in a trading range. With this
in mind, investors and traders should first identify securities that display
some trending characteristics before attempting to analyze with moving averages.
This process does not have to be a scientific examination. Usually, a simple
visual assessment of the price chart can determine if a security exhibits
characteristics of trend.
In its simplest form, a security's price can be doing only one of three things: trending up, trending down or trading in a range. An uptrend is established when a security forms a series of higher highs and higher lows. A downtrend is established when a security forms a series of lower lows and lower highs. A trading range is established if a security cannot establish an uptrend or downtrend. If a security is in a trading range, an uptrend is started when the upper boundary of the range is broken and a downtrend begins when the lower boundary is broken.
Ford
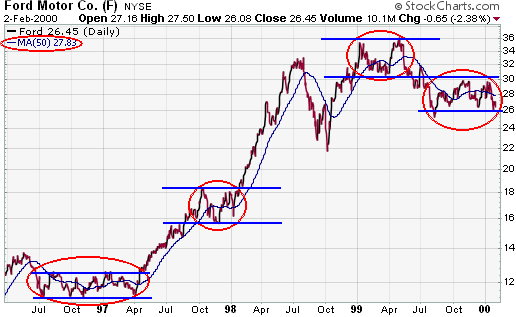
In the Ford example, it is evident that a stock can go through both trending and trading phases. The red circles indicate trading range phases that are interspersed among trending periods. It is sometimes difficult to determine when a trend will stop and a trading range will begin or when a trading range will stop and a trend will begin. The basic rules for trends and trading ranges laid out above can be applied to Ford. Notice the trading range periods, the breakouts (both up and down) and the trending periods. The moving average worked well in times of trend, but faired poorly in times of trading. Also note how the moving average lags behind the trend: it is always under the price during an uptrend and above the price during a downtrend. A 50-day simple moving average was used for this example. However, the number of periods is optional and much will depend on the characteristics of the security as well as an individual's trading and investing style.
Coca-Cola
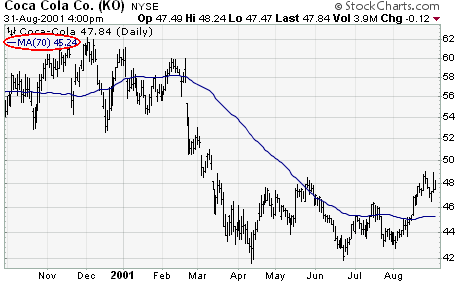
If price movements are choppy and erratic over an extended period of time, then a moving average is probably not the best choice for analysis. The chart for Coca-Cola shows a security that moved from 60 to 40 in a couple months in 2001. Prior to this decline, the price gyrated above and below its moving average. After the decline, the stock continued its erratic behavior without developing much of a trend. Trying to analyze this security based on a moving average is likely to be a lesson in futility.
Time Warner
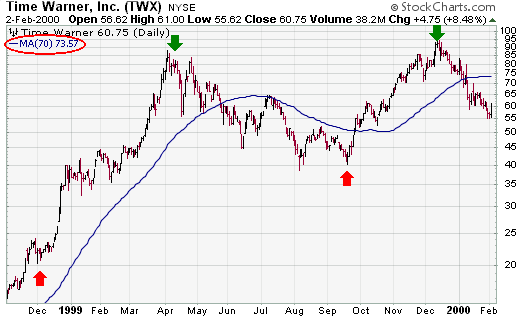
A quick look at the chart for Time Warner shows a different picture than for MMM. Over the same time period, Time Warner has shown the ability to trend. There are 3 distinct trends or price movements that extend for a number of months. Once the stock moves above or below the 70-day SMA, it usually continues in that direction for a little while longer. MMM, on the other hand, broke above and below its 70-day SMA numerous times and would have been prone to numerous whipsaws. A longer moving average would probably work better for MMM, but it is clear that there are fewer characteristics of trend than in Time Warner.
Moving Average Settings
Once a security has been deemed to have enough characteristics of trend, the
next task will be to select the number of moving average periods and type of
moving average. The number of periods used in a moving average will vary
according to the security's volatility, trendiness and personal preferences. The
more volatility there is, the more smoothing that will be required and hence the
longer the moving average. Stocks that do not exhibit strong characteristics of
trend may also require longer moving averages. There is no one set length, but
some of the more popular lengths include 21, 50, 89, 150 and 200 days as well as
10, 30 and 40 weeks. Short-term traders may look for evidence of 2-3 week trends
with a 21-day moving average, while longer-term investors may look for evidence
of 3-4 month trends with a 40-week moving average. Trial and error is usually
the best means for finding the best length. Examine how the moving average fits
with the price data. If there are too many breaks, lengthen the moving average
to decrease its sensitivity. If the moving average is slow to react, shorten the
moving average to increase its sensitivity. In addition, you may want to try
using both simple and exponential moving averages. Exponential moving averages
are usually best for short-term situations that require a responsive moving
average. Simple moving averages work well for longer-term situations that do not
require a lot of sensitivity.
| Uses for Moving Averages |
There are many uses for moving averages, but three basic uses stand out:
Trend Identification/Confirmation
There are three ways to identify the direction of the trend with moving
averages: direction, location and crossovers.
The first trend identification technique uses the direction of the moving average to determine the trend. If the moving average is rising, the trend is considered up. If the moving average is declining, the trend is considered down. The direction of a moving average can be determined simply by looking at a plot of the moving average or by applying an indicator to the moving average. In either case, we would not want to act on every subtle change, but rather look at general directional movement and changes.
Disney
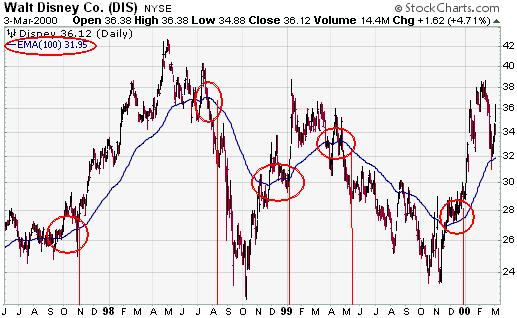
In the case of Disney, a 100-day exponential moving average (EMA) has been used to determine the trend. We do not want to act on every little change in the moving average, but rather significant upturns and downturns. This is not a scientific study, but a number of significant turning points can be spotted just based on visual observation (red circles). A few good signals were rendered, but also a few whipsaws and late signals. Much of the performance would depend on your entry and exit points. The length of the moving average influences the number of signals and their timeliness. Moving averages are lagging indicators. Therefore, the longer the moving average is, the further behind the price movement it will be. For quicker signals, a 50-day EMA could have been used.
The second technique for trend identification is price location. The location of the price relative to the moving average can be used to determine the basic trend. If the price is above the moving average, the trend is considered up. If the price is below the moving average, the trend is considered down.
Cisco
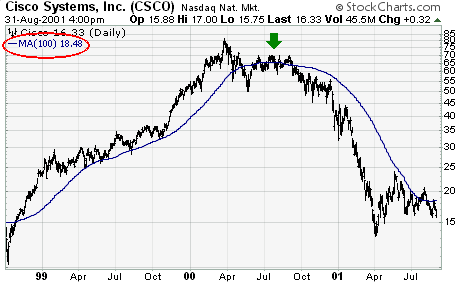
This example is pretty straightforward. The long-term for CSCO is determined by the location of the stock relative to its 100-day SMA. When CSCO is above its 100-day SMA, the trend is considered bullish. When the stock is below the 100-day SMA, the trend is considered bearish. Buy and sell signals are generated by crosses above and below the moving average. There was a brief sell signal generated in Aug-99 and a false buy signal in July-00. Both of these signals occurred when Cisco's trend began to weaken. For the most part though, this simple method would have kept an investor in throughout most of the bull move.
The third technique for trend identification is based on the location of the shorter moving average relative to the longer moving average. If the shorter moving average is above the longer moving average, the trend is considered up. If the shorter moving average is below the longer moving average, the trend is considered down.
Inter-Tel
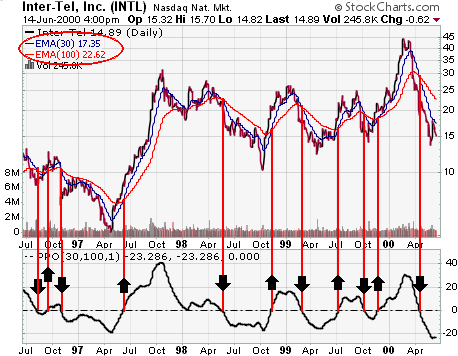
For Inter-Tel, a 30/100 moving average crossover was used to determine the trend. When the 30-day moving average moves above the 100-day moving average, the trend is considered bullish. When the 30-day moving average declines below the 100-day moving average, the trend is considered bearish. A plot of the 30/100 differential is plotted below the price chart by using the Percentage Price Oscillator (PPO) set to (30,100,1). When the differential is positive the trend is considered up -- when it is negative the trend is considered down. As with all trend-following systems, the signals work well when the stock develops a strong trend, but are ineffective when the stock is in a trading range. Also notice that the signals tend to be late and after the move has begun. Again, trend following indicators are best for identification and following, not predicting.
Support and Resistance Levels
Another use of moving averages is to identify support and resistance levels.
This is usually accomplished with one moving average and is based on historical
precedent. As with trend identification, support and resistance level
identification through moving averages works best in trending markets.
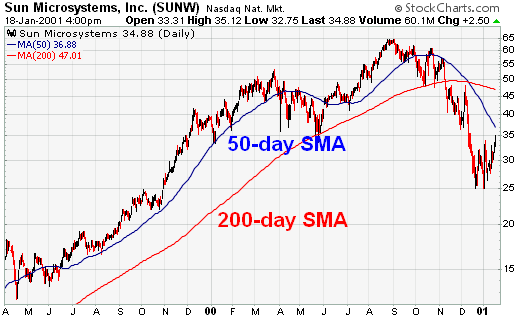
Sun Microsystems
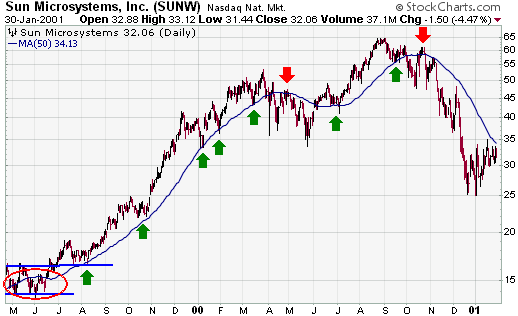
After breaking out of a trading range, Sun Microsystems successfully tested moving average support in late July and early August. Also notice that the June resistance breakout near 18 turned into support. Therefore, the moving average acted as a confirmation of resistance-turned-support. After this first test, the 50-day moving average went on to 4 more successful support tests over the next several months. A break of support from the 50-day moving average would serve as a warning that the stock may move into a trading range or may be about to change the direction of the trend. Such a break occurred in Apr-00 and the 50-day SMA turned into resistance later that month. When the stock broke above the 50-day SMA in early Jun-00, it returned to a support level until the Oct-00 break. In Oct-00, the 50-day SMA became a resistance level and that held for many months.
| Moving Averages and SharpCharts2 |
Moving averages are available as a price overlay feature on SharpCharts2. From the price overlay option, you can choose either a simple moving average or an exponential moving average. The first box to the right is used to set the number of time periods. If charting on daily periods, then 50 would be for a 50-day moving average. If charting on weekly periods, then 50 would be for a 50-week moving average. The second box can be used to shift the MA lines to the left or right by a specified number of periods. The moving averages are based on closing prices and multiple moving averages can be overlaid the price plot.
| Conclusions |
Moving averages can be effective tools to identify and confirm trend, identify support and resistance levels, and develop trading systems. However, traders and investors should learn to identify securities that are suitable for analysis with moving averages and how this analysis should be applied. Usually, an assessment can be made with a visual examination of the price chart, but sometimes it will require a more detailed approach. The ADX, Average Directional Index, is one tool that can help identify securities that are trending and those that are not.
The advantages of using moving averages need to be weighed against the disadvantages. Moving averages are trend following, or lagging, indicators that will always be a step behind. This is not necessarily a bad thing though. After all, the trend is your friend and it is best to trade in the direction of the trend. Moving averages will help ensure that a trader is in line with the current trend. However, markets, stocks and securities spend a great deal of time in trading ranges, which render moving averages ineffective. Once in a trend, moving averages will keep you in, but also give late signals. Don't expect to get out at the top and in at the bottom using moving averages. As with most tools of technical analysis, moving averages should not be used on their own, but in conjunction with other tools that complement them. Using moving averages to confirm other indicators and analysis can greatly enhance technical analysis.