| Market Indicators Part 2 |
| Advance-Decline Line |
The Advanced-Decline Line (AD Line) is a popular indicator of market breadth that is used to help determine the direction of the stock market. Since this indicator includes price data from the entire market, analysts often prefer using it to gauge the strength of the market, rather than using a smaller sample such as the Dow Jones Industrial Average.
It is calculated each day by taking the difference between the number of advancing stocks and the number of declining stocks. If that difference is positive, the AD Line goes up by that amount. It is a running cumulative total of the number of advancing stocks minus the number of declining stocks. Therefore, a rising AD Line implies that most stocks are advancing (bullish), while a falling AD Line implies that most stocks are declining (bearish).
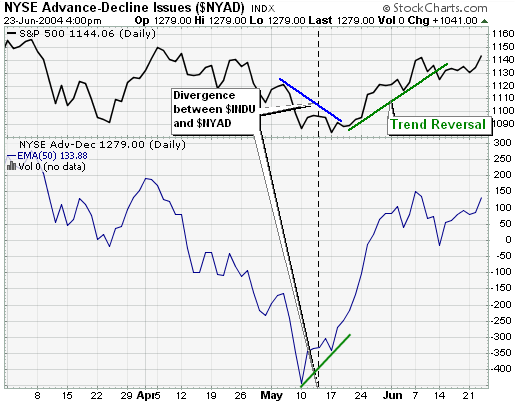
As mentioned earlier, plotting the AD Line allows insight into market strength. When compared to a market average such as the S&P 500, divergence from that average could be an early indication of a possible trend reversal.
The above chart shows the NYSE AD Line compared to the S&P 500. The divergence that occurred in mid-May suggested that the market was gaining strength even as the S&P 500 was still declining. This Bullish AD Line reversal was confirmed by the following trend reversal of the S&P 500.
| McClellan Oscillator |
Developed by Sherman and Marian McClellan, the McClellan Oscillator is a breadth indicator derived from each day's net advances, the number of advancing issues less the number of declining issues. Subtracting the 39-day exponential moving average from the 19-day exponential moving average of net advances forms the oscillator.
Similar to MACD, the McClellan Oscillator is a momentum indicator that is applied to the advance/decline statistics. When the 19-day EMA (shorter moving average) moves above the 39-day (longer moving average) EMA, it signals that advances are gaining the upper hand. Conversely, when the 19-day EMA declines below the 39-day EMA, it signals that declining issues are dominant. As a momentum indicator, the McClellan Oscillator attempts to anticipate positive and negative changes in the AD statistics for market timing.
Buy and sell signals are generated as well as overbought and oversold readings. Usually, readings above +100 are considered overbought and below -100 oversold. Overbought and oversold readings may vary among indices and historical precedent. Buy signals are generated when the oscillator advances from oversold levels to positive territory. Sell signals are generated on declines from overbought to negative territory. Traders may also look for positive or negative divergences to time their trades. A series of rising troughs would denote strength, while a series of declining peaks weakness.
Calculation
When calculating the McClellan Oscillator, the ratio adjusted index is often used for easier comparisons over long periods of time. The basic input for the ratio-adjusted version is no longer the daily advances minus declines. Rather you:
1. Subtract declines from advances
2. Divide the result by the total of advances plus declines, and
3. Multiply that result by 1000. (Multiplying by 1000 is simply cosmetic and lets us work with whole numbers instead of decimals.)
The rest of the calculations for the Oscillator are the same.
Example
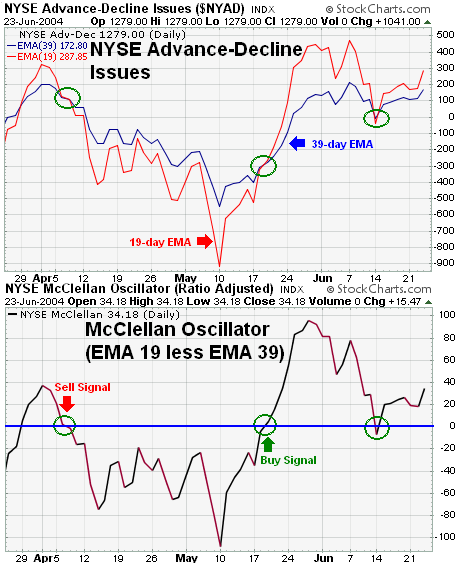
The above chart shows the breakdown of the McClellan Oscillator. The top window shows the 19-day EMA and the 39-day EMA of the NYSE advance-decline issues, and the lower window shows the ratio adjusted McClellan Oscillator line. Notice that the 19-day and 39-day EMA crossovers correspond with zero-line crossovers on the McClellan Oscillator.
| McClellan Summation Index |
The McClellan Summation Index is a popular market breadth indicator that is ultimately derived from the number of advancing and declining stocks in a given market. It is derived from the McClellan Oscillator by tracking its daily accumulation or "summation". This provides a longer-term view of the McClellan concept. Many people regard it as an excellent indicator of the overall "health" of the market and the market's current trend. It was developed by Sherman and Marian McClellan and first presented in their book "Patterns for Profit" (available from McClellan Financial Publications).
Calculation
There are two methods for calculating the Summation Index. The first method (the one originally used by the McClellans) simply maintains a running total of the values of the McClellan Oscillator (which is defined here). The second method uses the following formula:
Summation Index =
1000 + (10%Trend - 5%Trend) - ((10 x 10%Trend) + (20 x 5%Trend))
where:
5%Trend = 39-day EMA of (Advancers-Decliners)
10%Trend = 19-day EMA of (Advancers-Decliners)
The McClellan Summation index generally oscillates between 0 and 2000 although it can move outside of this range during extreme or unusual market conditions. Historically, major market bottoms occur after the index falls below -1000. Readings above +1600 often indicate a major top is near. Top and bottom signals carry more significance if the index is also diverging from the associated market average. According to the McClellans, the beginning of a new bull market is signaled if the NYSE-based Summation index first moves below the -1200 level and then quickly rises above +2500.
The Summation Index is simply a longer range version of the McClellan Oscillator. Whereas the McClellan Oscillator is used for short to intermediate trading purposes, the Summation Index provides a longer range view of market breadth and is used to spot major market turning points.
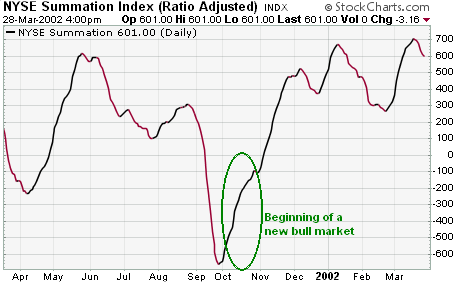
The chart above shows the ratio adjusted NYSE McClellan Summation Index. The sharp move from -650 in late September to 675 in less than four months can be interpreted as a major bullish turning point in the market.
The ratio adjusted index is calculated differently and is used for easier comparisons over long periods of time. First, the basic input for the ratio-adjusted version is no longer the daily advances minus declines. Rather you (1) subtract declines from advances, (2) divide the result by the total of advances plus declines, and (3) multiply that result by 1000. (Multiplying by 1000 is simply cosmetic and lets us work with whole numbers instead of decimals.) The rest of the calculations for the Oscillator are the same. The second difference is that zero (0) is now considered neutral for the Summation Index, so you no longer begin with 1000 in your Summation Index calculation.
| Stocks Above Their 200-Day, 150-Day, Or 50-Day Moving Averages |
These market breadth indicators represent the number of stocks in a given group that have closing prices that are currently above their 200, 150, or 50-day simple moving average. Because the number of stocks in the underlying group can vary from day to day, the actual value of these indicators is less important than the shape of their charts.
Common techniques for using these indicators include locating overbought/oversold levels and finding positive or negative divergences between them and the underlying group's composite index. Standard peak and trough trendline analysis is used in most cases.
At StockCharts.com, you can track all stocks that have exceeded these moving average levels within the most popular indices such as the Nasdaq 100 or the S&P 500. The symbols ending in "R" track the ratio of stocks exceeding the moving average to the stocks that are not.
For example, the symbol $OEXA200R tracks the percentage of stocks that are above their 200-day moving average, while $OEXA200 tracks the number of stocks above their 200-day moving average.
Click on a symbol below to see how many (or what percent of) stocks are exceeding their moving averages
|
Symbol
|
Name |
||
| $DOWA150 | $DOWA150R | DJ Industrials Stocks Above 150 Day Moving Average | |
| $DOWA200 | $DOWA200R | DJ Industrials Stocks Above 200 Day Moving Average | |
| $DOWA50 | $DOWA50R | DJ Industrials Stocks Above 50 Day Moving Average | |
| $NAA150 | $NAA150R | Nasdaq Stocks Above 150 Day Moving Average | |
| $NAA200 | $NAA200R | Nasdaq Stocks Above 200 Day Moving Average | |
| $NAA50 | $NAA50R | Nasdaq Stocks Above 50 Day Moving Average | |
| $NDXA150 | $NDXA150R | Nasdaq 100 Stocks Above 150 Day Moving Average | |
| $NDXA200 | $NDXA200R | Nasdaq 100 Stocks Above 200 Day Moving Average | |
| $NDXA50 | $NDXA50R | Nasdaq 100 Stocks Above 50 Day Moving Average | |
| $NYA150 | $NYA150R | NYSE Stocks Above 150 Day Moving Average | |
| $NYA200 | $NYA200R | NYSE Stocks Above 200 Day Moving Average | |
| $NYA50 | $NYA50R | NYSE Stocks Above 50 Day Moving Average | |
| $OEXA150 | $OEXA150R | S&P 100 Stocks Above 150 Day Moving Average | |
| $OEXA200 | $OEXA200R | S&P 100 Stocks Above 200 Day Moving Average | |
| $OEXA50 | $OEXA50R | S&P 100 Stocks Above 50 Day Moving Average | |
| $SPXA150 | $SPXA150R | S&P 500 Stocks Above 150 Day Moving Average | |
| $SPXA200 | $SPXA200R | S&P 500 Stocks Above 200 Day Moving Average | |
| $SPXA50 | $SPXA50R | S&P 500 Stocks Above 50 Day Moving Average | |
| $TSXA150 | $TSXA150R | S&P/TSX Composite Stocks Above 150 Day Moving Average | |
| $TSXA200 | $TSXA200R | S&P/TSX Composite Stocks Above 200 Day Moving Average | |
| $TSXA50 | $TSXA50R | S&P/TSX Composite Stocks Above 50 Day Moving Average | |
If you are very interested in using market indicators to improve your investment decisions, we recommend you visit DecisionPoint.com