Part 1 | Part 2
|
Market Indicators Part 1 Part 1 | Part 2 |
| Introduction |
This article is designed to introduce the concept of market indicators and explain how to use them in your analysis. We will see how market indicators differ from technical indicators, and why they are just as important for making investment decisions. Most of this article covers specific market indicators so you can begin using them to your advantage right away.
Here is a list of the market indicators covered in this article:
Stocks above their 200, 150, or 50-Day SMA
| What is a Market Indicator? |
Like a technical indicator, a market indicator is a series of data points derived from a formula. In this case, however, the formula for market indicators is applied to the price data for multiple securities within the market, instead of just one security. Price data can come from open, high, low or close points for the securities, their volume, or both. This data is entered into the indicator formula and the data point is produced.
Unlike technical indicators, market indicators are not charted above or below the chart. Market indicators are what is being charted, and as such have their own ticker symbols. There are often many symbols that apply the market indicator formula simply to different markets. For example, the $BPSPX and $BPNDX track the Bullish Percent Index for the S&P 500 and the Nasdaq 100 respectively.
| Bullish Percent Index (BPI) |
The Bullish Percent Index (BPI) is a popular market breadth indicator that is calculated by dividing the number of stocks in a given group (an exchange, an industry, etc.) that are currently trading with Point and Figure buy signals, by the total number of stocks in that group. Bullish Percent levels that are above 70% are considered overbought, whereas levels below 30% are considered oversold. Strong buy signals occur when the Bullish Percent Index falls below 30% and then reverses up by at least 6%. Conversely, promising sell signals occur when it goes above 70%, and then reverses down by at least 6%.
It is important to note that the Bullish Percent Index is not something that can be applied to a single stock but rather an index that is calculated for a group of stocks.
The most popular version of this chart is the NYSE Bullish Percent ($BPNYA) which is mentioned prominently in Thomas Dorsey's book, Point & Figure Charting however it is important to remember that the Bullish Percent index can be calculated for any grouping of stocks.
Because the NYSE's Bullish Percent Index is so closely followed, each day we also publish the list of NYSE stocks with P&F buy signals as well as the list of all stocks in the current NYSE "universe". Those lists can be found on our NYSE BPI Components page.
Traditionally, the Bullish Percent indicator is charted on a Point and Figure chart using a 2 point box size. However, the indicator can also be charted and studied using standard charts as well.
| TRIN |
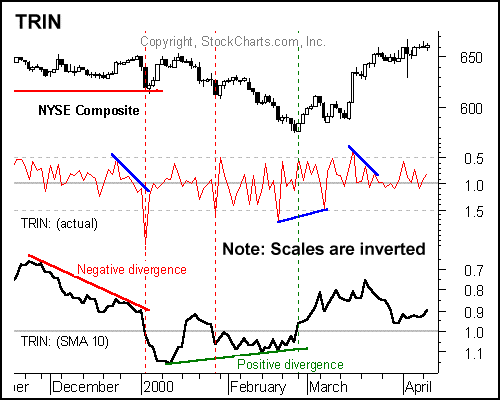
Richard Arms developed the TRIN, or Arms index, as a contrarian indicator to detect overbought and oversold levels in the market. Because of its calculation method, the TRIN has an inverse relationship with the market. Generally, a rising TRIN is bearish and a falling TRIN is bullish. Sometimes you will see the scale of the TRIN inverted to reflect this inverse relationship.
Calculation
The TRIN is the advance/decline ratio divided by the advance volume/decline volume ratio:
((Advancing issues/declining issues) / (advancing volume/declining volume))
Examples of TRIN calculations:
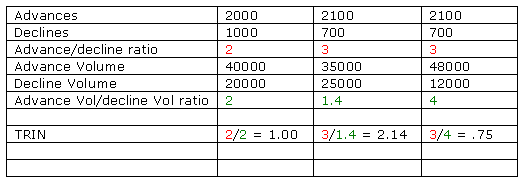
In the first example, the ratios were equal and the TRIN was 1, which indicates a standoff. Volume flowing into advancing stocks was virtually equal to volume flowing into declining stocks. In the second example, the up volume/down volume ratio did not keep up with the advance/decline ratio and the TRIN rose above 1.
A TRIN above 1 indicates that the volume in declining stocks outpaced the volume in advancing stocks. In the final example the TRIN was below 1, indicating the volume in advancing stocks was healthy and outpaced the volume in declining stocks.
NYSE
Use
A number of TRIN interpretations have evolved over the years. Richard Arms,
the originator, uses the TRIN to detect extreme conditions in the market. He
considers the market to be overbought when the 10-day moving average of the TRIN
declines below .8 and oversold when it moves above 1.2. Other interpretations
seek to use the direction and absolute level of the TRIN to determine bullish
and bearish scenarios. In the momentum driven markets, the TRIN can remain
oversold or overbought for extended periods of time.
| VIX |
Introduced by the CBOE in 1993, VIX is a weighted measure of the implied volatility for 8 OEX put and call options. The 8 puts and calls are weighted according to time remaining and the degree to which they are in or out of the money. The result forms a composite hypothetical option that is at-the-money and has 30 days to expiration. (An at-the-money option means that the strike price and the security price are the same.) VIX represents the implied volatility for this hypothetical at-the-money OEX option.
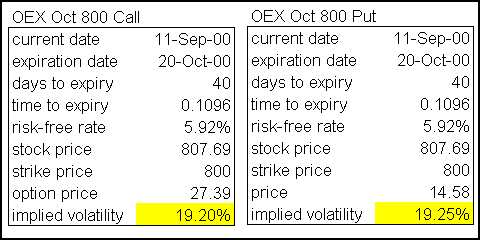
OEX options are by far the most traded and most liquid index options on the CBOE. Because of their dominant activity, OEX options represent a good proxy for implied volatility of the market as a whole. As OEX trades, VIX is updated throughout the day and can be tracked as an intraday, daily, weekly or monthly indicator of implied volatility and market expectations.
Typically, VIX (and by extension implied volatility) has an inverse relationship to the market. A chart of the VIX will usually be shown with the scale inverted to show the low readings at the top and high readings at the bottom. The value of VIX increases when the market declines and decreases when the market rises. It seems that volatility would be a two-way street. However, the stock market has a bullish bias. A rising stock market is viewed as less risky and a declining stock market more risky. The higher the perceived risk is in stocks, the higher the implied volatility and the more expensive the associated options, especially puts. Hence, implied volatility is not about the size of the price swings, but rather the implied risk associated with the stock market. When the market declines, the demand for puts usually increases. Increased demand means higher put prices and higher implied volatilities.
Use
For contrarians, comparing VIX action with that of the market can yield good clues on future direction or duration of a move. The further VIX increases in value, the more panic there is in the market. The further VIX decreases in value, the more complacency there is in the market. As a measure of complacency and panic, VIX is often used as a contrarian indicator. Prolonged and/or extremely low VIX readings indicate a high degree of complacency and are generally regarded at bearish. Some contrarians view readings below 20 as excessively bearish. Conversely, prolonged and/or extremely high VIX readings indicate a high degree or anxiety or even panic among options traders and are regarded at bullish. High VIX readings usually occur after an extended or sharp decline and sentiment is still quite bearish. Some contrarians view readings above 30 as bullish.
Conflicting signals between VIX and the market can also yield sentiment clues for the short term. Overly bullish sentiment or complacency is regarded as bearish by contrarians. On the other hand, overly bearish sentiment or panic is regarded as bullish. If the market declines sharply and VIX remains unchanged or decreases in value (towards complacency), it could indicate that the decline has further to go. Contrarians might take the view that there is still not enough bearishness or panic in the market to warrant a bottom. If the market advances sharply and VIX increases in value (towards panic), it could indicate that the advance has further to go. Contrarians might take the view that there is not enough bullishness or complacency to warrant a top.
$VIX and $OEX
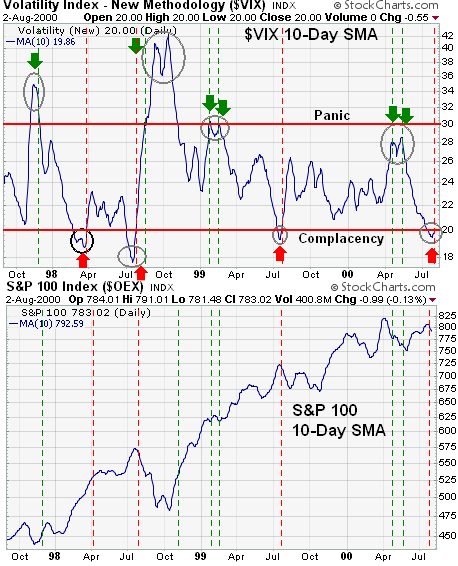
The chart above shows the relationship between VIX and OEX. Generally, VIX decreases in value as OEX rises, and visa versa. A 10-day SMA was applied to both the VIX and OEX for smoothing. Over the last three years (Oct-97 to Sept-00), VIX produced roughly 7 extreme readings greater than 30 or less than 20. The four readings above 30 indicated excessive bearishness, panic or an extremely high implied volatility: Nov-97, Sept-98, Feb-99 and Apr-00 (green arrows). The three readings below 20 indicated excessive bullishness, complacency or low implied volatility (red arrows).
Once the extreme readings were recorded, a confirmation signal was given when VIX returned above 20 or below 30 (vertical dotted line). Except for the first bearish signal in Mar-98 (black circle), most of the signals were pretty timely. Two of the bullish signals produced small double bottoms in the VIX that could have led to small whipsaws, but the subsequent "second" signals proved quite profitable. As of this writing (13 September 2000), the VIX 10-day SMA has just risen above 20 and this could be considered the fourth signal of excessive bullishness or complacency among option traders.
Note on Rex Takasugi's VIX chart: Rex inverts VIX by taking the reciprocal of the open, high, low and close. If VIX is 30, then 1/30 = .033
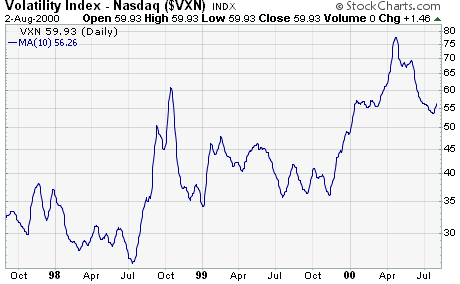
$VXN
The CBOE Nasdaq Volatility Index ($VXN) employs the same formula used to calculate $VIX, which is based on the implied volatility of S&P 500 index options. This formula is derived from a basket of put and call options. Some are out of the money, some in the money and some at the money. The resulting $VXN represents the implied volatility of a hypothetical 30-day option that is at the money.
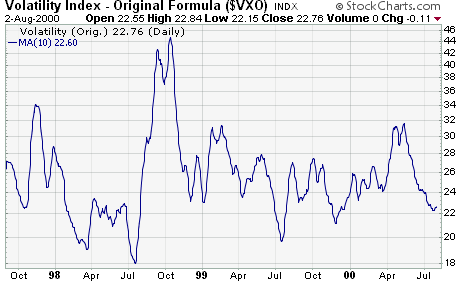
$VXO
The $VXO is the ticker created to track the "original VIX" that was calculated using the prices of S&P 100 options. The new VIX uses the ticker $VIX and is calculated using the prices of S&P 500 options. The fundamental nature of the VXO is the same as the VIX, but it is less robust and not as simple as the VIX.