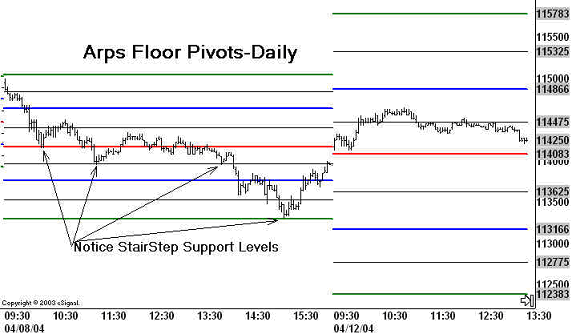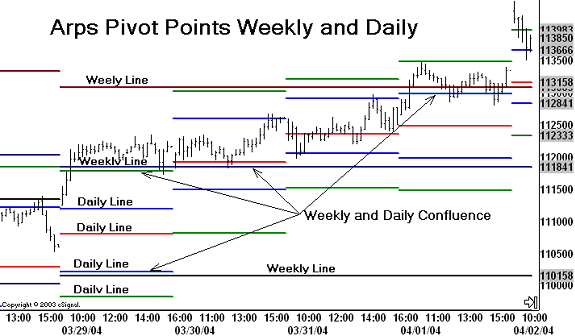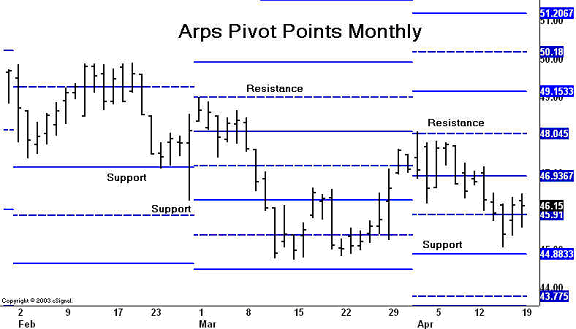
Arps Monthly/Weekly/Daily Pivot Points Support-Resistance Lines
It used to be that many traders on the floor of the exchange, most of whom would be too busy to do sophisticated calculations during the trading day, would come into the pits in the morning with a set of price levels written on a little card which represent the predicted intraday support/resistance levels for the upcoming trading day. These price levels, based on the Floor Traders’ Pivot Formulas, would be calculated based on the values of the previous day’s high, low, and close, as follows:
Avg Price = (H+L+C)/3
Resistance 2 = Avg Price + H - L;
Resistance 1 = 2*Avg Price - L;
Support 1 = 2* Avg Price - H;
Support 2 = Avg Price + L - H;
Since the “Secret” Floor Pivot formulas have become common public knowledge, they have also become self-fulfilling prophecies and other traders have begun to “gun” for them.
Our research at Jan Arps’ Traders’ Toolbox has shown that not only do the Pivot Point calculations work well for intraday price action, but they also have been found to be quite effective over larger time frames, such as daily, weekly and monthly charts, to pinpoint potential support and resistance levels. Our research has also shown that the midpoints between the classic support/resistance lines have become very significant support and resistance levels.
Accordingly, we developed the Arps Pivot Points Monthly, Arps Pivot Points Weekly, and Arps Pivot Points Daily indicators to provide the user with a set of guidelines for the expected price range over the current monthly/weekly/daily period. Increased potential for price support or resistance occurs at levels of confluence of the pivot lines for the different time frames.
These tools also provide the capability of calculating an additional pair of lines, S3 and R3, which extend the support-resistance levels beyond the standard S2,S1,Pivot,R1, and R2 lines. Because the midpoint lines are also critical support-resistance levels, a midpoint line capability is also included in these tools. Try them and see if you don’t find a lot of support and resistance at these levels.
The Arps Pivot Points Monthly, Weekly and Daily Studies include the following significant inputs:
Only Plot Current Period (Default=False) When set to “True”, will only plot the support-resistance line for the most recent period, to reduce chart clutter.
Enable R3 S3 (Default=True) When set to “True”, will display the R3 and S3 lines, in addition to the standard support-resistance lines of R1, S1, R2, S2, and Pivot
Plot Midlines? (Default=False) When set to “True”, will display the midpoint lines between the standard support-resistance lines of R1, S1, R2, S2, and Pivo


Note: The Weekly and Monthly Pivots tools can be plotted on intraday as well as longer-term charts.