INVESTOR'S BUSINESS DAILY
Many investors use P-E ratios to decide when to buy. A better strategy is to use them to decide when to sell.
The ratio measures the relationship between a stock's price and the profit it generates.
It's calculated by dividing the stock's closing price by the sum of its earnings per share over the past four quarters. This shows how much you're paying for each dollar of earnings the company has made over the last year. So a P-E ratio of 20 means you would pay $20 for each dollar of profit.
Bargain hunters use the ratio to scout for stocks that are undervalued. But in doing so they often overlook many of the market's future stars.
Consider 50 of last year's biggest winners.
On average, their P-E ratio was 51 during the week they shot out of bases en route to new highs. Perhaps that was a little pricey, but investors were paying for performance.
And these stocks delivered.
On average they gained 330% from pivot to peak. At their highest levels, they
carried an average P-E ratio of 78.
That means their P-E ratio expanded 121% on average during the course of their run. Studies of the best stocks in past years have shown almost exactly the same P-E growth.
Use this 121% figure to help decide when your stock may be nearing the end of its run. When a stock's P-E hits this point, look for other sell signals based on the daily price and volume action.
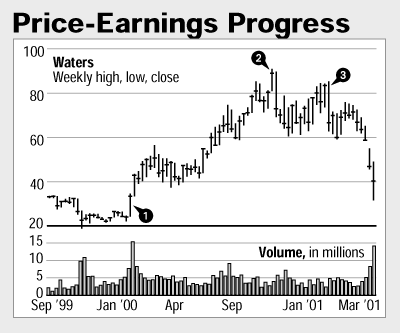
Consider Waters, which surged out of an 18-week base on six times normal volume on Jan. 25 of last year (see point 1 in accompanying image). Back then, the scientific instrument maker's P-E ratio was 34.
Increase 34 by 121%, and you have a target P-E of 75.14. So how do you come up with a target price?

First, find out what the company is expected to earn per share in the next four quarters. Back in 2000, analysts polled by First Call expected Waters to earn a total of $1.10 per share over the four-quarter period following its breakout.
Next, multiply the P-E of 75.14 by the future EPS of $1.10 per share. Since EPS is the denominator in the P-E ratio, the earnings units cancel out. You end up with a price of $82.65 per share, your target price.
Waters breached that mark on Sept. 25 (point 2) in the final days of its run. But simply hitting a price target shouldn't by itself be a reason to sell.
The stock was flashing a number of other sell signals. It hit new highs in the next several days. But in the following weeks, the stock dropped hard on heavy volume. Rebounds came on lighter trade, a bad sign. Waters also crashed through its 50-day moving average and failed to come back quickly, another sell signal.
The stock formed a new base, its fourth since the summer of 1998. Late-stage breakouts tend to fail. Waters was no exception. A feeble breakout attempt in late December 2000 (point 3) led to a nasty high-volume sell-off. Today it trades around 73% short of its high.