Get In Early On Big Trend Changes By Identifying Divergences Using The Stochastic Oscillator
Your stock market trading can be very profitable if you catch a new trend and ride it for as long as possible. This lesson focuses on identifying the start of a new trend using stochastic oscillator divergences.
Something you need to know. "Stochastic", "oscillator", "divergences" - don't let any of these words throw you. All we are doing is using a mathematical formula to indicate when a reversal in the stock market or individual stock might occur. Along the way, we will add a little common sense to put the odds of success in our favor. A man by the name of George Lane is generally credited with creating this indicator. It is simply a way of looking back in time, typically 14 periods, and comparing price to the highest and lowest price then plotting it as an indicator that varies from 0% to 100%. We are not so concerned with the nitty, gritty details on how to calculate everything - what the %K and %D is, Raw Stochastics, Fast and Slow Stochastics, Smoothing, Exponential Moving Averages, etc. There are plenty of books that explain these details. I recommend reading Technical Analysis Explained. Martin Pring does a good job showing how the formula is calculated, the book also talks about divergences. Our purpose is to actually use the tool to help make us money trading stocks.
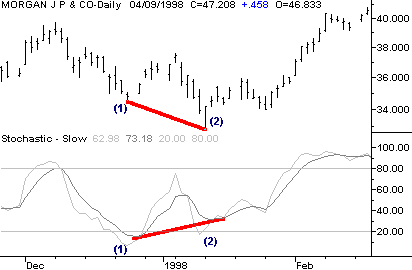
A picture tells the story. Here's a chart of J.P. Morgan making a positive divergence between price and the stochastic indicator in late 1997 / early 1998.
My use of the stochastic indicator uses the slower signal, i.e. the line that is the smoothest. The darker gray line is the slow stochastic - it's simply my preference to use the less noisy line. Here's how a positive divergence works: (1) The stock makes a low and then reverses up (point # 1 on the chart). At the same time, the stochastic indicator makes a low below the 20% level (point #1 on the indicator). (2) The stock rallies up and the stochastic indicator rises above the 20% level. (3) The stock then declines (2) below the previous low (1). The stochastic oscillator declines also (2), but does not go below the previous stochastic low (1). I am not concerned if the indicator is above or below the 20% level while price makes a lower low - as long as it does not go below the previous stochastic low. At this point, look for a reversal bar to signal a low risk entry. If no reversal bar occurs, then wait for the stock and the indicator to turn back up. Of course, you are giving up some of the profit potential by waiting for confirmation, but your chances of a successful trade are greatly increased. For an even better chance at profit, read more about spotting the best trading opportunities with a very specific reversal bar and a stochastic divergence. Trade well!!! |
