Trading Stocks Using Reversal Bars Can Help You Nail The Exact Top Or Bottom - And, With Very Low Risk
Have you ever wanted to know how to buy bottoms and sell tops in the stock market with very low risk? It can be done. If you look for a stock to "behave" in a certain way at key price levels, you can find stocks that are ready to move rapidly off of an important bottom or top. Reversal bars are exactly the behavior to look for at support and resistance levels.
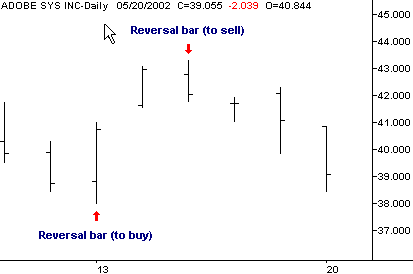
Here's what a reversal bar looks like. In it's most basic form, a reversal bar is one that closes greater than the open for a buy signal. For a sell signal, the close is less than the open. That's it. A reversal bar completes within the time frame of one bar. That one bar can be a daily bar, a weekly bar, a 15 minute intraday bar, etc. What's important here is the relationship of the open and close of the same bar. An example of reversal bars for Adobe Systems in 2002 looks like the following. The reversal bar to buy has the close greater than the open and the reversal bar to sell has the close less than the open.
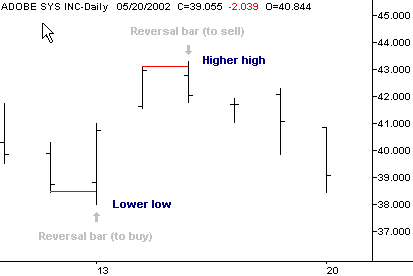
An even better reversal bar has a new high or low. In addition to the relationship between the open and close, reversal bars that have an even better chance of being the exact bottom or top have the stock making: (1) a lower low than the previous bar (for a buy) and (2) a higher high than the previous bar (for a sell or sell short). A higher high or lower low indicates that the reversal occurred during the current trading period. A reversal bar that does not make a higher high or lower low means that the reversal started during the previous trading period (mentioned previously). You are trading closer to the actual reversal point if a reversal bar occurs during the current trading period. Continuing with the example of Adobe Systems, the following chart shows the stock making reversal bars with the additional consideration of a lower low or higher low.
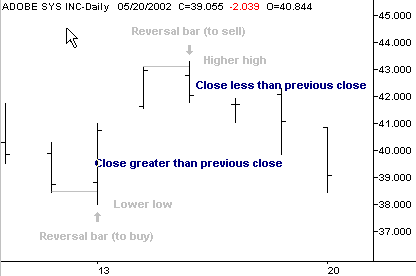
The best reversal bars show a reversal compared with the previous close. If you include the previous criteria, then if the stock also closes greater than the previous close (for a buy) or closes less than the previous close (for a sell), then the chances for follow through are even better. Think about what this is saying. For instance, a stock that reverses up for a buy says this ... Close greater than the open: At the end of the day there is more interest in owning the stock then selling the stock Lower low: If the trend prior to the reversal was down, then the trend continued - for at least part of the time frame of the reversal bar - before reversing back up. In other words, you are identifying a trend reversal very early on. Close greater than the previous close: Not only did the stock reverse back up, but it did so convincingly. Here's what it looks like.
How to trade reversal bars. Here's where most people get into trouble. They don't wait for the stock to follow through! Just because a stock forms a reversal bar that doesn't mean it will advance very far. You will save yourself countless losses if you make the stock prove itself. What that means is that the stock must trade above the reversal bar's high before you buy the stock. Or trade below the reversal bar's low for a sell short. Of course, you give up on some of the profit potential, but if the stock is truly reversing then the profits will be significant. If you do enter the stock, then place a protective stop order above of below the entry day's high or low.
Stock market success is your choice. If you plan on making significant money in the stock market, then having a plan of action for entering stocks - along with an exit plan if things don't work out - will reward you well. This method of entry is very much part of our trading systems - especially our favorite reversal trading pattern. |


