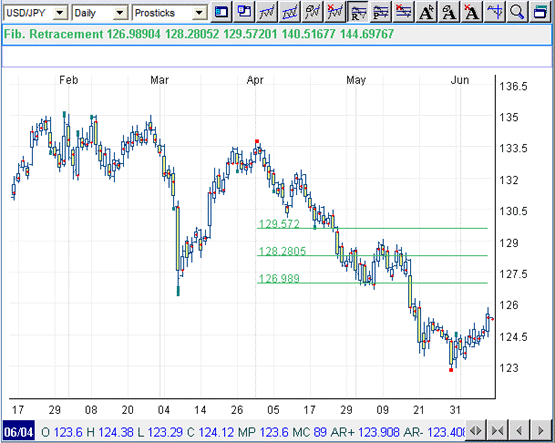
Fibonacci StudiesFibonacci Retracement - Fibonacci Retracements are displayed by selecting two extreme points on a forex chart, for example, a trough and opposing peak. A series of three horizontal lines are drawn intersecting the trend line at the Fibonacci levels of 38.2%, 50%, 61.8%. After a currency moves significantly in price (either up or down), it will often retrace a portion (if not all) of the original move. As prices retrace, support and resistance levels often occur at or near the Fibonacci Retracement levels. To use this function, select a position for the first point on the forex chart and click on the chart once and then select another position for the second point and click on the forex chart again. Fibonacci Retracement figures will be shown on the chart underlined in green and as well as on the top left portion of the chart.
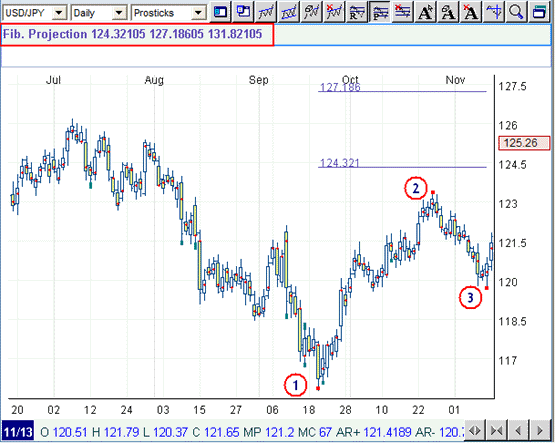
Fibonacci Projection - Fibonacci Projection calculation needs a total of 3 points. The first two points are used to calculate the distance of the first move (shown in example below), while the third point is the starting position of the projection. The purpose of Fibonacci Projections is to estimate where the current move may end. The following is an example of the result of selecting 3 points on the forex chart, clicking one after the other, with the last being the start of the projection. Fibonacci projection figures of 61.8 %, 100% and 161.8% (as a percent of the first move) will be shown on the chart underlined in blue, as well as on the top left portion of the chart. (Some of the lines may not be visible because they will be off the scale.)
|

