Support and Resistance Explained
 Support and
resistance are technical terms for supply and demand, where support is
equivalent to demand, and resistance is equivalent to supply. Support is
created when there is an imbalance between the levels of supply and demand, in
favor of demand (buying). Likewise, resistance is created when the imbalance
between supply and demand is in favor of supply (selling). First, I’d like to
discuss how support and resistance are created and destroyed, and then we’ll
talk about how support becomes resistance, and resistance becomes support.
Finally, I’d like to discuss gap resistance, and then we’ll put it all together.
Support and
resistance are technical terms for supply and demand, where support is
equivalent to demand, and resistance is equivalent to supply. Support is
created when there is an imbalance between the levels of supply and demand, in
favor of demand (buying). Likewise, resistance is created when the imbalance
between supply and demand is in favor of supply (selling). First, I’d like to
discuss how support and resistance are created and destroyed, and then we’ll
talk about how support becomes resistance, and resistance becomes support.
Finally, I’d like to discuss gap resistance, and then we’ll put it all together.
Support Created
I want you to think back to a time when you
were interested in buying a stock. Let’s say it was selling for $20 but you
figured it would go lower so you held off on your purchase until your suspicions
were confirmed. Several weeks later this stock was trading for $14 but you
weren’t quite sure it was the bargain you were looking for. Two weeks later it
was trading at $21 and you were kicking yourself for not buying when it was
selling for $14. You vowed to buy the stock if and when it ever traded as low
as $14. Sure enough, a few weeks later you found your stock selling for $14 and
you jumped in and grabbed a few shares. You saw an opportunity to capitalize on
a situation you once passed up. Support was created the first time this stock
rallied off $14 and you solidified that level of support when you purchased
shares the second time around. You and many others like you were more inclined
to buy the stock at $14 than there were sellers willing to sell the stock at
$14, and support was created.
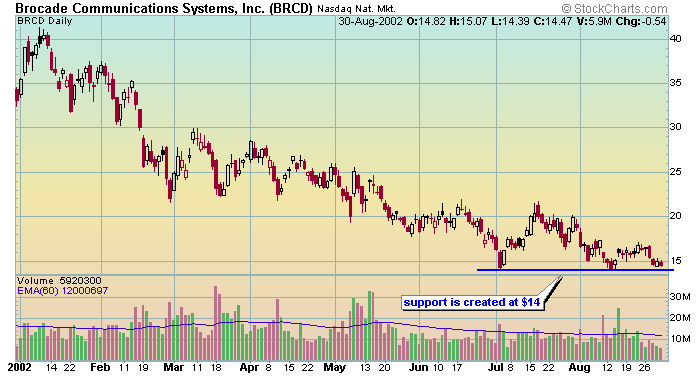
In the following example you will see that this is exactly what
happened with BRCD. It was in a nice down trend when buyers stepped in at $14
and created support. The stock subsequently rallied to a high of 21.70 – that’s
a 55% rally. So, the next time BRCD traded down to $14 buyers decided to
purchase the stock because they thought the stock would repeat this feat. This
time BRCD only managed to rally to 17.10. This in-of-itself should have set off
alarms but that’s a lesson for another time. I want you to keep this example in
mind as we move along to support being destroyed.
Support Destroyed
Let’s
go back to the example in which you purchased shares for $14 on the second
occasion it traded at that level. This time, instead of going up to $21 it only
went up to $17 before falling back to $14 for the third time. Unfortunately, on
the third time not enough buyers stepped in to outnumber sellers, and the stock
began trading below $14. This is the precise moment that a “breakdown” – a
change in the balance between supply and demand – occurred. This is illustrated
in the next chart.
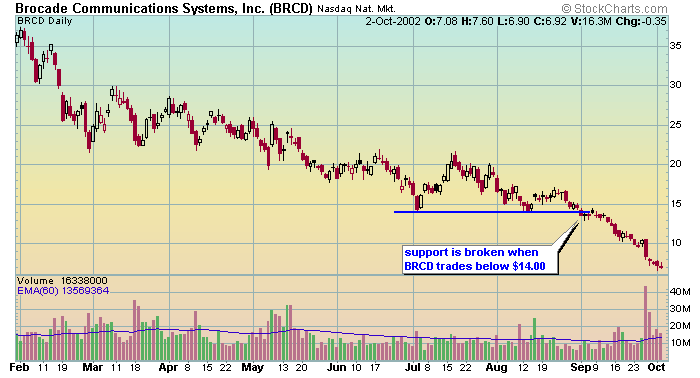
This time around you are the unhappy owner of a stock that is now
trading for less than $14. The moment your stock traded below $14 it is said to
have violated support and the price can be expected to decline until reaching
another level of support or, if none exists, until buyers step in and create a
new support level. As you can see BRCD entered a near free fall before it
bounced off the $6 area. Actually, BRCD traded as low as $5 before it recovered
and began trading higher.
Take a moment to look at the volume on the chart above when BRCD
broke support. It’s nothing spectacular is it? Stocks can fall on their own
weight simply from the lack of buying. This isn’t the case when stocks trade
above resistance as we’ll see in just a moment.
Resistance Created
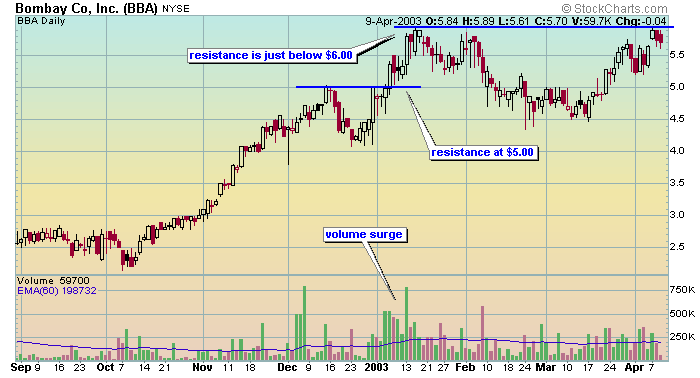
Now let’s move on to resistance. In the example above you are
going to become the proud owner of a $2 stock that eventually trades up to $5,
and then $6 before it meets resistance. Let’s go through the scenario. You see
that BBA is trading around $2, which you feel is an absolute bargain so you jump
in and buy the shares. A few months later you find your $2 stock selling for
$5, which would represent more than a 100% return. You’re not about to give
back a 100% return so you begin to sell. If you look at the chart you’ll notice
you weren’t the only one selling at that point. $5 was a solid point of
resistance until the beginning of 2003 when a huge surge of buyers stepped in
and pushed the shares above the $5 dollar range. The stock traded up to almost
$6 where another level of resistance was established. In fact, as we shall soon
see, it took another three months before BBA could muster the energy to trade
above $6. Each time the stock traded that high it was met with selling that
prevented it from going any further. You, and many others like you, were more
inclined to sell the stock at $6 than there were buyers willing to buy the stock
at $6, and resistance was created.
Resistance Destroyed
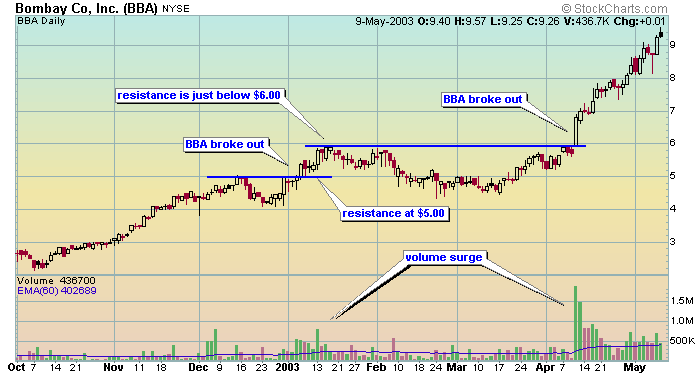
Finally, in the second week of April of 2003 buyers stepped up to
the plate in a forceful way to push the stock well above the $6 area. In fact,
BBA traded above $7 the very next day. Now, I want you to look at the chart
above and take a close look at the volume pattern as BBA traded above $5, and
then above $6. Do you notice anything? Of course you do, the volume was strong
as the price rose above $5 and absolutely huge when it exceeded $6. Is it safe
to say that there was a shift in the level of supply and demand as the stock
exceeded these levels? There is no question about it. This stock is being
bought in violent fashion. This is exactly what you want to see when a stock
trades above resistance. This is what’s called a “break out.”
When Previous Support Becomes Resistance
Now, I want you to think back to a time when you bought some
stock only to find it trading for much less in the coming weeks or months. Try
to think back and recall what you were thinking after a few weeks or months went
by. Let’s say you paid $10 for the stock and 6-months later it had rallied from
$4 all the way back to $10. What would you do? Would you sell it to “get out
even?” This is how previous support becomes future resistance. Let’s look at
the next example.
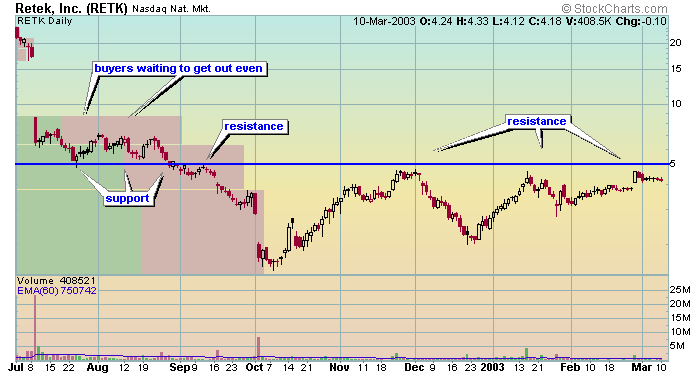
In July RETK fell from $20 to about $8 in one day
– that’s some fall. For every seller there must be a buyer so we know someone
was buying the shares when it was trading at $8. The shares continued to be
bought as it traded in a range from $4.85 to $7.15. In late August RETK broke
support – it traded below $4.85. For simplicity sake we’ll refer to resistance
as $5 from here on out. Shortly thereafter, RETK tried to trade above $5 but it
was rejected. Why? The answer is simple. There were many buyers in the $5 to
$7.15 area that began selling in an effort to “get out even.” It wasn’t until
December that the stock attempted to trade above $5 again. Unfortunately, the
result was the same. This happened again in the middle of January and again at
the end of February with the same result. Keep in mind, there are
investors/traders that purchased the stock under $5 who are selling for profits
along the way. This also contributes to resistance.
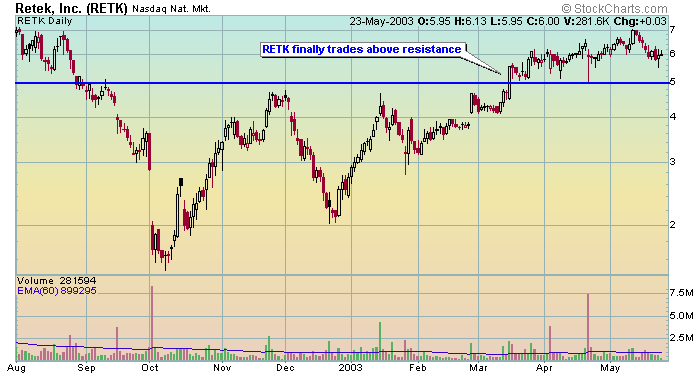
On the chart above we can see that seven months
have gone by and it is now mid-March of the following year. This is a
significant point because as more time went by the “get out even sellers” have
sold their stock at any price, and given up on the possibility of it ever
“coming back.” You can see that RETK finally traded above resistance, which
became support shortly thereafter. This brings us to the next lesson.
When Previous Resistance Becomes Support
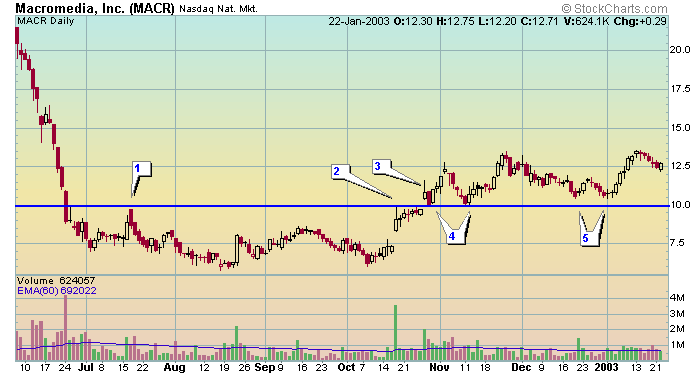
Take a brief look at the chart of MACR. The stock was just
getting crushed in the month of June. Buyers finally stepped in at the low of
6.98 and started pushing the stock up. It topped out at 9.75 (pt 1), which
started a level of resistance. Later that year (pt. 2) MACR tried in vain to
get over the $10 hurdle that was set back in July. In fact, it took 8
consecutive tries before the stock managed to overcome the $10 hurdle. At pt. 3
MACR traded over the hurdle in rapid fashion. Buyers were pretty excited at
this point. Now, I want you to pay special attention to pt. 4. This is a great
example of previous resistance becoming support. A large number of people were
probably watching this stock, looking for the right opportunity to buy it. To
their dismay, it traded above $10 faster than they thought it would so they
vowed to buy if it ever traded that low again. Previous resistance had become
support.
Let’s move on to pt. 5. This time the stock never really traded
as low as $10 because everyone was watching and waiting for it to trade back
that low so they could buy the shares. When this happens demand becomes
overwhelming and the stock never quite makes it back as low as $10. It came
pretty close but too many people were watching it at the same time. This is one
of the reasons that stocks trade in trends but this is a lesson for another
time.
Gaps
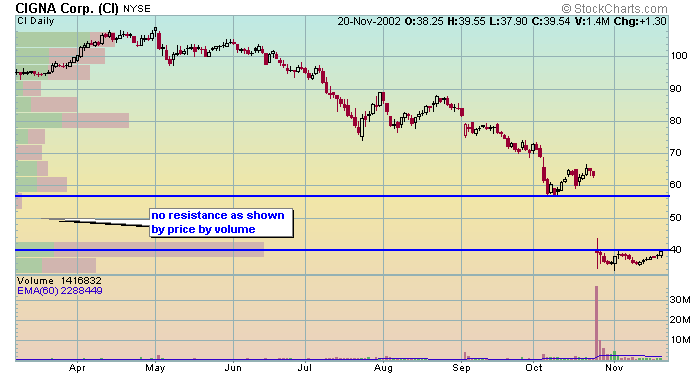
In order to understand gaps we first need to understand how to
interpret Price by Volume. Take a moment and look at the chart of Cigna Corp.
You will notice the red and green horizontal bars on the left hand side of the
chart. That is Price by Volume. It gives you a graphical representation of how
many buyers and sellers there were at a certain price, over a specific period of
time. For this example we will just focus on the volume of buying (the green
portion of each bar).
Now, I want you to imagine that you bought CI in the area from
$57 to $67 during the month of October. Not long after, the stock gapped down
to approximately $40, and traded as low as $34.15. Take a moment and try to
imagine how you would feel if you found yourself in this situation. You would
be dying to sell your stock for anything close to what you paid for it, wouldn’t
you? I sure would and so were the people that actually did buy it that high.
I want to draw you attention to the Price by Volume indicator in
the middle of the gap. How many buyers do you see in the gap? You would be
exactly right if you said none. It isn’t possible to buy a stock if it never
trades there. So how much resistance do you think sits inside the gap? If you
said none you’re pretty close. Some people will sell the stock for less than
they paid for it, and cut their losses and move on. Others will wait and hope
CI comes back so they can sell and “get out even.” Let’s move on to the next
chart.
On this chart I have removed the Price by Volume indicator to
eliminate confusion. The level of buying in the gap would be increasing but it
would represent the current buyers, not the previous ones.
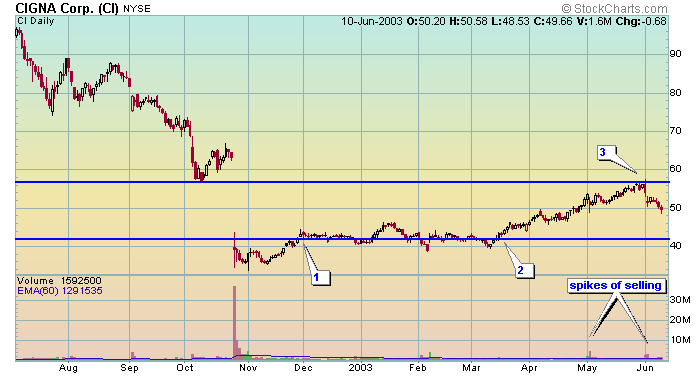
Now look at pt. 1. CI was starting to move slowly inside the gap
where few potential sellers existed. Buyers were probably somewhat hesitant to
buy CI at that point so it traded sideways for a while. Now look at pt. 2.
This is the point where CI really started to challenge the gap. In fact, it
moved the entire way up to the point where the original gap down began – right
where sellers were getting ready to sell and “get out even.” What happened
right after it hit the top of the gap? It sold off in rapid fashion because
there was an abundance of sellers waiting to “get out even.” Look at the red
volume spikes that occurred in the beginning of May and June. Now look at the
price at that time. In May the price was pretty darn close to the top of the
gap. In June it was sitting directly on the top of the gap. This is the reason
gaps get filled. Trading gaps is not an exact science but it come pretty darn
close.
Putting it all together
Suffice it to say, there are many ways support and resistance are
created and destroyed. We have just examined these subjects in the most
elementary way. We only looked at investors who buy stock (go long). There are
short sellers, day traders, and institutional program trading that also
influence support and resistance. It is more important that you learn how to
recognize support and resistance, than it is to know how or why it is created.
Support exists when buyers are more willing to buy at a certain
price, or within a narrow price range, than there are sellers who are willing to
sell at that price. Interested buyers support the price. Support is destroyed
as supply increases relative to demand.
Resistance exists when sellers are more willing to sell at a
certain price, or within a narrow price range, than there are buyers who are
willing to buy at that price. Willing sellers create resistance. Resistance is
destroyed as demand increases relative to supply.
When a stock gaps down it is because there is an absence of
buyers in the area of the gap. This helps eliminate some of the supply that
would otherwise exist within that area. Later, as a stock’s price advances into
a gap area from below, would-be buyers find few shares available for sale until
they have bid the price up to, or near to, the price where the gap began.
When a stock gaps down there is an absence of buyers in the area
of the gap. This eliminates some of the supply that would otherwise occur in
that area. There is an inherent shift in the level of supply and demand in
gaps, in favor of demand (buying).
To be successful in the markets you only need to know if more
shares are being bought or if more shares are being sold - support and
resistance tells you this.
Trading 101
Lesson 5:
Chart
Patterns