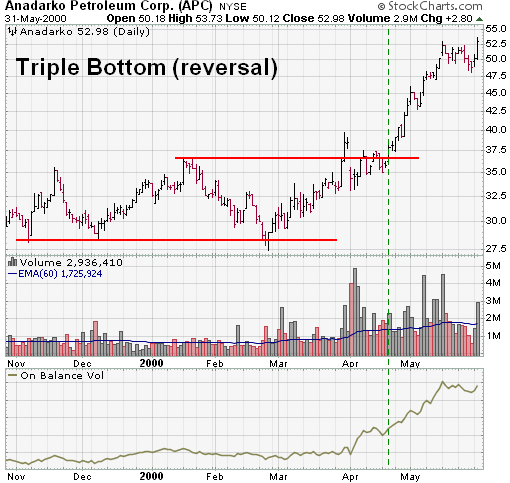
The triple bottom is a reversal pattern made up of three equal lows followed
by a breakout above resistance. While this pattern can form over just a few
months, it is usually a long-term pattern that covers many months. Because of
its long-term nature, weekly charts can be best suited for analysis. We will
first examine the individual parts of the pattern and then look at an example.
- Prior Trend: With any reversal pattern, there should be an existing
trend to reverse. In the case of the triple bottom, a downtrend or long
trading range should be in place. Sometimes there will be a definitive
downtrend to reverse. Other times the downtrend will fade away after many
months of sideways trading.
- Three lows: All three lows should be reasonable equal, well spaced
and mark significant turning points. The lows do not have to be exactly equal,
but should be reasonably equivalent.
- Volume: As the triple bottom develops, overall volume levels
usually decline. Volume sometimes increases near the lows. After the third
low, an expansion of volume on the advance and at the resistance breakout
greatly reinforces the soundness of the pattern.
- Resistance break: As with many other reversal patterns, the triple
bottom is not complete until a resistance breakout. The highest point of the
formation, which would be the highest of the intermittent highs, marks
resistance.
- Resistance turns support: Broken resistance becomes potential
support, and there is sometimes a test of this newfound support level with the
first correction. Because the triple bottom is a long-term pattern, the test
of newfound support may occur many months later.
- Price Target: The distance from the resistance breakout to lows can
be measured and added to the resistance break for a price target. The longer
the pattern develops, the more significant is the ultimate breakout. Triple
bottoms that are 6 or more months in duration represent major bottoms and a
price target is less likely to be effective.
As the triple bottom develops, it can start to resemble a number of patterns.
Before the third low forms, the pattern may look like a double bottom. Three
equal lows can also be found in a descending triangle or rectangle. Of these
patterns mentioned, only the descending triangle has bearish overtones; the
others are neutral until a breakout occurs. Similarly, the triple bottom should
also be treated as a neutral pattern until a breakout occurs. The ability to
hold support is bullish, but demand has not won the battle until resistance is
broken. Volume on the last advance can sometimes yield a clue. If there is a
sharp increase in volume and momentum, then the chances of a breakout increase.
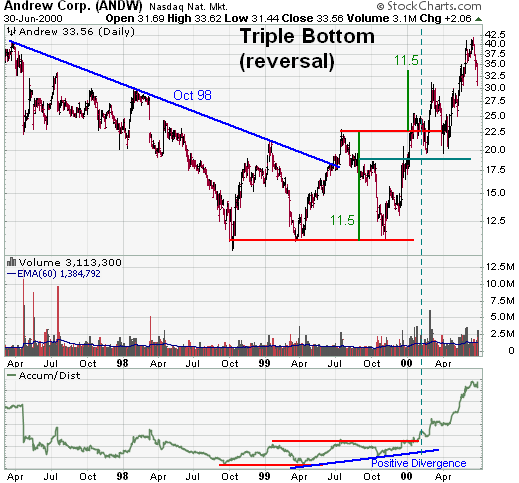
After a failed double bottom breakout, ANDW formed a large triple bottom.
While the new reaction high (black arrow) and potential double bottom breakout
seemed bullish, the stock subsequently fell back to support.
- Technically, the downtrend ended when the stock formed a higher low in
Mar-99 and surpassed its Jan-99 high by closing above 20 in Jul-99 (black
arrow). Even though the downtrend ended, it would have been difficult to label
the trend bullish after the third test of support around 11.
- Over a 13-month timeframe, three relatively equal lows formed in Oct-98,
Mar-99 and Nov-99. When the Jul-00 high surpassed the Jan-99 high, the
possibility of a rectangle pattern was ruled out.
- Resistance at 22 1/2 was broken in Jan-00. The stock closed above this key
level for 5 consecutive weeks to confirm the breakout.
- Even though volume expanded near the second and third lows, the 10-day EMA
of volume declined between the lows. The advance off the third low saw a
dramatic expansion of volume that lasted many weeks. The
Accumulation/Distribution Line formed a positive divergence in 1999 and broke
to new highs with the stock in Jan-00.
- After the resistance break, the stock fell below 22 1/2 twice over the
next 2 months. Based on the Feb-00 and Apr-00 lows, a new support level was
established at 20 and. Because upside movement was limited after the breakout
(a high of 25 1/2), a pullback below 22 1/2 might have been expected. Based on
Oct-99 resistance, critical support could have been marked at 18 1/2.
- ANDW built a base over a 13-month period. Even though the height of the
pattern is relatively impressive, it pales in comparison to the length of the
base. The length of this pattern and subsequent breakout suggest a long-term
change of sentiment.