|
Symmetrical Triangle (Continuation) |
The symmetrical triangle, which can also be referred to as a coil, usually
forms during a trend as a continuation pattern. The pattern contains at least
two lower highs and two higher lows. When these points are connected, the lines
converge as they are extended and the symmetrical triangle takes shape. You
could also think of it as a contracting wedge, wide at the beginning and
narrowing over time.
While there are instances when symmetrical triangles mark important trend
reversals, they more often mark a continuation of the current trend. Regardless
of the nature of the pattern, continuation or reversal, the direction of the
next major move can only be determined after a valid breakout. We will examine
each part of the symmetrical triangle individually and then provide an example
with Consesco.
- Trend: In order to qualify as a continuation pattern, an
established trend should exist. The trend should be at least a few months old
and the symmetrical triangle marks a consolidation period before continuing
after the breakout.
- 4 points: At least 2 points are required to form a trendline and
two trendlines are required to form a symmetrical triangle. Therefore, a
minimum of 4 points are required to begin considering a formation as a
symmetrical triangle. The second high (4) should be lower than the first (2)
and the upper line should slope down. The second low (3) should be higher than
the first (1) and the lower line should slope up. Ideally, the pattern will
form with 6 points (3 on each side) before a breakout occurs.
- Volume: As the symmetrical triangle extends and the trading range
contracts, volume should start to diminish. This refers to the quiet before
the storm, or the tightening consolidation before the breakout.
- Duration: The symmetrical triangle can extend for a few weeks or
many months. If the pattern is less than 3 weeks, it is usually considered a
pennant. Typically, the time duration is about 3 months.
- Breakout Timeframe: The ideal breakout point occurs 1/2 to 3/4 of
the way through the pattern's development or time-span. The time-span of the
pattern can be measured from the apex (convergence of upper and lower lines)
back to the beginning of the lower trendline (base). A break before the 1/2
way point might be premature and a break too close to the apex may be
insignificant. After all, as the apex approaches, a breakout must occur
sometime.
- Breakout Direction: The future direction of the breakout can only
be determined after the break has occurred. Sound obvious enough, but
attempting to guess the direction of the breakout can be dangerous. Even
though a continuation pattern is supposed to breakout in the direction of the
long-term trend, this is not always the case.
- Breakout Confirmation: For a break to be considered valid, it
should be on a closing basis. Some traders apply a price (3% break) or time
(sustained for 3 days) filter to confirm validity. The breakout should occur
with an expansion in volume, especially on upside breakouts.
- Return to Apex: After the breakout (up or down), the apex can turn
into future support or resistance. The price sometimes returns to the apex or
a support/resistance level around the breakout before resuming in the
direction of the breakout.
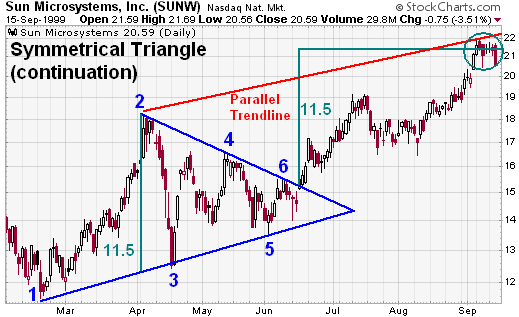
- Price Target: There are two methods to estimate the extent of the
move after the breakout. First, the widest distance of the symmetrical
triangle can be measured and applied to the breakout point. Second, a
trendline can be drawn parallel to the pattern's trendline that slopes (up or
down) in the direction of the break. The extension of this line will mark a
potential breakout target.
Edwards and Magee suggest that roughly 75% of symmetrical triangles are
continuation patterns and the rest mark reversals. The reversal patterns can be
especially difficult to analyze and often have false breakouts. Even so, we
should not anticipate the direction of the breakout, but rather wait for it to
happen. Further analysis should be applied to the breakout by looking for gaps,
accelerated price movements and volume for confirmation. Confirmation is
especially important for upside breakouts.
Prices sometimes return to the breakout point of apex on a reaction move
before resuming in the direction of the breakout. This return can offer a second
chance to participate with a better reward to risk ratio. Potential reward price
targets found by measurement and parallel trendline extension are only meant to
act as rough guidelines. Technical analysis is dynamic and ongoing assessment is
required. In the first example above, SUNW may have fulfilled its target (42) in
a few months, but the stock gave no sign of slowing down and advanced above 100
in the following months.
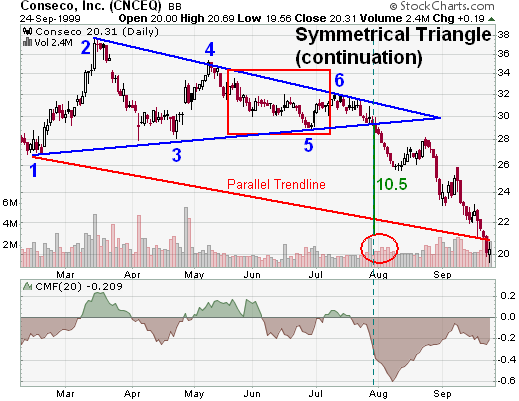
Conseco formed a rather large symmetrical triangle over a 5-month period
before breaking out on the downside.
- The stock declined from 50 in Mar-98 to 22 in Oct-98 before beginning to
firm and consolidate. The low at 22 probably was an over-reaction, but the
long-term trend was down and established for almost a year.
- After the first 4 points formed, the lines of the symmetrical triangle
were draw. The stock traded within the boundaries for another 2 months to form
the last 2 points.
- After the gap up from point 3 to point 4, volume slowed over the next few
months. There was some increase in volume in late June, but the 60-day SMA
remained in a downtrend as the pattern took shape.
- The red square marks the ideal breakout time-span from 50% to 75% of the
pattern. The breakout occurred a little over 2 weeks later, but proved valid
nonetheless. While it is preferable to have an ideal pattern develop, it is
also quite rare.
- After points 5 and 6 formed, the price action moved to the lower boundary
of the pattern. Even at this point, the direction of the breakout was still a
guess and its was prudent to wait. The break occurred with an increase in
volume and accelerated price decline. Chaikin Money Flow declined past -30%
and volume exceeded the 60-day SMA for an extended period.
- After the decline from 29 1/2 to 25 1/2, the stock rebounded, but failed
to reach potential resistance from the apex. The weakness of the reaction
rally foreshadowed the sharpness of the decline that followed.
- The widest point on the pattern extended 10 1/2 points. With a break of
support at 29 1/2, the measured decline was estimated to around 19. By drawing
a trendline parallel to the upper boundary of the pattern, the extension
estimates a decline to around 20.