|
Rectangle (Continuation Pattern) |
A rectangle is a continuation pattern that forms as a trading range during a
pause in the trend. The pattern is easily identifiable by two comparable highs
and two comparable lows. The highs and lows can be connected to form two
parallel lines that make up the top and bottom of a rectangle. Rectangles are
sometimes referred to as trading ranges, consolidation zones or congestion
areas.
There are many similarities between the rectangle and the symmetrical
triangle. While both are usually continuation patterns, they can also mark trend
significant tops and bottoms. As with the symmetrical triangle, the rectangle
pattern is not complete until a breakout has occurred. Sometimes clues can be
found, but the direction of the breakout is usually not determinable beforehand.
We will examine each part of the rectangle and then provide an example with MU.
- Trend: To qualify as a continuation pattern, a prior trend should
exist. Ideally, the trend should be a few months old and not too mature. The
more mature the trend, the less chance that the pattern marks a continuation.
- 4 points: At least two equivalent reaction highs are required to
form the upper resistance line and two equivalent reaction lows to form the
lower support line. They do not have to be exactly equal, but should be within
a reasonable proximity. Although not a prerequisite, it is preferable that the
highs and lows alternate.
- Volume: As opposed to the symmetrical triangle, rectangles do not
exhibit standard volume patterns. Sometimes volume will decline as the pattern
develops. Other times volume will gyrate as the prices bounce between support
and resistance. Rarely will volume increase as the pattern matures. If volume
declines, it is best to look for an expansion on the breakout for
confirmation. If volume gyrates, it is best to assess which movements
(advances to resistance or declines to support) are receiving the most volume.
This type of volume assessment could offer an indication on the direction of
the future breakout.
- Duration: Rectangles can extend for a few weeks or many months. If
the pattern is less than 3 weeks, it is usually considered a flag, also a
continuation pattern. Ideally, rectangles will develop over a 3-month period.
Generally, the longer the pattern, the more significant the breakout. A
3-month pattern might be expected to fulfill its breakout projection. However,
a 6-month pattern might be expected to exceed its breakout target.
- Breakout Direction: The direction of the next significant move can
only be determined after the breakout has occurred. As with the symmetrical
triangle, rectangles are neutral patterns that are dependent on the direction
of the future breakout. Volume patterns can sometimes offer clues, but there
is no confirmation until an actual break above resistance or break below
support.
- Breakout Confirmation: For a breakout to be considered valid, it
should be on a closing basis. Some traders apply a filter to price (3%), time
(3 days) or volume (expansion) for confirmation.
- Return to Breakout: A basic tenet of technical analysis is that
broken support turns into potential resistance and visa versa. After a break
above resistance (below support), there is sometimes a return to test this
newfound support level (resistance level). (For more detail, see this article
on support and resistance.) A return to or near the original breakout level
can offer a second chance to participate.
- Target: The estimated move is found by measuring the height of the
rectangle and applying it to the breakout.
Rectangles represent a trading range that pits the bulls against the bears.
As the price nears support, buyers step in and push the price higher. As the
price nears resistance, bears take over and force the price lower. Nimble
traders sometimes play these bounces by buying near support and selling near
resistance. One group (bulls or bears) will exhaust itself and a winner will
emerge when there is a breakout. Again, it is important to remember that
rectangles have a neutral bias. Even though clues can sometimes be gleaned from
volume patterns, the actual price action depicts a market in conflict. Only
until the price breaks above resistance or below support will it be clear which
group has won the battle.
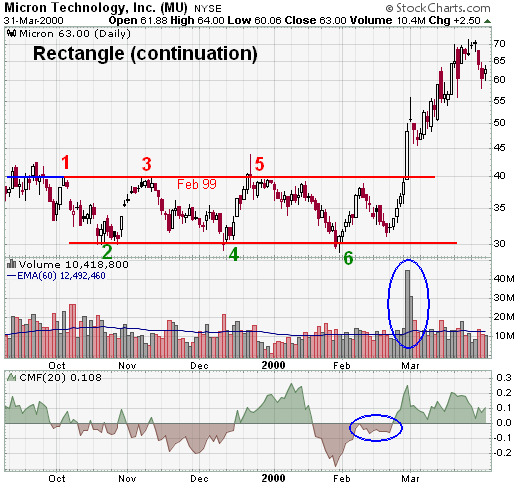
In the summer of 1999, Micron Electronics (MU) advanced from the high teens
to the low forties. After meeting resistance around 42, the stock settled in a
trading range between 40 and 30 to form a rectangle.
- The prior intermediate trend was established as bullish by the advance
from the high teens to the low forties. However, it was unclear at the time if
this trading range would be a reversal or a continuation pattern. The
horizontal resistance line at 40 can be extended back to the Feb-99 high and
marked a serious resistance level.
- The red resistance line at 40 was formed with three reaction highs. The
first reaction high may be a bit suspect, but the second two are robust. The
parallel support line at 30 was touched three times and established a solid
support level. After the high at point 5 was reached, the rectangle was valid.
- As the pattern developed, volume fluctuated and there was no clear
indication (bullish or bearish break) until mid-February. The first bullish
clue came when the stock declined from 38 to 31 and Chaikin Money Flow failed
to move below -10%. Money flows held steady throughout the decline and turned
positive as soon as the stock turned back up. By the time the stock reached 39
3/4 (surpassing its previous reaction high in the process), CMF was at +20%.
Also notice the strength behind the advance after a higher low.
- The duration of the pattern was 5 months. Due to long-term overhead
resistance at 40, the pattern needed more time to consolidate before a
breakout. The longer consolidation made for bigger expectations after the
breakout.
- The breakout occurred with a large expansion in volume and a huge moved
above resistance.
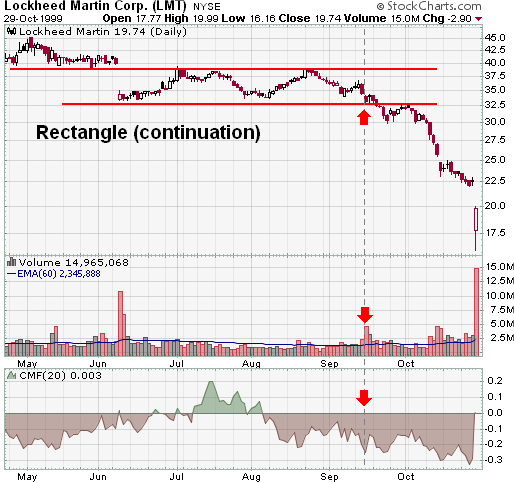
- After the breakout, there was a slight pullback to around 46, but the
volume behind the advance indicated a huge breakout. Stocks do not always
return to the point of breakout. In the example above, LMT makes a classic
return to the breakout. The set up and strength behind the breakout should be
assessed to determine the possibility of a second chance opportunity.
- The target advance of this breakout was 10 points, which was the width of
the pattern. However, judging from the duration and strength of the breakout,
expansion of volume and new all-time highs, it was apparent that this was no
ordinary breakout. Therefore an ordinary target was useless! After an initial
advance as high as 55 13/16, the stock pulled back to 46 and then moved above
70. Another trading range subsequently developed with resistance in the low
70s and support in the upper 40s.