A price channel is a continuation pattern that slopes up or down and is bound
by an upper and lower trendline. The upper trendline marks resistance and the
lower trendline marks support. Price channels with negative slopes (down) are
considered bearish and those with positive slopes (up) bullish. For explanatory
purposes, a "bullish price channel" will refer to a channel with positive slope
and a "bearish price channel" to a channel with negative slope.
- Main trendline: It takes at least two points to draw the main
trendline. This line sets the tone for the trend and the slope. For a bullish
price channel, the main trendline extends up and at least two reaction lows
are required to draw it. For a bearish price channel, the main trendline
extends down and at least two reaction highs are required to draw it.
- Channel line: The line drawn parallel to the main trendline is
called the channel line. Ideally, the channel line will be based off of two
reaction highs or lows. However, after the main trendline has been
established, some analysts draw the parallel channel line using only one
reaction high or low. The channel line marks support in a bearish price
channel and resistance in a bullish price channel.
- Bullish price channel: As long as prices advance and trade within
the channel, the trend is considered bullish. The first warning of a trend
change occurs when prices fall short of channel line resistance. A subsequent
break below main trendline support would provide further indication of a trend
change. A break above channel line resistance would be bullish and indicate an
acceleration of the advance.
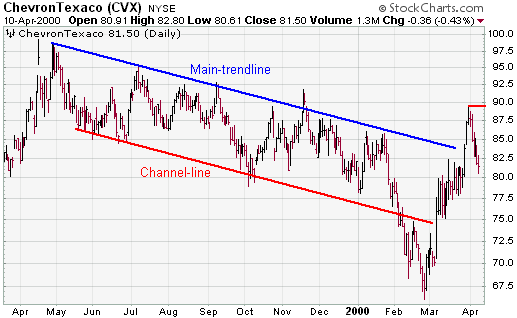
- Bearish price channel: As long as prices decline and trade within
the channel, the trend is considered bearish. The first warning of a trend
change occurs when prices fail to reach channel line support. A subsequent
break above main trendline resistance would provide further indication of a
trend change. A break below channel line support would be bearish and indicate
an acceleration of the decline.
- Scaling: Even though it is a matter of personal preference,
trendlines seem to match reaction highs and lows best when semi-log scales are
used. Semi-log scales reflect price movements in percentage terms. A move from
50 to 100 will appear the same distance as a move from 100 to 200.
In a bullish price channel, some traders look to buy when prices reach main
trendline support. Conversely, some traders look to sell (or short) when prices
reach main trendline resistance in a bearish price channel. As with most price
patterns, other aspects of technical analysis should be used to confirm signals.
Because technical analysis is just as much art as it is science, there is
room for flexibility. Even though exact trendline touches are ideal, it is up to
each individual to judge the relevance and placement of both the main trendline
and the channel line. By that same token, a channel line that is exactly
parallel to the main trendline is ideal.
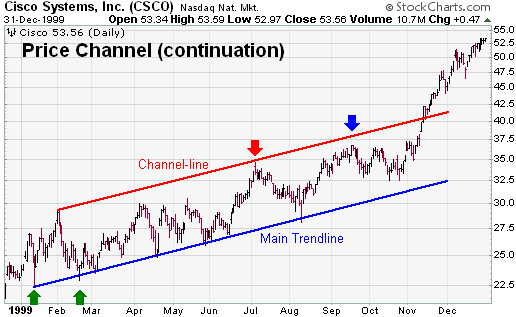
CSCO provides an example of an 11-month bullish price channel that developed
in 1999.
- Main trendline: The January, February and March reaction lows
formed the beginning of the main trendline. Subsequent lows in April, May and
August confirmed the main trendline.
- Channel line: Once the main trendline was in place, the channel
line beginning from the January high was drawn. A visual assessment reveals
that these trendlines look parallel. More precise analysts may want to test
the slope of each line, but a visual inspection is usually enough to ensure
the "essence" of the pattern.
- Bullish price channel: Subsequent touches along the main trendline
offered good buying opportunities in mid April, late May and mid August.
- The stock did not reach channel line resistance until July (red arrow) and
this marked a significant reaction high.
- The September high (blue arrow) fell short of channel line resistance, but
only by a small margin that was probably insignificant.
- The break above channel line resistance in Dec-99 marked an acceleration
of the advance. Some analysts might consider the stock overextended after this
move, but the advance was powerful and the trend never turned bearish. Price
channels will not last forever, but the underlying trend remains in place
until proven otherwise.