|
Bump
and Run Reversal (Reversal) |
As the name implies, the Bump and Run Reversal (BARR) is a reversal pattern
that forms after excessive speculation drives prices up too far, too fast.
Developed by Thomas Bulkowski, the pattern was introduced in the June-97 issue
of Technical Analysis of Stocks and
Commodities and also included in his recently published book, the
Encyclopedia of Chart Patterns.
The pattern was originally named the Bump and Run Formation, or BARF.
Bulkowski decided that Wall Street was not ready for such an acronym and changed
the name to Bump and Run Reversal. Bulkowski identified three main phases to the
pattern: lead-in, bump and run. We will examine these phases and also look at
volume and pattern validation.
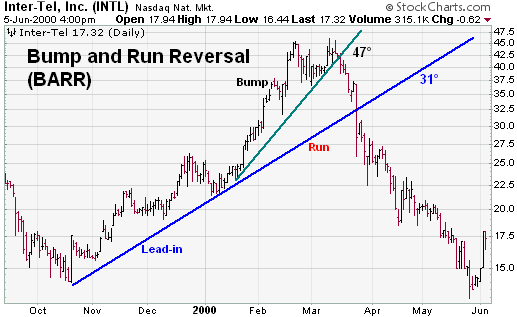
- Lead-in Phase: The first part of the pattern is a lead-in phase
that can last 1 month or longer and forms the basis from which to draw the
trendline. During this phase, prices advance in an orderly manner and there is
no excess speculation. The trendline should be moderately steep. If it is too
steep then the ensuing bump is unlikely to be significant enough. If the
trendline is not steep enough, then the subsequent trendline break will occur
too late. Bulkowski advises that an angle of 30 to 45 degrees is preferable.
The size of the angle will depend on the scaling (semi-log or arithmetic) and
the size of the chart. It is probably easier to judge the soundness of the
trendline with a visual assessment.
- Bump Phase: The bump forms with a sharp advance, and prices move
further away from the lead-in trendline. Ideally, the angle of the trendline
from the bump's advance should be about 50% greater than the angle of the
trendline extending up from the lead-in phase. Roughly speaking, this would
call for an angle between 45 and 60 degrees. If it is not possible to measure
the angles, then a visual assessment will suffice.
- Bump Validity: It is important that the bump represent a
speculative advance that cannot be sustained for a long time. Bulkowski
developed what he calls an "arbitrary" measuring technique to validate the
level of speculation in the bump. The distance from the highest high of the
bump to the lead-in trendline should be at least twice the distance from the
highest high in the lead-in phase to the lead-in trendline. These distances
can be measured by drawing a vertical line from the highest highs to the
lead-in trendline. An example is provided below.
- Bump rollover: After speculation dies down, prices begin to peak
and a top forms. Sometimes a small double top or a series of descending peaks
forms. Prices begin to decline towards the lead-in trendline and the right
side of the bump forms.
- Volume: As the stock advances during the lead-in phase, volume is
usually average and sometimes low. When the speculative advance begins to form
the left side of the bump, volume expands as the advance accelerates.
- Run Phase: The run phase begins when the pattern breaks support
from the lead-in trendline. Prices will sometimes hesitate or bounce off the
trendline before breaking through. Once the break occurs, the run phase takes
over and the decline continues.
- Support turns resistance: After the trendline is broken, there is
sometimes a retracement that tests the newfound resistance level. Potential
support-turned-resistance levels can also be identified from the reaction lows
within the bump.
The Bump and Run Reversal pattern can be applied to daily, weekly or monthly
charts. As stated above, the pattern is designed to identify speculative
advances that are unsustainable for a long period. Because prices rise very fast
to form the left side of the bump, the subsequent decline can be just as
ferocious.
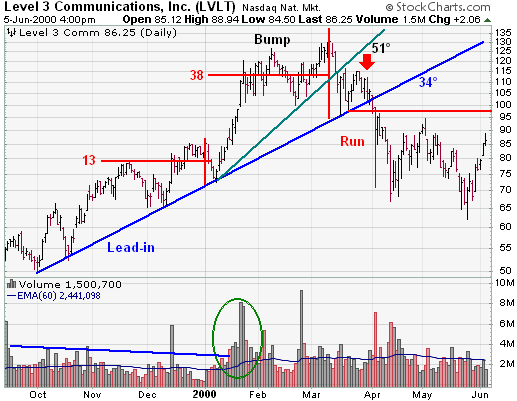
Level Three Communications (
LVLT) formed a Bump and Run Reversal pattern after prices advanced in a
speculative frenzy at the beginning of 2000. Prices advanced from 72 to 132 in 2
months and this advance ultimately proved unsustainable.
- The lead-in phase formed over a 3 month period from early Oct-99 to early
Jan-00. Volume during this phase was relatively subdued and actually declined
during the November and December advance.
- The trendline extending up from the lead-in phase lows formed a 34 degree
angle. A visual assessment also reveals that this trendline is neither too
steep nor too flat.
- The bump phase began in early January when the advance accelerated with a
large increase in volume. A conservatively drawn trendline formed a 51 degree
angle that was exactly 50% larger than the angle from the lead-in trendline.
- The distance from the lead-in phase's highest high to the trendline was
13. The distance from the Bump Phase's highest high to the trendline was 38.
This is almost three times larger and validates the speculative excesses in
the bump.
- After reaching a high around 132, prices declined sharply and bounced off
the lead-in trendline. A lower high formed around 115 (red arrow) and the
trendline was soon broken.
- The decline continued after the trendline break and reached 67 before a
reaction rally began. The reaction rally advanced to around 95, but fell just
short of the horizontal support line before falling back to new lows.