|
Measured (Bear) Move (Continuation) |
The Measured Move is a three-part formation that begins as a reversal pattern
and resumes as a continuation pattern. The Measured (Bear) Move consists of a
reversal decline, consolidation/retracement and continuation decline. Because
the Measured (Bear) Move cannot be confirmed until after the consolidation/retracement
period, I have elected to categorize it as a continuation pattern. The pattern
is usually long-term and forms over several months.
- Prior Trend: For the first decline to qualify as a reversal, there
must be evidence of a prior uptrend to reverse. Because the Measured (Bear)
Move can occur as part of a larger advance, the length and severity of the
prior decline may vary from a few weeks to many months.
- Reversal Decline: The first decline usually begins near the
established highs of the previous advance and extends for a few weeks or many
months. Sometimes this reversal pattern can mark the initial trend change,
other times a new downtrend is established by new reaction lows or a break
below support. Ideally, the decline is fairly orderly and lengthy with a
series of declining peaks and troughs that may form a price channel. Less
erratic declines are satisfactory, but run the risk of turning into a
different pattern.
- Consolidation/Retracement: After an extended decline, some sort of
consolidation or retracement can be expected. As a retracement rally (or
reaction rally), prices could recoup 33% to 67% of the previous decline.
Generally speaking, the bigger the decline is, the bigger the reaction rally.
Some retracement formations might include an upward sloping flag or rising
wedge. If the formation turns out to be a consolidation, then a continuation
pattern such as a rectangle or descending triangle could form.
- Continuation Decline - Length: The distance from the high to the
low of the first decline can be applied to the high of the consolidation/retracement
to estimate the length of the next decline. Some technicians like to measure
by points, others in percentage terms. If a security declines from 60 to 40
(20 points) and the consolidation/retracement rally returns to the security to
50, then 30 would be the target of the second decline (50 - 20 = 30). Using
the percentage method, the decline from 60 to 40 would be -33% and projected
decline from 50 would be 16.50. (50 X 33% = 16.50 : 50 - 16.5 = 33.50).
Deciding which method to use will depend on the individual security and your
analysis preferences.
- Continuation Decline - Entry: If the consolidation/retracement
forms a continuation pattern, then an appropriate second leg entry point can
be identified using traditional technical analysis rules. However, if there is
no readily identifiable pattern, then some other signal must be sought. In
this case, much will depend on your trading preferences, objectives, risk
tolerance and time horizon. One method might be to measure potential
retracements (33%, 50% or 62%) and look for short-term reversal patterns.
Another method might be to look for a break below the reaction low set by the
first decline as confirmation of continuation. This method would make for a
late entry, but the Measured (bear) Move pattern would be confirmed.
- Volume: Volume should increase during the reversal decline,
decrease at the end of the consolidation/retracement and increase again during
the continuation decline. This is the ideal volume pattern, but volume
confirmation for bearish patterns is not as important as for bullish patterns.
More than one pattern can exist within the context of a Measured (Bear) Move.
A double top could mark the first reversal and decline, a price channel could
form during this decline, a descending triangle could mark the consolidation and
another price channel could form during the continuation decline.
During multi-year bear markets (or bull markets), a series of Measured (Bear)
Moves can form. A bear move consisting of three down legs might include a
reversal and decline for the first leg, a retracement, a decline for the second
leg, a retracement and finally the third leg decline.
While the projection targets for the continuation decline can be helpful,
they should only be used as rough guidelines. Securities can overshoot their
targets, but also fall short and technical assessments should be ongoing.
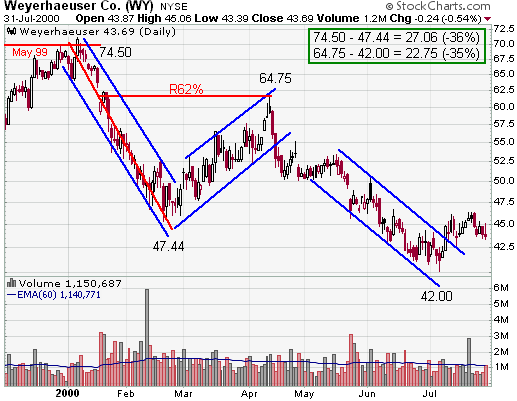
As illustrated in the chart above, the second decline of a Measured (Bear)
Move may not be as orderly as the first, especially when volatile stocks are
involved.
- Prior Trend: After a multi-year bull move, XIRC reached its
all-time high at 69.69 on 31-Dec-99.
- Reversal Decline: The stock broke trendline support in Jan-00 and a
lower low was recorded when the stock dropped below 45 in Feb-00. The decline
took the stock to 29.13 in Apr-00 for a total of 40.56 points down.
- Consolidation/Correction: In April, May and June, the stock
recouped about 50% of its previous decline with a retracement rally to 52.75.
Including the spike high at 52.75, a parallel price channel formed (resembling
a large flag) with support marked by the lower trendline. Excluding the spike
high, the interpretation could have been a rising wedge. Either way, support
was marked by the lower trendline.
- Continuation Decline - Length: The estimated length of the
continuation decline was 40.56 points from the June high at 52.75, which would
target 12.19. Percentage estimates can sometimes be more applicable to
Measured (Bear) Moves, especially if the target appears unusually low. The
decline from 69.69 to 29.13 was 58%. A 58% decline from 52.75 would mark a
target around 22.16 (52.75 x .58 = 30.59 : 52.75 - 30.59 = 22.16).
- Continuation Decline - Entry: Because the consolidation/retracement
portion formed a continuation pattern, entry could have been based on a break
below the support trendline line (red arrows).
- Volume: Volume increased just prior to the trendline support break
in Jan-00 and again when the stock broke below its previous reaction low (blue
arrows). Later when the stock broke trendline support in July, volume also
increased significantly (red arrows).