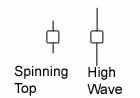
| Spinning Top and High Wave Candles |
CANDLES THAT
EXPRESS DOUBT AND CONFUSION
In a recent educational lesson we explored the "marubozu" candle. The
marubozu, as you may remember, is a long candlestick that lacks either
an upper or lower shadow (and in some cases has no shadows at all).
Here is an interesting question -- which candle is most opposite of the
marubozu? Since the marubozu can be either white or black, the correct
answer here cannot be another marubozu candle. Instead, in my mind,
opposite candles include both spinning tops and high waves.
I've provided you with an illustration of both of these candles below.
Why should these candles be considered
opposites relative to the marubozu? Well, when a marubozu candle occurs,
it shows a great deal of conviction on the part of the market. A black
marubozu portrays a very weak market in which the sellers are eager to
exit and willing to get out of their positions at almost any price.
Meanwhile, a white marubozu portrays the opposite situation, where
buyers are willing to pay higher and higher prices to enter the stock.
By contrast, spinning tops and high wave candles denote situations where
the market is having difficulty coming to a consensus on a security's
value. They portray a market in which uncertainty and indecision
prevail. Neither the buyers nor the sellers have a clear sense of which
direction the market will head. The forces of supply and demand are
equally balanced.
What is the difference between the spinning top and the high wave? In
the spinning top, the shadows are relatively small and the candle has a
very small range. When combined with low volume, traders may be
expressing disinterest.
A high wave candle, on the other hand, portrays a situation where there
is an active tug of war between the bulls and the bears. This candle
shows a market that has lost a clear sense of direction. If it occurs on
high volume, then it indicates the market's general confusion about the
direction prices are headed.
Below is a chart of Barrick Gold (ABX). The last several days of trading
show a spinning top immediately followed by a high wave candle. Volume
on both days was moderate. What the two candles indicate to me is
uncertainty on the part of traders as to which direction Barrick is
headed next.
Along with many other gold stocks, ABX recently broke down from an
Intermediate topping formation when it fell below $21. Since old support
often becomes new resistance, the stock has since encountered selling
pressure near $21. On the other hand, ABX also had strong support at $19
going back to a November consolidation. On the day of the high wave
candle, in one volatile day ABX came close to testing both support and
resistance!
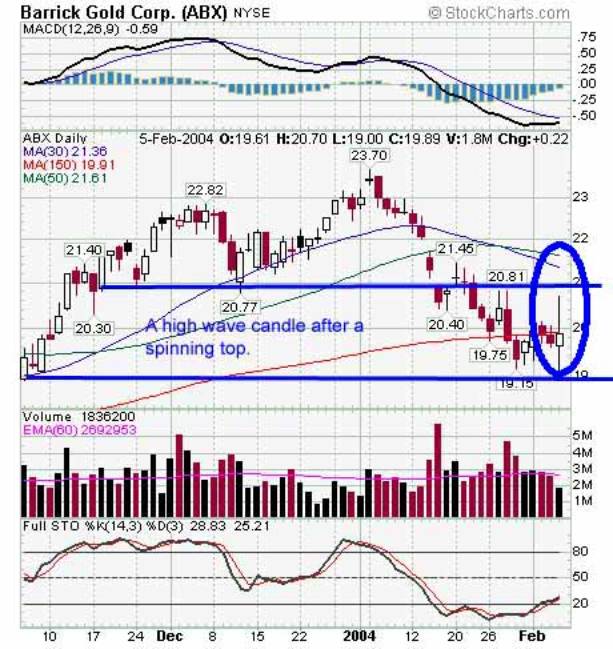 |
Are the bulls or bears correct? Despite the choppy market, stochastics is on a buy signal. The trend-following MACD indicator is also about to give a buy signal on the daily chart. On the weekly chart (not shown here), MACD is still falling hard. What that suggests to me is that ABX may experience a countertrend rally, but one that may not carry very far.
As the old cliché goes -- "when in doubt, stay out." The spinning top and high wave candles express doubt and confusion on the part of the market when it comes to ABX. Until the situation is clear, swing traders should focus on stocks marked by less confusion