 |
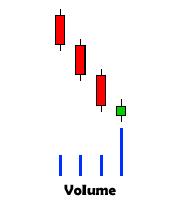
Above Average
Volume--a total daily volume of shares traded which is
greater than the average of the daily volumes over the
previous few days.
Examples: DWTI |
 |
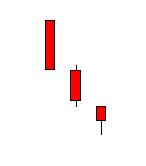
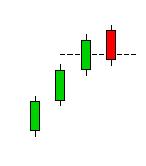
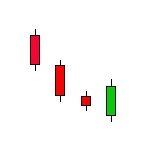
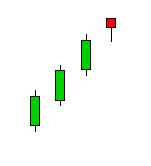
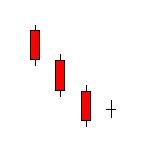
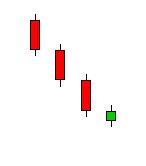
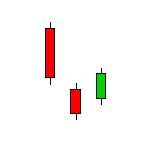
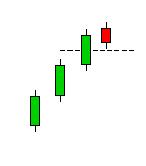
Advance Block
(Bearish)--a three candlestick pattern in which the
last two candlesticks show weakening upside
drive. |
 |
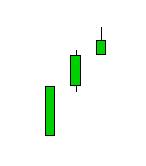
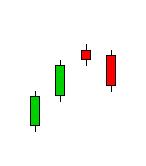
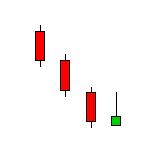
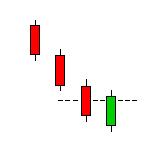
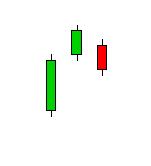
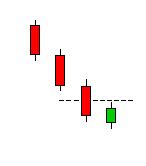
Advance Block
(Bullish)--a three candlestick pattern in which the
last two candlesticks show strengthening downside
drive. |
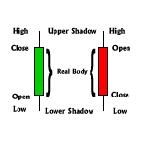 |
Candlestick
Lines--a traditional Japenese chart which consists of
a real body, representing the open and close, and upper and
lower shadows, representing the high and low of the
day. |
 |
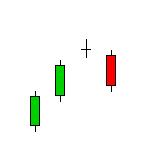
Dark-cloud
cover (Bearish)--a bearish reversal signal. In
an uptrend, a long green candlestick is followed by a long
red candlestick that opens above the prior green
candlestick's high. The second candlestick must close
well into the first candlestick’s real body. |
 |
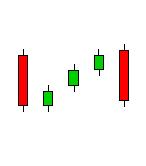
Doji star
(Bearish)--a doji line which gaps from a long green
candlestick.
Examples: MCWS |
 |
Doji star
(Bullish)--a doji line which gaps from a long red
candlestick. |
 |
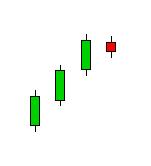
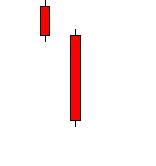
Engulfing
Pattern (Bearish)--a bearish engulfing pattern occurs
when selling pressure overwhelms buying pressure
reflected by long red real body engulfing a small green real
body in an uptrend. |
 |
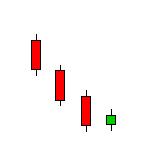
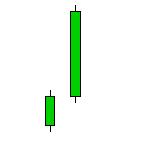
Engulfing
Pattern (Bullish)--a bullish engulfing pattern occurs
when buying pressure overwhelms selling pressure
reflected by long green real body engulfing a small red
realbody in an downtrend. |
 |
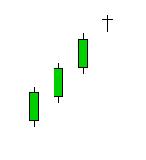
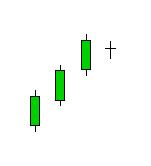
Evening Star
(Bearish)--a top reversal pattern where the first is a
tall real body, the second is a small real body (green
or red) which gaps high to form a star. The third
is a red candlestick which closes well into the first
session's green real body. |
 |
Evening Doji
Star (Bearish)--the same as an evening star except the
middle candlestick is a doji instead of a small real
body. |
 |
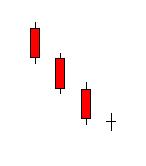
Falling Three
(Bearish)--comprised of five candlesticks, a tall red
real body candlestick preceded three small green real bodies
which hold within the first session's range. Then a red
candlestick closes at a new low. |
 |
Hammer
(Bullish)--a bottoming candlestick line where a small
real body (red or green) at the top of the trading range
with a very long shadow with little or no upper shadow.
Examples: FSCO |
 |
Hanging man
(Bearish)--a small real body (green or red) with
little or no upper shadow. It is a bearish reversal
pattern when appearing during an uptrend.
Examples: PFSW |
 |
Harami
(Bearish)--a two candlestick pattern in which a small
real body holds within the prior session's unusually large
real body. The harami implies that the preceding
trend is getting ready to conclude. |
 |
Harami
(Bullish)--a two candlestick pattern in which a small
real body holds within the prior session's unusually large
real body. The harami implies that the preceding
trend is getting ready to conclude.
Examples: PLCM, CPTL, ABY |
 |
Harami Cross
(Bearish)--a harami with a doji on the second session
instead of a small real body. |
 |
Harami Cross
(Bullish)--a harami with a doji on the second session
instead of a small real body. |
 |
Inverted
Hammer (Bullish)--a candlestick that has a long upper
shadow and a small real body at the lower end of the
session. It is a bullish bottom reversal signal.
Examples: DWTI |
 |
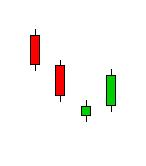
Long Green
Real Body (Bearish)--a relatively long real body with
closing price far above the opening price. |
 |
Long Red Real
Body (Bullish)--a relatively long real body with
closing price far Below the opening price.
Examples: FCS, CBCX, AHAA, ASDV |
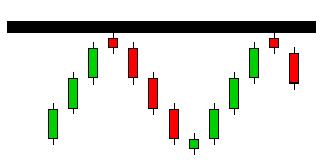 |
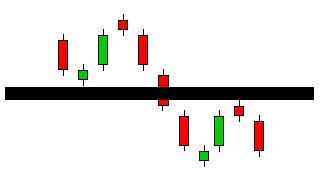
Major Price
Resistance--an area of price where a stock hits
resistance, reverses direction, and then retests the same
general area of resistance a second time.
Examples: PFSW |
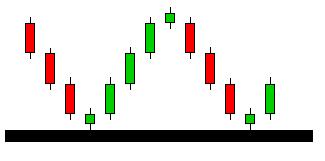 |
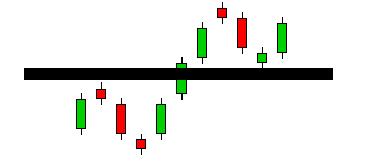
Major Price
Support--an area of price where a stock hits support,
reverses direction, and then retests the same general area of
support a second time. |
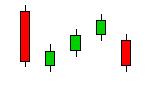 |
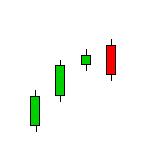
Mat-hold pattern
(Bearish)--a red candlestick is followed by a small
green real body which gaps lower. Then there are two
small green candlesticks which are followed by a bearish red
candlestick. |
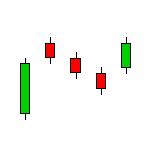 |
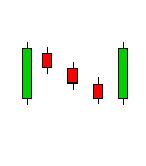
Mat-hold pattern
(Bullish)--a green candlestick is followed by a small
red real body which gaps higher. Then there are two
small red candlesticks which are followed by a strong green
candlestick |
 |
Minor Price
Resistance--an area of price which previously acted as
support, but now serves as price resistance.
Examples: USWB, HIG |
 |
Minor Price
Support--an area of price which previously acted as
resistance, but now serves as price
support.
Examples: FCS, GSLI, CPTL, AHAA |
 |
Morning Star
(Bullish)--a candlestick pattern where the first is a
long red real body, the second is a small real body (green or
red) which gaps lower to form a star. The third is a
green candlestick that closes well into the first session's
red real body. |
 |
Morning
Doji Star (Bullish)--the same as a morning star except
the middle candlestick is a doji instead of a small real
body.
|
|
Moving Averages
(Simple)--calculates the average value of price over a
period of time. As the stock price changes each day, its
average price moves up and down. For example, the 10 Day
Simple Moving Average would be the sum of the price over the
past 10 days divided by 10. The average is called
'Moving' because each new day is added to the total while the
earliest date is removed from the
calculation. |
 |
Piercing
Pattern (Bullish)--a long red candlestick is followed
by a gap lower during the next session. This session
finishes as a bullish green real body which closes more than
halfway into the previous sessions real body. |
 |
Rising Three
(Bullish)--comprised of five candlesticks, a tall
green real body candlestick preceded three small red
real bodies which hold within the first session's range. Then
a green candlestick closes at a new high. |
 |
Shooting Star
(Bearish)--a candlestick with a long upper shadow with
little, or no lower shadow, and a small real body near the
lows of the session. |
 |
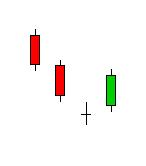
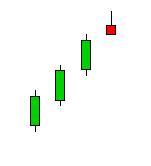
Star
(Bearish)--a small real body which gaps away from the
previous long body. |
 |
Star
(Bullish)--a small real body which gaps away from the
previous long body |
 |
Tasuki Gap
(Bearish)--a red real body gaps lower followed by a
green candlestick of about the same size, which opens in the
red’s real body, and then closes above the red’s real
body. |
 |
Tasuki Gap
(Bullish)--a green real body gaps higher followed by a
red candlestick of about the same size, which opens in the
green’s real body, and then closes below the green’s real
body. |
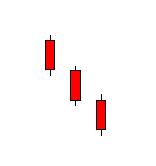 |
Three Crows
(Bullish)--three relatively long consecutive red
candlesticks which close near or on their
lows. |
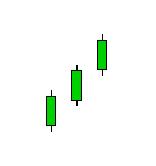 |
Three White
Soldiers (Bearish)--three relatively long consecutive
green candlesticks which close near or on their highs
Examples: HIG, ACS |
 |
Thrusting
Line (Bearish)--a red candlestick which closes in the
prior green's real body, but still above the middle of the
prior session's real body. |
 |
Thrusting
Line (Bullish)--a green candlestick which closes in
the prior red's real body, but still below the middle of the
prior session's real body.
Examples: GSLI |