

Doji
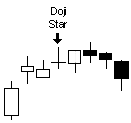
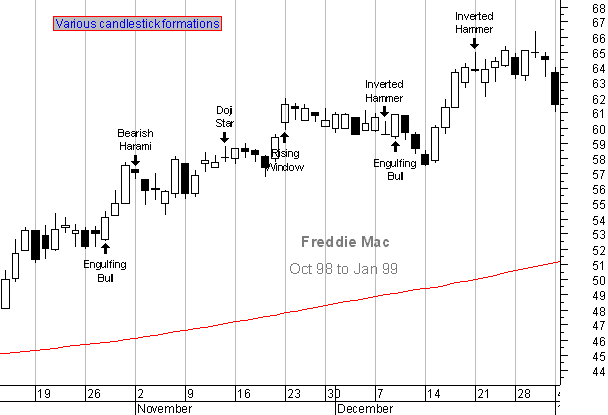
A Doji is a name of a candlestick in Japanese Candlestick charting. This type of charts allow for a quick visual digestion of changing supply and demand patterns. The Doji is one of many types of patterns or candlesticks that give implication as to future price action. The Doji is simply a formation in which the open and close are the same. This candlestick is a component of many important candlestick patterns such as the Doji Star which is a Doji which gaps above or below a white or black candlestick. The Doji star is a reversal signal with confirmation to be made during the next trading period.

![]()
![]()


Japanese's Candlesticks allow for a quick digestion of supply and demand but some of the interpretations of candlestick formations should be supported with a wide body of other information before trading. Most of the Japanese Candlestick patterns are psychologically based interpretations. A type of trading atmosphere that often creates a particular formation of candlesticks or an individual candlestick is the result of a struggle between supply and demand elements and does reoccur but often cannot be used with a high confidence in predicting future price action.

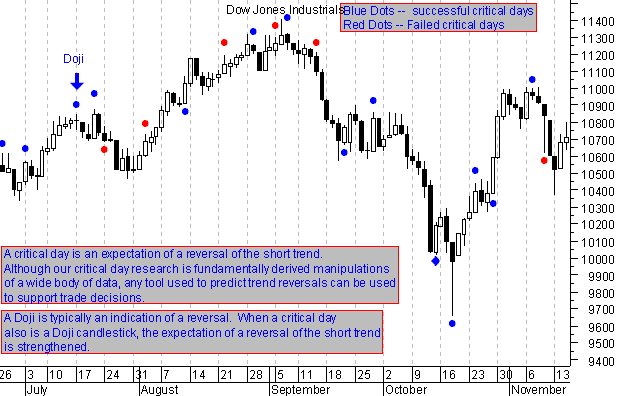
Any tools or patterns that have a consistency in nature can be used to develop trading strategies and better performance. Our critical day research has had a success rate of better than 80%* on the S&P500 Index with an average of 5 signals a month since 1994.

To the right technical studies are examined in more detail to provide a sense of conformational evidence for traders of the critical day. Click on any of the terms to take a closer look at a technical discussion on that topic. All formations, patterns, indicators and technical tools fail at various times and so should only be used to build a body of evidence in forming a trading decision rather than being solely relied upon. There are a number of valuable studies that lead to intuitive understandings about price and volume but a strong compliment to technical analysis is an understanding of the trends and changes in the fundamentals and economic activity that ultimately lead valuation levels in the markets.
Walk through a critical day
| The graphs show a price plot of the Dow Jones Industrials from Sept 28/00 to early November. The First graph ends on November 3/00, two days before an upcoming critical day on November 7/00. Our members looking at the market are expecting a trend reversal to occur due to the high rate of success in our research. Ideally a member will be using their own skills to judge the supply and demand changes, using technical and fundamental indications to confirm suspicions of a reversal, and trade accordingly. |
|
| On the second graph we see that the price action on November 6 was a bullish day, reversing the short trend so that the short trend leading into the critical day is now up. A critical day is an expectation of a reversal of the short trend that immediately precedes the critical day. In the case of the November 7 signal, given to members 3 days before, is an indication that the upward moving trend, recognized at the close of November 6 is expected to reverse direction. |
|
| On the third graph we can see that November 7 was a low volatility after a large gain on November 6 of about 160 points for the Dow Jones Industrials. The subsequent move over the three days following the November 7 signal saw the Dow Jones Industrials fall 376 points. The next day, November 13, the Dow Jones Industrials lost an additional 83 points with intra-day low a full 609 point loss since the open on the critical day. |
|
A closer view of the most recent signals. You can see the short trend immediately prior to a successful critical day, reverses coming away from the critical day. Often a failed critical day will indicate a stronger bias in the market for continuation of the trend that was in place prior to the critical day. A failed signal can therefore provide as much information and opportunity as a successful one. Take a look at tech studies to develop a sense of trend reversals and use.